1. Introduction
In addition to estimates of quarterly labour productivity for the UK, the Office for National Statistics produces annual estimates of labour productivity for the UK regions. These estimates – derived for the Nomenclature of Units for Territorial Statistics (NUTS1) regions – use annual estimates of gross value added (GVA) sourced from the regional accounts and annual estimates of labour input to calculate labour productivity.
Considering the renewed interest in regional policy and following feedback from stakeholders, ONS have been working to improve the range of regional productivity data that we publish. In April 2017, we published experimental estimates of quarterly regional labour input on a consistent basis with equivalent UK-level metrics. In July 2017, we introduced industry-by-region labour productivity metrics on an annual basis, allowing more detailed analysis of productivity at the regional level. In February 2018, we published updated estimates of nominal labour productivity on a regional basis, at the NUTS1, 2 and 3 levels.
In this release, we build on the previous Industry-by-region labour productivity release. In particular, we extend our range of statistics to include estimates of real labour productivity on an industry-by-region basis, enabling analysis of the growth of real output per job and per hour worked for a sixteen-industry breakdown, for each NUTS1 region. Alongside these real labour productivity metrics, we have updated and revised estimates of current price industry-by-region labour productivity to include the latest information from the regional accounts.
As with all our productivity outputs, we welcome user views on the possible uses and usefulness of these data. This is particularly relevant for these experimental statistics. Please provide any feedback via email to Productivity@ons.gov.uk.
Nôl i'r tabl cynnwys2. Data and methods
The estimates published in this release detail labour productivity by industry and region on an output per hour and output per job basis for the period 1997 to 2016. Three components are needed to calculate these measures: regional gross value added (GVA) by industry; regional jobs by industry; and average hours broken down by region and industry.
Regional GVA
Our estimates of regional GVA are taken from the regional accounts, which draw on the Office for National Statistics' (ONS) structural business surveys, the Inter-Departmental Business Register (IDBR) and a range of other sources to estimate value added on an industry by region basis. These regional estimates are measured in terms of the location of economic activity and not based on headquarter location. This measure of output is estimated in both current prices and constant prices and forms the numerator for the productivity measures presented in this release.
To maintain alignment with the National Statistic’s badged regional labour productivity estimates, this release uses two different forms of data from the Regional Accounts. To calculate the current price labour productivity estimates presented here, we use GVA compiled on the income approach (GVA(I)) from the Regional Accounts. These data are consequently consistent with those published in our quarterly labour productivity bulletin. To calculate the constant price labour productivity estimates included in this release, we use chained volume estimates of GVA from the regional accounts compiled on a “balanced” basis. This latter source uses data from both the income and output approaches to GDP measurement to arrive at a single estimate. These data are consequently not strictly comparable with the equivalent current price estimates presented here. A more detailed exposition of the differences between GVA(I) and GVA(B) from the regional accounts is available. ONS will reconsider these differences following consultation with users regarding our headline regional labour productivity metrics.
Regional jobs by industry
Regional jobs are calculated in the same way as the headline, UK-level official statistics, using the same data sources. Information on the number of employee jobs is primarily taken from the Short-Term Employment Survey (STES), the Business Register Employment Survey (BRES) and the Public-Sector Employment Survey. Self-employed and unpaid family worker’s (UFWs) data are taken from the Annual Population Survey (APS), while Her Majesty’s Forces (HMF) data are taken from the Ministry of Defence (MoD) and government support and training (GST) data are taken from the Labour Force Survey (LFS). We constrain the resulting industry-by-region estimates to non-seasonally adjusted jobs for UK industries as well as region totals. Like regional GVA, these estimates refer to the location of labour activity and as such are on a comparable geographic basis. The utilisation of these data sources yields a sample size large enough to produce regional jobs estimates split by industry.
Regional average hours by industry
To generate estimates of regional average hours by industry, the Annual Survey of Hours and Earnings (ASHE) was used to provide average hours estimates for each of the 20 Standard Industrial Classification (SIC) letter industries in each of the 12 NUTS1 regions of the UK.
While ASHE has a larger number of unique respondents than the Labour Force Survey (LFS), ASHE also has the merit of being a survey of businesses about their employees – which is widely thought to avoid some problems of reporting bias and provide more accurate industry allocation, as well as a lower propensity to round reported hours.
However, using ASHE does present some issues compared with using the LFS – which is the primary source for employee average hours in the UK’s main labour productivity system. Firstly, ASHE measures paid usual hours as opposed to actual hours: this means that overtime, leave or sickness – which are relevant for productivity metrics – are not captured by this source. Secondly, ASHE is an annual survey, corresponding to employment during April. This contrasts with the regional GVA data, which is measured on a calendar year basis. To ensure the quality and accuracy of the resulting labour productivity measures, both the numerator and denominator in the productivity ratio should be estimated over the same period. Thirdly, ASHE contains only data for employees. To address these constraints, we have developed an approach to arrive at an annual actual average hour worked figure from ASHE for each industry in each region. A detailed explanation on this methodology can be found in the July 2017 industry-by-region article.
Nôl i'r tabl cynnwys3. Current price output per hour for selected industries
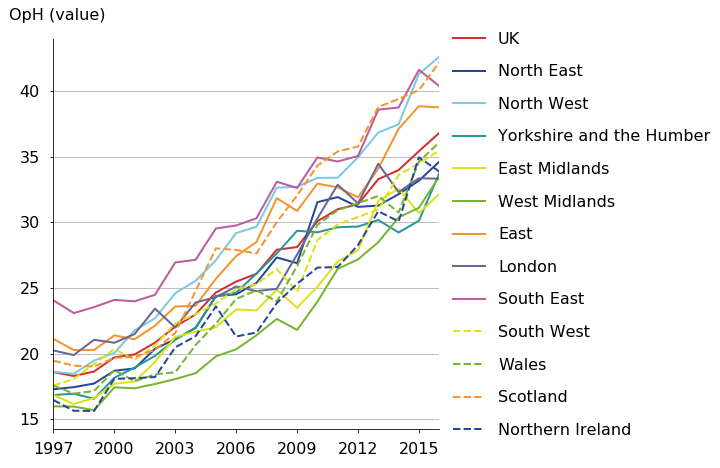
Using industry by region labour productivity data, it is possible to observe how industry productivity varies across the regions of the UK. Figure 1 shows the different levels of labour productivity by region in the manufacturing industry (C), and highlights several interesting trends. In 1997, the South East had the highest level of nominal output per hour in the manufacturing industry compared with other UK regions, with the value of output per hour nearly 30% higher than the UK level. This gap fell gently over the early and mid-2000s, and by 2007, the gap between the South East and the UK was reduced to 16.1%. In the more recent data, two groups started to form - with Scotland, the South East, the North West, and the East showing substantially better performance compared to other UK regions.
Figure 1: Output per hour (CP) values, manufacturing industries (C)
NUTS1 regions, 1997 to 2016, Non-Seasonally adjusted
Source: Office for National Statistics
Download this image Figure 1: Output per hour (CP) values, manufacturing industries (C)
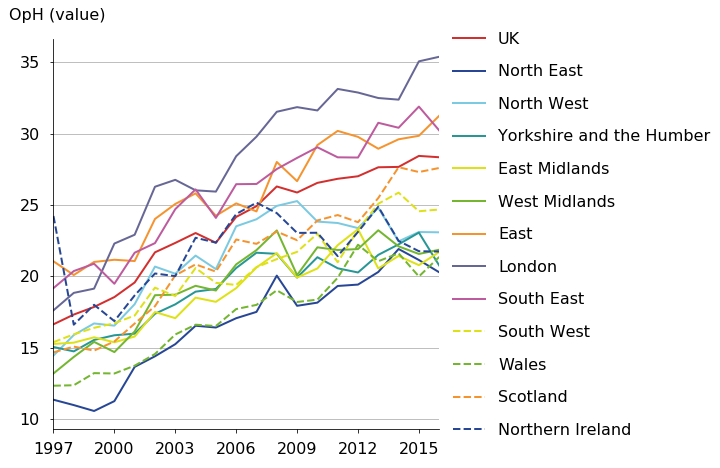
.png (100.6 kB) .xls (34.8 kB)Similar analysis for each of the 16 industries for which data is available suggests that London generally tends to perform strongly compared to the UK’s other regions. This mirrors London’s strong performance as a region, but suggests - in line with previous analysis available – that London has strongly performing firms in all sectors. Figure 2 shows one example of this, presenting the differing levels of labour productivity in the professional, scientific and technical activities (M) industry on a current price basis. Output per hour in this industry also varies across regions. London (£35.40), East of England, (£31.20) and the South East (£30.20) had the highest output per hour value in 2016 and the gap between London and the UK has been widening over time: rising from 6% in 1997 to 25.1% in 2016.
Figure 2: Output per hour (CP) values, professional, scientific and technical activities (M)
NUTS1 regions, 1997 to 2016, Non-Seasonally adjusted
Source: Office for National Statistics
Download this image Figure 2: Output per hour (CP) values, professional, scientific and technical activities (M)
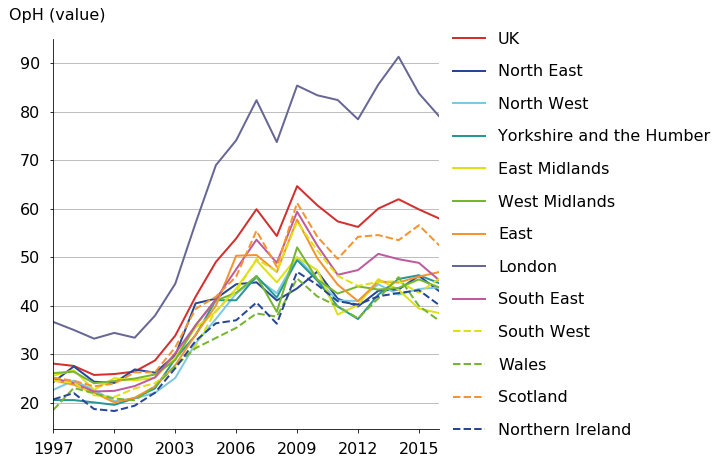
.png (104.2 kB) .xls (34.8 kB)These trends for Professional services are indicative of a common pattern across services, with London sitting above other regions, and the South East and East often outperforming most of the other regions. This trend is particularly pronounced in the financial and insurance industry (K), as shown by Figure 3. Output per hour in London's finance industry was 36% higher than the equivalent UK metric on average between 1997 and 2016. This difference increased over time, rising from 31% to 47% between 1997 and 2014, falling back to 36% in 2016.
Figure 3: Output per hour (CP) values, financial services (K)
NUTS1 regions, 1997 to 2016, Non-Seasonally adjusted
Source: Office for National Statistics
Download this image Figure 3: Output per hour (CP) values, financial services (K)
.png (95.9 kB) .xls (35.3 kB)4. Real (constant price) output per hour for selected industries
Extending on the previous industry-by-region release, ONS are also publishing estimates of regional real labour productivity for a breakdown of 16 industries at the NUTS 1 level as part of this release. These data reflect developments in the Regional Accounts, which included chained volume measure (CVM) estimates of regional Gross Value Added (GVA) for the first time in December 2017. This measure of value added is adjusted for price changes (inflation), creating an index for the volume of output for each industry. While analysis of nominal labour productivity across industry-region combinations gives some idea of how much more or less productive one industry or region is than another, these new, real labour productivity metrics provide a better indication of the productivity growth of industry-region combinations. Estimates of “real” labour productivity can be more volatile than their current price equivalents: we consequently recommend that users focus on multi-year movements, rather than on year on year changes.
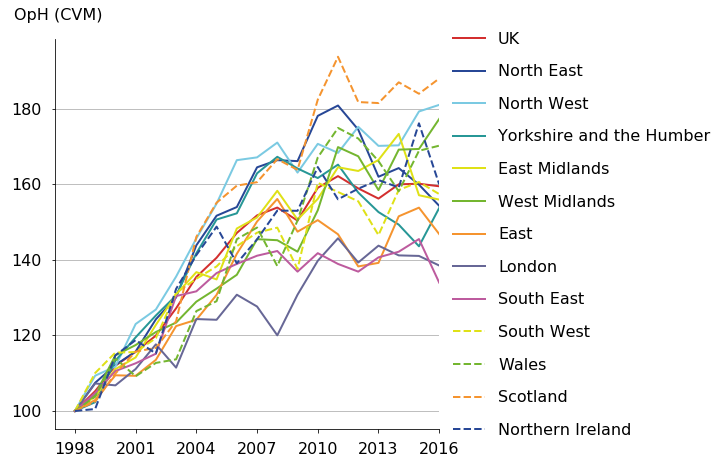
As with the current price labour productivity data, these new estimates support analysis for a large number of industry by region combinations. Figure 4 shows cumulative real output per hour growth in the manufacturing industry (C) in each region. At the UK level, real manufacturing output per hour grew by 51.8% between 1998 and 2007, with the North West (67.1%), North East (64.5%), and Yorkshire and Humber (62.9%) experiencing the fastest real output per hour growth over the same period. While most regions faced a decline in output per hour during the economic downturn, in the period since 2009 the West Midlands (24.7%), Scotland (14.8%), and the South West (14.4%) grew the fastest in output per hour terms, outpacing the UK growth rate (6.1%).
Figure 4: Real output per hour, manufacturing industry (C)
NUTS1 regions, 1998 to 2016, Non-Seasonally adjusted, 1998=100
Source: Office for National Statistics
Download this image Figure 4: Real output per hour, manufacturing industry (C)
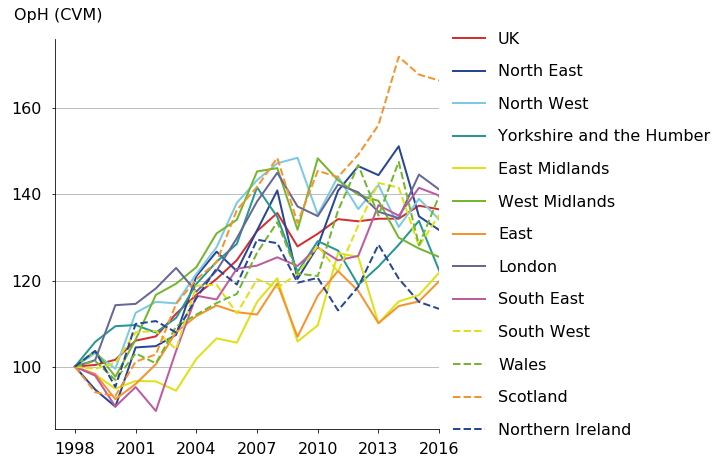
.png (104.1 kB) .xls (34.8 kB)Cumulative output per hour growth for professional, scientific and technical activities (M) is shown in Figure 5. UK labour productivity in this industry grew by 31.5% between 1998 and 2007, with West Midlands (45.3%), North West (43.3%), Scotland (41.7%), and Yorkshire and the Humber (41.6%) experiencing the fastest growth among the UK regions. While the West Midlands experienced one of the largest increases in productivity in professional activities over the pre-downturn period, the region also experienced a sharp fall in real output per hour during the downturn, falling by 9.8% between 2008 and 2009. By 2016, output per hour in the West Midlands was 13.6% lower than its pre-downturn peak (2007).
Figure 5: Real Output per hour, professional, scientific and technical activities (M)
NUTS1 regions, 1998 to 2016, Non-Seasonally adjusted, 1998=100
Source: Office for National Statistics
Download this image Figure 5: Real Output per hour, professional, scientific and technical activities (M)
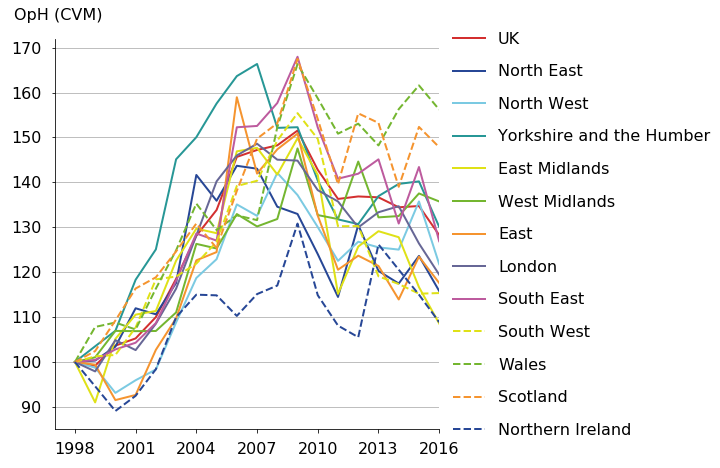
.png (110.3 kB) .xls (36.4 kB)These new data also reveal that, while London has the largest financial services industry, it experienced only the fourth largest growth in real output per hour over the pre-downturn period. This is highlighted in Figure 6 which shows output per hour growth in each region’s financial and insurance industry between 1998 and 2016. Between 1998 and 2007, London experienced only the fourth highest growth rate (48.6%), with Yorkshire and the Humber (66.4%), the South East (52.6%) and Scotland (49.7%) all experiencing faster productivity growth over the period and therefore exhibiting a degree of catch-up with London. Most regions experienced a general fall in financial and insurance services productivity during and just after the economic downturn, with output per hour yet to recover to its pre-downturn level for most regions.
Figure 6: Real output per hour, financial services (K)
NUTS1 regions, 1998 to 2016, Non-Seasonally adjusted, 1998=100
Source: Office for National Statistics
Download this image Figure 6: Real output per hour, financial services (K)
.png (122.0 kB) .xls (35.3 kB)5. Understanding growth in output per hour by industry and region
While some of the output per hour series for industry-by-region combinations can be volatile, this effect is driven by relatively small movements in some of the component parts. To better understand these data, Figures 7 and 8 show the same, cumulative output per hour series presented above, as well as the cumulative contributions of changes in nominal output, price change, jobs and average hours to the movement in industry-by-region labour productivity. Factors which push up on real labour productivity over time – rising nominal output, falling jobs, hours or prices – consequently appear above the horizontal axis, while factors which push down on real labour productivity – falling nominal output, rising jobs, hours or prices – make a negative contribution and consequently appear below the horizontal axis.
Figure 7 shows the cumulative contribution of these four components (shown as bars) to London’s professional, scientific and technical activities industry (M) cumulative output per hour growth (shown as a line) between 1998 and 2016. Output per hour growth in the London professional sector was led almost entirely by current price GVA growth, which experienced high growth throughout this period. The main effects offsetting this rise in GVA were the rising “price” of the output of the industry, and the increase in the number of jobs, both contributing to a slowdown in the growth of output per hour in this industry. Since 2010 the impact of the rise in jobs has been more prominent and has led to a stagnation in output per hour growth for this industry-region combination.
Figure 7: Real cumulative output per hour, Professional, Scientific and Technical Activities (M)
London, 1998 to 2016, 1998=100
Source: Office for National Statistics
Notes:
- Changes estimated as (natural) log changes. For small numbers these can be interpreted similarly to percentage changes.
Download this chart Figure 7: Real cumulative output per hour, Professional, Scientific and Technical Activities (M)
Image .csv .xlsWhile in professional activities the main contribution to output per hour growth was current price GVA, the trend differs when analysing production industries, such as Manufacturing. Figure 8 shows the contribution of the four components (the bars) to Scotland’s Manufacturing output per hour growth (the lines) from 1998 to 2016. Mirroring the UK as a whole, the declining number of jobs has been the main driver of output per hour growth over this period. In Scotland, jobs in manufacturing fell by 45.7% between 2004 and 2012, which contributed positively to output per hour growth. Together, this analysis helps to explain how productivity growth has come about for this industry-region combination, and how the sometimes-sharp movements of output per hour growth are determined by often more gradual movements in its components.
Figure 8: Real cumulative output per hour (KP) values, Manufacturing (C)
Scotland, 1998 to 2016, 1998=100
Source: Office for National Statistics
Notes:
- Changes estimated as (natural) log changes. For small numbers these can be interpreted similarly to percentage changes.
Download this chart Figure 8: Real cumulative output per hour (KP) values, Manufacturing (C)
Image .csv .xls6. Analysis in relation to UK productivity
While trends in productivity in various industry and region combinations are interesting in and of themselves, they also enable a more detailed analysis of contributions to overall output per hour growth rates for the UK as a whole. These data can be used to analyse the UK’s productivity puzzle through the dimensions of both industry and region simultaneously. Labour productivity in an economy can grow because of output per hour growth in its constituent industries, or because of underlying economic changes that put greater weight on more productive activities. The former effect – which is driven by the productivity performance of specific industries – is the direct or “within” industry effect: when productivity in an industry grows (falls), it contributes to (detracts from) overall productivity growth in the economy.
The latter effect – which is driven by changes in the structure of the UK economy – is often called the effect of “re-allocation” on overall productivity growth, and comprises three types of change. Firstly, as labour moves (or is “re-allocated”) from one type of activity to another it can affect overall labour productivity. For instance, if individuals move from relatively low productivity industries into higher productivity industries, then the average level of output per hour in the economy will rise. This effect consequently depends on changes in the weight of labour between industries with different levels of labour productivity – irrespective of the productivity growth rates of those industries.
Secondly, there is a price effect that can alter the weight of different industries in the calculation of productivity. If relative prices increase in high productivity industries, this will tend to increase the share of the economy accounted for by these industries, which in turn affects the overall level of labour productivity. These two effects – as well as a third, “interaction” effect between them – account for the size of the re-allocation effect. Full details of this decomposition are available, and an application of this approach to detailed industry level data on labour productivity is available.
To develop this earlier analysis, this article decomposes whole economy productivity growth into that attributable to each of the 192 industry-region combinations. While care must be taken when interpreting the results of this decomposition, the results are instructive and shed considerable light on the industries and regions driving the UK’s recent economic slowdown. The results of this kind of analysis depend heavily on the granularity of the data used in their estimation: movements of labour and changes in relative prices will clearly appear larger when a larger number of industries are used, which will tend to push up the impact of “re-allocation” forces relative to a more aggregated analysis.
Figure 9 shows the contribution to aggregate productivity growth of industry and region combinations in the (a) five years to 2007 and (b) five years to 2016, for the 20 largest and smallest contributors to UK productivity growth. The contribution to growth in both periods is shown by the blue coloured dots, while the change in these contributions is shown by the bars. The “between industry-region effect” (labelled the “Allocation” effect in the divisional article) is shown alongside these “within industry-region” effects.
Figure 9: Contributions to five-year output per hour growth from the 20 highest and 20 lowest contributors
UK, 2007 and 2016
Source: Office for National Statistics
Notes:
- Extra Regio GVA has been removed from the data and so the whole economy aggregate labour productivity growth figures will be different to those in the main Labour Productivity data set.
- Industry key:
ABDE: Non Manufacturing Production
C: Manufacturing
G: Wholesale And Retail Trade; Repair Of Motor Vehicles And Motorcycles
H: Transportation And Storage
J: Information And Communication
K: Financial And Insurance Activities
L: Real Estate Activities
M: Professional, Scientific And Technical Activities
N: Administrative And Support Service Activities
O: Public Administration And Defence; Compulsory Social Security
P: Education
Q: Human Health And Social Work Activities
ST: Other Service Activities
Download this chart Figure 9: Contributions to five-year output per hour growth from the 20 highest and 20 lowest contributors
Image .csv .xlsThis analysis suggests that both the “within” and the “between” industries components have a role to play in explaining the UK’s productivity growth slowdown between 2007 and 2016. Whole economy output per hour growth slowed from 10.7% in the five years to 2007 to 1.1% in the five years to 2016: a slowdown of 9.6 percentage points. London’s financial and insurance industry was the largest single industry-region combination contributing to this fall. Its contribution to five-year UK productivity growth fell from 0.9 percentage points to minus 0.5 percentage points in the years to 2007 and years to 2016. Manufacturing industries also appear in 9 of the bottom 20 industry-region combinations, with these regional manufacturing industries contributing -3.2 percentage points in total to the slowdown in productivity growth. Positive effects on whole economy growth mainly came from real estate (L) in various regions, alongside Wholesale and retail in the South East and West Midlands. Overall, only 82 of the 192 industry-region combinations had a positive change between the two time periods.
Alongside these within industry effects, there is a substantial contribution which comes from the between industry-region allocation. In both periods, the effect was positive – pushing up aggregate labour productivity growth by increasing the amount of labour applied to more highly productive industry-region combinations, but it sharply fell in the second period. In the five years to 2007, the between industry-effect added 2.3% to aggregate labour productivity growth, falling to 0.1 percentage point in the five years to 2016.
Nôl i'r tabl cynnwys