Cynnwys
- Introduction
- In 2017, the South East had the highest productivity growth in services (excluding finance) and Wales had the highest productivity growth in manufacturing
- How output per hour for manufacturing and services (excluding finance) have evolved over the past two decades
- Impact of introducing regional gross value added (balanced) estimates in regional productivity
- Conclusions
- Links to related statistics
- Authors and acknowledgments
1. Introduction
In July 2017, Office for National Statistics (ONS) introduced an experimental annual dataset of industry by region productivity estimates. The dataset includes region by industry estimates of productivity jobs, productivity hours as well as output per job and per hour; the latter two in current prices, chained volume measures and as an index relative to the UK average.
These annual estimates present 16 industries using the Standard Industrial Classification: SIC 2007 section groups for each of the regions by Nomenclature of units for territorial statistics level 1 (NUTS1) for the years 1997 to 2017.
We calculate productivity using annual estimates of gross value added (GVA) sourced from the regional accounts, which were published in December 2018, and annual estimates of labour inputs. Further information explaining the methodology and sources used to compile these industry by region labour metrics of productivity can be found in an article. Although the methodology differs from the National Statistics estimates presented in the Labour productivity statistical bulletin, which incorporate current price estimates of output per hour and job by the NUTS1 regions relative to the UK, they have been welcomed by regional users.
These datasets contain annual series, and are published every quarter along with the Labour productivity statistical bulletin. Revisions during the quarterly publications only result from revisions to labour inputs because the GVA estimates are sourced from the annual regional GVA estimates of economic activity by UK country and region, which are published once a year in December.
In this article we will be presenting the first estimates of industry by region for 2017, explaining how growth from each of the NUTS1 regions compares with the annual productivity growth for the corresponding period in the UK. We will also be discussing how manufacturing and services excluding finance, the largest industry groups in the UK, have grown across the regions.
Finance has been excluded from services due to its particularly high output per hour. This is caused by the large disparity between the hours worked and the output generated from that industry group. Productivity hours in the finance sector for 2017 accounted for 3.6% of those in the UK while at the same time the output of the finance sector accounted for 7.1% of the UK’s output, resulting in finance generating an output per hour of £66.80 compared with an average of £33.40 per hour for all output. In addition, the activities of the finance industry are concentrated in London and the South East, accounting for approximately 60% of the industry output in these two regions, which can also bias comparability of services across the regions.
In the final part of the article we will be providing an advance indicative estimate of the magnitude of revisions, which will occur if we adopt regional accounts estimates on a “balanced” GVA(B) basis rather than the “income” approach GVA(I) as the measure of nominal GVA used in calculations of current price labour productivity. In our previous article we explained how GVA(I) is used as an input in calculating nominal GVA in the NUTS1 regions. However, as GVA(B) was badged as a National Statistic in November 2018, following a review by the Office for Statistics Regulation, we are considering replacing the GVA(I) input series with GVA(B).
At the next productivity user forum, planned in March 2019, we will be discussing the possibility of introducing a dedicated annual publication as part of the Productivity theme day publications, to present and analyse statistics on industry by region.
As with all our productivity outputs, we welcome user views on the possible uses and usefulness of these data. This is particularly relevant for these Experimental Statistics as we are also working in co-operation with the UK Statistics Authority to badge these datasets as National Statistics. Please provide any feedback via email to Productivity@ons.gov.uk.
Nôl i'r tabl cynnwys2. In 2017, the South East had the highest productivity growth in services (excluding finance) and Wales had the highest productivity growth in manufacturing
UK labour productivity for 2017, as measured by output per hour, grew by 0.9% compared with the previous year. Even though this was markedly higher than the decline of 0.5% in 2016, it lags behind the average growth rate before the downturn of 2.1%.
This growth in labour productivity varied significantly across the geographic regions and industries. Although these are our first estimates of regional data for 2017, volatility in industry by regions is not uncommon when comparing growth rates with the previous period.
Services (excluding finance) and manufacturing are the focus of this section due to them having the largest share of hours and output compared with the whole economy. Services’ (excluding finance) share of hours and output was 76.3% and 72.1% respectively. Manufacturing’s share of hours and output was 9.0% and 10.1% respectively.
In 2017, output per hour in services (excluding finance) increased by 1.0% in the UK. Figure 1 shows growth in output per hour in services excluding finance by each of the Nomenclature of units for territorial statistics level 1: NUTS1 regions of the UK in 2017. The South East recorded the largest increase in productivity for services of 4.1%, which reflects an increase in output of 1.1% with a decrease in hours worked of 2.9%. In contrast, Northern Ireland recorded the lowest productivity growth for this industry group (where productivity fell), of 1.1% during the same period, reflecting stronger growth in hours worked compared with output.
Figure 1: Output per hour growth in services (excluding finance), by region
UK, 2017
Embed code
Output per hour in manufacturing for the UK grew faster than services, at 1.7% in 2017, though growth varied significantly across the regions. Figure 2 shows growth in output per hour in manufacturing by each of the NUTS1 regions of the UK in 2017. Wales and the West Midlands recorded strong growth of 9.2% and 6.4% respectively, while London and Northern Ireland recorded the largest declines in manufacturing productivity, of 6.6% and 5.4% respectively.
Although manufacturing productivity in London has been declining since 2013, the decrease in Northern Ireland is due to a higher growth rate of 14.4% in 2015, followed by two consecutive years of declining growth in 2016 and 2017. This may represent some reversion towards a mean growth rate.
Manufacturing output per hour in Wales reflected a strong increase in output growth (5.0%) with a decrease in average hours worked of 3.8%. Similarly, in the West Midlands growth in output (4.7%) was recorded with a decrease in average hours worked of 1.6%. These both reflect long-term UK-wide trends in manufacturing productivity growth which, pre-2008, delivered growth in productivity through delivering the same or growing output with fewer labour inputs.
Figure 2: Output per hour growth in manufacturing, by region
UK, 2017
Embed code
3. How output per hour for manufacturing and services (excluding finance) have evolved over the past two decades
Figures 3a and 3b show the different levels of labour productivity by region in manufacturing industry (C) and services (excluding finance) (G to J and L to T) relative to the UK average, and highlight several interesting trends.
In 1997, the South East had the highest level of output per hour in the manufacturing industry compared with other UK regions, with the value of output per hour 24.3% higher than the UK average. This gap between the South East and the UK reduced over the early and mid-2000s, and by 2007 was 14.1%. As of 2017, the South East’s previous lead in manufacturing productivity had further been diminished to 11.1%. In the more recent data, two groups started to form – with the North West, the South East and Scotland showing substantially better performance compared with other UK regions.
In 1997, London had the highest level of output per hour in the services industries (excluding finance) compared with other UK regions, with the value of output per hour 21.4% higher than the UK average. This gap between London and the UK rose intermittently over the early and mid-2000s, and by 2007, was 24.8%. In the 20-year period since 1997, London’s relative output per hour in services (excluding finance) has increased slightly by 4.1 percentage points to 25.6%. In the more recent data, the trend of high productivity in services (excluding finance) continues in London and the South East.
Figure 3a: Output per hour in manufacturing relative to UK average
UK, 1997 and 2017
Source: Office for National Statistics
Download this chart Figure 3a: Output per hour in manufacturing relative to UK average
Image .csv .xls
Figure 3b: Output per hour in services (excluding finance) relative to UK average
UK, 1997 and 2017
Source: Office for National Statistics
Download this chart Figure 3b: Output per hour in services (excluding finance) relative to UK average
Image .csv .xlsFigure 4 presents output per hour for manufacturing and services (excluding finance) in the UK economy by each of the regions. London retains the highest output per hour in services (excluding finance), while the North West, Scotland and the South East recorded the largest output per hour in manufacturing.
The East Midlands ranks as the least productive region in manufacturing and second-worst in services (excluding finance). Yorkshire and The Humber was the second-least productive region in manufacturing. Wales was the least productive region for services (excluding finance), with Yorkshire and The Humber being the third-least productive region in services (excluding finance).
Figure 4: Output per hour in manufacturing and services (excluding finance)
UK, 2017

Source: Office for National Statistics
Notes:
Output per hour is in chained volume measures.
G to J and L to T: Services (excluding finance).
Download this image Figure 4: Output per hour in manufacturing and services (excluding finance)
.png (70.3 kB) .xls (10.6 kB)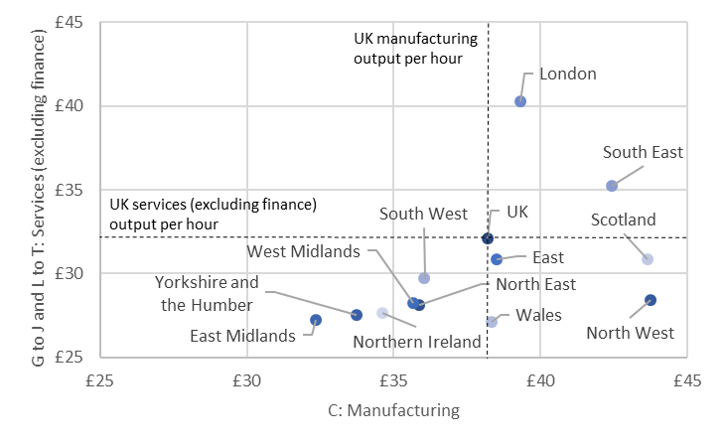
4. Impact of introducing regional gross value added (balanced) estimates in regional productivity
Our estimates of regional gross value added (GVA) are sourced from the regional accounts, which are compiled using the Office for National Statistics’ (ONS) structural business surveys, the Inter-Departmental Business Register (IDBR) and a range of other sources to estimate value added on an industry by region basis.
The regional estimates are measured by the location of economic activity rather than the headquarter location.
Output is estimated in both current prices and chained volume measures, and forms the numerator for the productivity measures presented in the industry by region datasets.
In order to align these experimental datasets with the National Statistics regional labour productivity release, as far as possible, we have used two different forms of data from the regional accounts. We use GVA compiled on the income approach (GVA(I)) from regional accounts to calculate current price labour productivity estimates and we use GVA on a balanced basis (GVA(B)) to compile chained volume estimates of industry by regional labour productivity. GVA(B) estimates are also available in current prices and typically differ from the equivalent GVA(I) estimates in the open years.
As the GVA(B) estimates were recently badged as National Statistics, we would like to harmonise these experimental datasets with the headline estimates of regional accounts. It is important to note that GVA(I) and GVA(B) are identical for the UK for the years that have been through the supply and use balancing process. Therefore there are no discrepancies to total UK output per hour as GVA(I) and GVA(B) are identical for the balanced years.
However, 2017 is an open year and has not undergone the supply and use balancing process and therefore GVA(I) and GVA(B) are not equal, with the difference being represented in the statistical discrepancy in GVA(I).
Figure 5 shows the average yearly revision to the levels of output per hour in current prices, for each of the Nomenclature of units for territorial statistics level 1: NUTS1 regions, comparing the time intervals up to 2008 and post-2008 when replacing GVA(I) with GVA(B). The largest average upward revision is observed in London for both the pre- and post-2008 intervals at 3.9% and 2.5% respectively, while most of the other regions are recording negative revisions. The largest average downward revision is noted in the East of England for the post-2008 interval at negative 2.5%.
Figure 5: Average revision, gross value added GVA I to GVA B
UK, 1998 to 2008 and 2008 to 2016
Source: Office for National Statistics
Download this chart Figure 5: Average revision, gross value added GVA I to GVA B
Image .csv .xls5. Conclusions
We have been publishing experimental labour productivity industry by region statistics since April 2017 and although these datasets are compiled using a different methodology to the National Statistics, users have found them a useful resource. These statistics have provided greater insight on how varied labour productivity is across the regions and the industries within the regions compared with the UK.
Working closely with the UK Statistics Authority we would like to badge these datasets as National Statistics and present them in a dedicated statistical bulletin that will analyse regional and industry by region labour productivity in current prices, volumes and relative to the UK.
As part of our continuous improvement in methods and data sources we would like to replace our current price regional output series from GVA(I) (income approach) to GVA(B) (balanced basis) as the latter were recently badged as National Statistics. We have provided an indicative estimate on the extent to which this new data source will revise the industry by regional data, even though there will be no impact at the national levels for the supply and use balanced years, up to and including 2016.
We will be discussing these developments at the next productivity user forum and we would welcome users’ views. Please provide any feedback via email to Productivity@ons.gov.uk
Nôl i'r tabl cynnwysManylion cyswllt ar gyfer y Erthygl
Related publications
- Developing experimental estimates of investment in intangible assets in the UK: 2016
- Regional and sub-regional productivity in the UK: February 2019
- [Unpublished] /economy/economicoutputandproductivity/publicservicesproductivity/articles/publicserviceproductivityadultsocialcareenglandfinancialyearending2018/2019-02-06