Cynnwys
- Main points
- Latest indicators at a glance
- Shelf availability of items from UK shops
- Retail footfall
- UK spending on debit and credit cards
- Vehicle flows around ports
- Road traffic in Great Britain
- System average price (SAP) of gas
- Online job adverts
- Transactions at Pret A Manger
- UK flight data
- Shipping
- Social impact of coronavirus
- OpenTable seated diners
- Data
- Glossary
- Measuring the data
- Strengths and limitations
- Related links
1. Main points
Shelf availability of items between 29 October and 1 November 2021 were lowest for the "sparkling water" category with 23% of this item's availability marked as none or low; shelf availability was the highest for the "beer" category – 72% of this item was recorded as being high availability (Kantar Public). Section 3.
Overall retail footfall in the UK rose by 11% in the week to 30 October 2021 and was 89% of the level seen in the equivalent week of 2019 (Springboard). Section 4.
In the week to 28 October 2021, the aggregate CHAPS-based indicator of credit and debit card purchases increased by 3 percentage points from the previous week, reverting to its February 2020 average; the "delayable", and "staple" categories both increased by 4 percentage points, with "work-related" up 8 percentage points this week. (Bank of England CHAPS data). Section 5.
Average 15-minute counts of all vehicles on the strategic roads network around English ports increased in August 2021 by 8 percentage points on the previous month, to 98% of its February 2020 level. Section 6.
The volume of motor vehicle traffic on 1 November 2021 was at 96% of its level in the first week of February 2020, unchanged from the previous week (Department for Transport). Section 7.
In the week ending 31 October 2021, the seasonally adjusted average count of traffic camera activity for cars in London grew by 2% from the previous week, to 112% of the average level seen in the week before the first UK-wide lockdown (week ending 22 March 2020) (Transport for London). Accompanying dataset.
The system average price (SAP) of gas decreased by 11% in the week to 31 October 2021; this was the largest week-on-week decrease since February 2021, however, the SAP of gas remains 335% higher than the February 2021 level (National Grid).Section 8.
The total volume of online job adverts was 6% higher on 29 October 2021 than the previous week, and now stands at 142% of its February 2020 average level; the "transport, logistics and warehouse" category continues to be more than four times higher than its February 2020 average level (Adzuna). Section 9.
Transactions at Pret A Manger stores in the week ending 28 October 2021 remained lowest in London city and London airports stores at 80% and 82% of the January 2020 average, respectively (Pret A Manger). Section 10.
The seven-day average number of UK daily flights was 3,666 in the week ending 31 October 2021, which is 60% of the level seen in the equivalent week of 2019 (EUROCONTROL). Section 11.
There was an average of 271 daily ship visits in the week to 31 October 2021, a 4% decrease from the previous week at 283; the average number of daily cargo and tanker ship visits was broadly similar to the previous week at 88 (exactEarth). Section 12.
Nearly two-fifths (37%) of currently trading businesses reported the prices of materials, goods or services bought in the last month had increased by more than normal price fluctuations, while 15% reported prices of materials, goods or services sold had increased; both have increased compared with early September 2021, by 7 and 4 percentage points, respectively. Business insights and impact on the UK economy: 4 November 2021.
Of the 96% of adults who left their home in the past seven days, 83% reported wearing a face covering; this was broadly similar to the previous period (Opinions and Lifestyle Survey, 20 to 31 October 2021). Section 13.
The seven-day average estimate of UK seated diners in the week to 1 November 2021 was 129% of the level in the equivalent week of 2019; the corresponding figures for Manchester and London were 145% and 89%, respectively (OpenTable). Section 14.
There were 6,868 compulsory dissolution first gazettes (a notice issued by Companies House indicating their intention to remove a company from the register) in the week to 26 October 2021 (Companies House). Accompanying dataset.
There were 5,682 voluntary dissolution applications (an application from a company to dissolve) in the week to 29 October 2021, broadly similar to the previous week and 13% lower than the equivalent week of 2019 (6,509) (Companies House). Accompanying dataset.
There were 14,254 company incorporations in the week to 29 October 2021, a decrease of 14% from the previous week and an 18% increase from the equivalent week of 2019 (12,089) (Companies House). Accompanying dataset.
Results presented in this bulletin are experimental and may be subject to revision.
2. Latest indicators at a glance
Embed code
3. Shelf availability of items from UK shops
Shelf availability research for shops across the UK has been undertaken by Kantar Public. Collectors gathered information on a range of items from up to three different stores across multiple locations, recording availability across four categories: none, low, medium, or high. It is important to note these categories are subjective as they are recorded by individual collectors. The data were collected between 29 October and 1 November 2021. This new series will be updated weekly.
Figure 1: Shelf availability of items sold in UK stores between 29 October and 1 November 2021 were lowest for “sparkling water” category, with 23% of items either “none” or “low”
Item availability in stores across 128 locations covering UK countries and English regions
Source: Kantar Public
Notes:
- Shelf availability does not imply stock availability in warehouses or storage units and is simply the level of available products in a selected sample of shops at the time of data collection.
- Total count of shops visited were 275 and total observations made were 5,604.
- Categories in this chart have been rounded for illustrative purposes and may not sum to category total or 100.
Download this chart Figure 1: Shelf availability of items sold in UK stores between 29 October and 1 November 2021 were lowest for “sparkling water” category, with 23% of items either “none” or “low”
Image .csv .xlsThe overall proportion of observations for all items recorded as ‘High’ was 54%. Across the four included availability categories, the largest proportion of observations recorded as ‘High’ was for beer at 72%, with milk and sparkling water the lowest at 43%. For shelf availability recorded as either ‘None’ or ‘Low’, sparkling water saw the highest proportion at 23%, followed by frozen turkey at 22%.
Nôl i'r tabl cynnwys4. Retail footfall
National retail footfall figures are supplied by Springboard, a provider of data on customer activity. They measure the following for overall UK retail footfall, as well as by high street, retail park, and shopping centre categories:
daily retail footfall as a percentage of its level on the same day of the equivalent week of 2019; for example, Saturday 30 October 2021 is compared with Saturday 26 October 2019
total weekly retail footfall as a percentage of its level in the equivalent week of 2019
the percentage change in weekly footfall compared with the previous week; for example, Week 43 of 2021 is compared with Week 42 of 2021
Springboard's weekly data are defined over a seven-day period running from Sunday to Saturday. Week 43 of 2021 therefore refers to the period Sunday 24 October to Saturday 30 October 2021.
Users should note that all quoted figures have been rounded to the nearest integer.
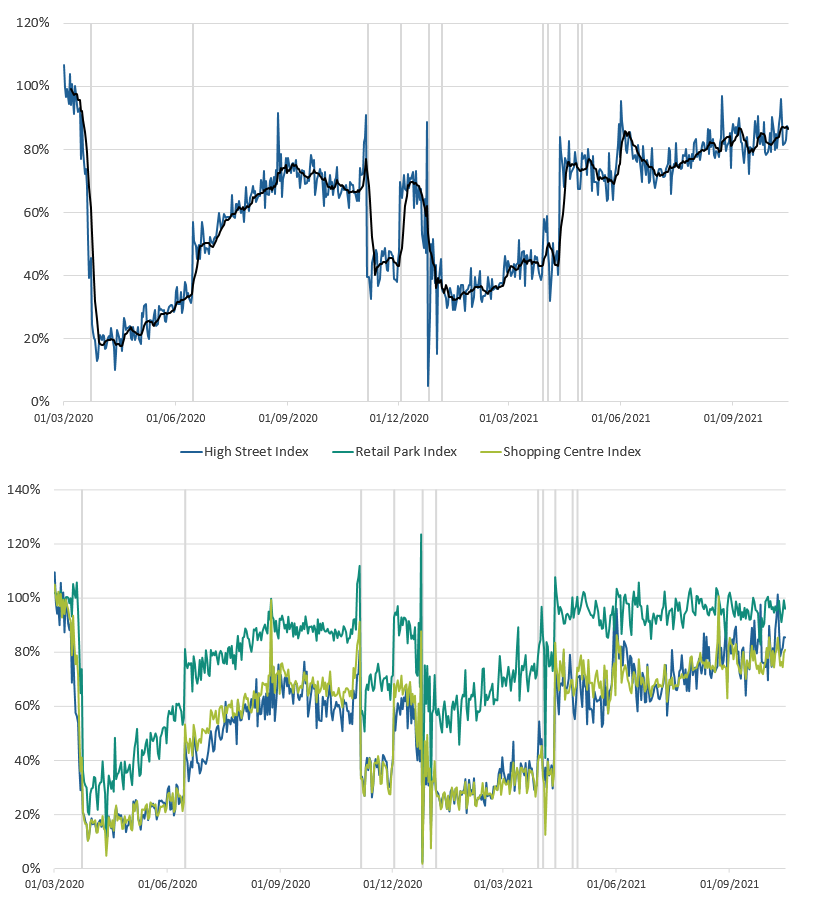
Figure 2: Overall retail footfall in the UK rose by 11% in the week to 30 October 2021, and was 89% of the level seen in the equivalent week of 2019
Volume of overall daily retail footfall, percentage compared with the equivalent day of the equivalent week of 2019, 1 March 2020 to 30 October 2021, UK
Source: Springboard, The Department for Business, Energy and Industrial Strategy
Notes:
- The vertical lines indicate notable events and coronavirus (COVID-19) restriction changes.
- Users should note that week-on-week changes in retail footfall volumes are outlined as percentages, rather than as percentage point changes. Percentage change figures quoted in the commentary will therefore not necessarily match the percentage point changes observed in the chart.
Download this image Figure 2: Overall retail footfall in the UK rose by 11% in the week to 30 October 2021, and was 89% of the level seen in the equivalent week of 2019
.png (131.5 kB)
According to Springboard, in the week to 30 October 2021, the volume of overall retail footfall in the UK:
for high streets increased by 12% from the previous week and was 88% of the level seen in the equivalent week of 2019
for retail parks increased by 5% from the previous week and was 97% of the level seen in the equivalent week of 2019
for shopping centres increased by 15% from the previous week and was 84% of the level seen in the equivalent week of 2019
This large weekly increase was in part driven by the late October school half-term holiday.
Regional retail footfall
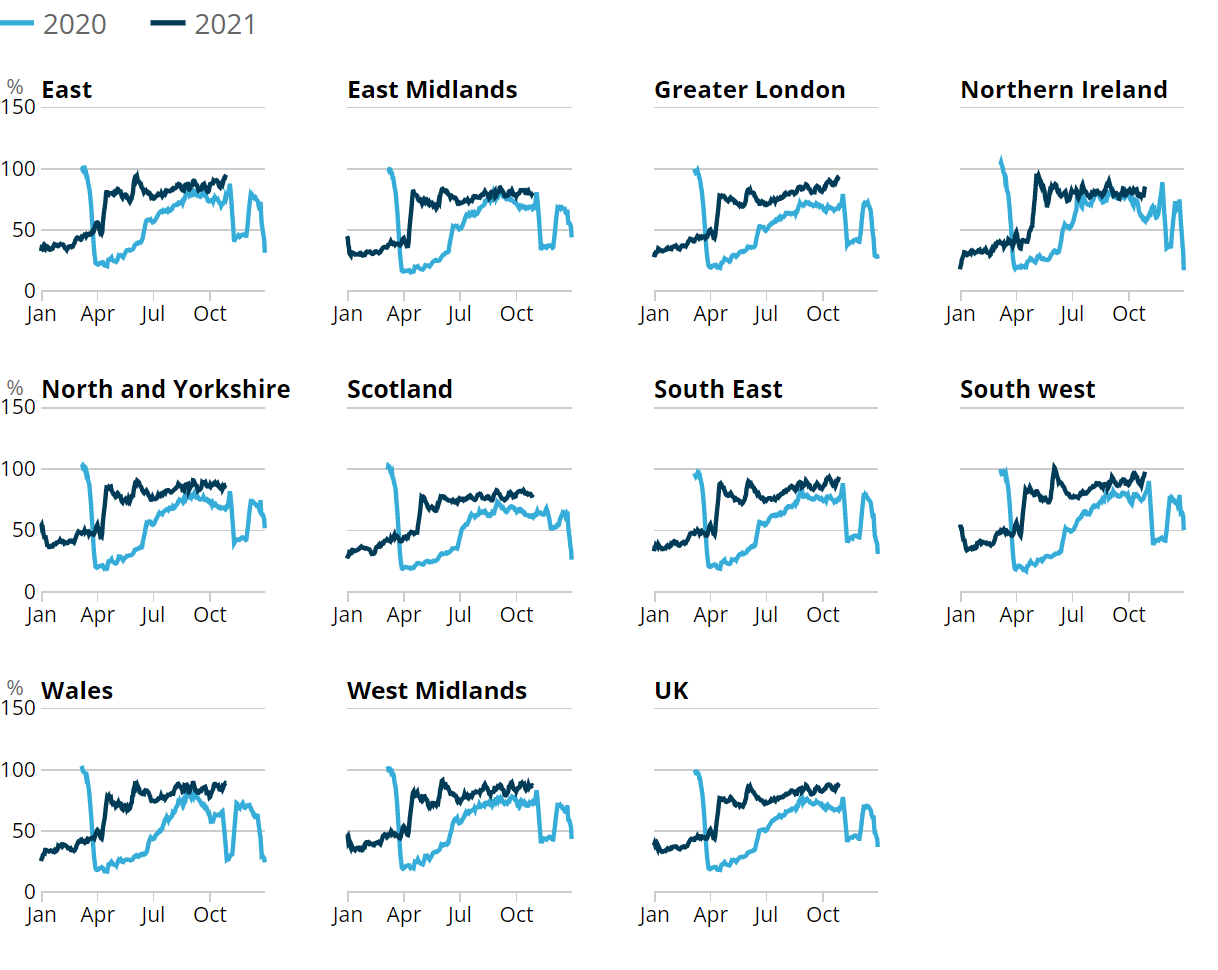
Figure 3: The South West of England had the highest retail footfall relative to pre-pandemic levels in the week to 30 October 2021, at 98% of the level in the same week of 2019
Volume of daily retail footfall, percentage of the level recorded on the same day of the equivalent week of 2019, seven-day rolling average, UK countries and English regions, 1 March 2020 to 30 October 2021
Source: Springboard, The Department for Business, Energy and Industrial Strategy
Download this image Figure 3: The South West of England had the highest retail footfall relative to pre-pandemic levels in the week to 30 October 2021, at 98% of the level in the same week of 2019
.png (92.9 kB)
In the week to 30 October 2021, retail footfall saw a week-on-week increases in 9 of the 10 UK countries and English regions, the largest occurring in Northern Ireland, which increased by 26% following the relaxation of some coronavirus (COVID-19) restrictions. Retail footfall in Scotland remained broadly similar to the previous week – the school half-term holiday in Scotland was earlier in October.
In the same week, relative to the levels seen in the equivalent week of 2019, retail footfall was strongest in the South West at 98%, followed by the East at 95%. In contrast, retail footfall was weakest in Scotland and the East Midlands at 79% and 80%, respectively.
Nôl i'r tabl cynnwys5. UK spending on debit and credit cards
Daily CHAPS-based indicator
These data series are experimental faster indicators for estimating UK spending on credit and debit cards. They track the daily CHAPS payments made by credit and debit card payment processors to around 100 major UK retail corporates. These payments are the proceeds of recent credit and debit card transactions made by customers at their stores, both via physical and via online platforms. More information on the indicator is provided in the accompanying methodology article.
Companies are allocated to one of four categories based on their primary business:
"staples" refers to companies that sell essential goods that households need to purchase, such as food and utilities
"work-related" refers to companies providing public transport or selling petrol
"delayable" refers to companies selling goods whose purchase could be delayed, such as clothing or furnishings
"social" refers to spending on travel and eating out
Figure 4: The aggregate CHAPS-based indicator of credit and debit card purchases increased by 3 percentage points in the week to 28 October 2021, equalling its February 2020 average
Index February 2020 = 100, a backward looking seven-day rolling average, 13 January 2020 to 28 October 2021, non-seasonally adjusted, nominal prices, UK
Source: Office for National Statistics and Bank of England calculations
Notes:
- Users should note the daily payment data are the sum of card transactions processed up to the previous working day, so there is a slight time lag when compared with real-life events on the chart.
- The vertical lines indicate notable events and coronavirus (COVID-19) restriction changes.
- Percentage point difference is derived from current week and previous week index before rounding.
- Data for one sub-sector with 15% weight in the “social” spending category were imputed for the period of 12 August to 30 September 2021 following data availability issues. These have now been resolved.
Download this chart Figure 4: The aggregate CHAPS-based indicator of credit and debit card purchases increased by 3 percentage points in the week to 28 October 2021, equalling its February 2020 average
Image .csv .xlsFigure 4 shows changes in the value of CHAPS payments received by large UK corporates from their credit and debit card processors, "merchant acquirers".
All spending categories, excluding "social" increased in this latest week:
- "delayable" increased by 4 percentage points
- "staple" increased by 4 percentage points
- "work-related" increased by 8 percentage points
- "social" decreased by 1 percentage points
In the latest week, "delayable'', and ''social" spending were below their February 2020 average level at 98% and 94% respectively. Conversely, "staple" and "work-related" spending were above their February 2020 average level at 105% and 113% respectively.
Nôl i'r tabl cynnwys6. Vehicle flows around ports
These data are taken from locations on the Strategic Road Network (SRN). The SRN is made up of the motorways and major trunk roads in England managed by Highways England. It does not cover locally managed motorways or B roads. The data include detailed vehicle flows for important roads serving 13 selected major ports within a 10-kilometre radius of each port location.
It is important to note that these data are compiled using different methods and sensors than the Department for Transport's (DfT's) daily time series on road traffic in Great Britain. The DfT series are based on the automatic traffic counter sites used in the Quarterly Road Traffic National Statistics publication, which are stratified and weighted to be representative of national traffic.
More information on the methods, quality and economic analysis for these indicators can be found in Faster indicators of UK economic activity: road traffic data for England.
Figure 5: Average counts of vehicles over 11.66 metres in length rose to 2% above February 2020 levels, the highest level for these vehicles since December 2020
Average sensor count per 15-minute observation, roads on the strategic road network around ports in England, December 2018 to August 2021, seasonally adjusted
Source: Highways England webTRIS data
Download this chart Figure 5: Average counts of vehicles over 11.66 metres in length rose to 2% above February 2020 levels, the highest level for these vehicles since December 2020
Image .csv .xlsThe breakdown of average sensor counts around English ports by vehicle category are:
greater than 11.66 metres (larger rigid lorries and coaches, articulated lorries)
6.6 to 11.66 metres (rigid lorries, buses)
5.2 to 6.6 metres (panel vans, minibuses)
less than 5.2 metres (cars, motorcycles)
On select roads in a 10-kilometre radius of English ports in August 2021, sensor counts of both vehicles between 6.6 and 11.66 metres and over 11.66 metres increased by 4 percentage points on the previous month, to 3% and 2% above February 2020 levels respectively. Of the major ports in this index, the largest month-on-month increase of sensor counts for vehicles between 6.6 and 11.66 metres was seen in Immingham, which experienced a 21% rise in August 2021 compared with the previous month.
For vehicles over 11.66 metres in length, the largest month-on-month increase in sensor counts occurred in Hull, which also saw a 21% rise in August compared with the previous month. It is important to note that both sharp increases in August 2021 follow a decrease in July 2021 compared with June 2021, of 6% in Immingham and 5% in Hull, for vehicles between 6.6 and 11.66 metres and vehicles over 11.66 metres respectively.
Data for individual ports, average sensor counts and average speeds are available in the accompanying dataset.
Nôl i'r tabl cynnwys7. Road traffic in Great Britain
According to Department for Transport (DfT) non-seasonally adjusted road traffic data, the volume of all motor vehicle traffic on Monday 1 November 2021 was unchanged from the previous week at 96% of the level seen on the Monday of the first week in February 2020.
Compared with the previous week (Monday 25 October 2021), traffic volume for cars was unchanged at 92% of the level seen in the first week of February 2020. Light commercial vehicles and heavy goods vehicles traffic both saw slight increases when compared with the previous week, of 2 percentage points and 3 percentage points, respectively; these are both 110% of the level seen in the first week of February 2020.
Figure 6: The volume of motor vehicle traffic on Monday 1 November 2021 was at 96% of its level in the first week of February 2020
Daily road traffic index: 100 = same traffic as the equivalent day of the week in the first week of February 2020, 1 March 2020 to 1 November 2021, non-seasonally adjusted, Great Britain
Embed code
Download this chart
The daily DfT estimates are indexed to the first week of February 2020 and the comparison is with the same day of the week. The data provided are useful as an indication of traffic change rather than actual traffic volumes. More information on the methods, quality and economic analysis for these indicators can be found in the DfT methodology article.
Nôl i'r tabl cynnwys8. System average price (SAP) of gas
System average price (SAP) of gas data are available in the Data Item Explorer from the National Grid.
The system average price (SAP) is the average price of all gas traded through the balancing market. Market participants post bids or offers for volumes of gas as day-ahead and within-day trades. The SAP aggregates the trades conducted on the On-the-Day Commodity Market (OCM). This is the market that the National Grid uses in its role as residual balancer. Other markets exist for wholesale gas trading in Great Britain.
These data can be used to understand the general trend of gas prices within Great Britain. However, they should be treated with caution as these can be subject to extreme within-day trading prices and may skew actual traded prices. It must also be noted that while these prices reflect spot prices on the day, traders can opt for futures contracts where the buyer and the seller agree the market-determined price for gas for a future date. The daily SAP is used to determine the futures price and is therefore a useful indicator of supply constraints and demand pressures.
These data and the accompanying dataset are updated weekly in this bulletin.
Figure 7: The preceding seven-day rolling average gas price decreased by 11% in the week to 31 October 2021
System average price, pence per kilowatt hour, 1 January 2019 to 31 October 2021, non-seasonally adjusted, Great Britain
Source: National Grid
Notes:
- The price trends observed in the chart will differ from that of the monthly producer price inflation (PPI) series published by the Office for National Statistics because of the differences in data sources and methods.
- The seven-day rolling average has been distorted because of the latest large fall in SAP, actual-day values.
Download this chart Figure 7: The preceding seven-day rolling average gas price decreased by 11% in the week to 31 October 2021
Image .csv .xlsSince the start of 2021, the seven-day rolling average SAP has been steadily increasing. The price has more than tripled since the start of the year, with an increase of 349% since 1 January 2021, and an increase of 190% since 1 August 2021. In the latest week, the SAP preceding seven-day average decreased by 11% to 6.442 pence per kilowatt hour.
The full data time series of actual-day SAP and the preceding seven-day average, encompassing data from 2018 to the present, can be found in the accompanying dataset.
Nôl i'r tabl cynnwys9. Online job adverts
Job adverts by category
These figures are experimental estimates of online job adverts provided by Adzuna, an online job search engine, by category, by UK country and English region. The number of job adverts over time is an indicator of the demand for labour. The Adzuna categories used do not correspond to Standard Industrial Classification (SIC) categories, so these values are not directly comparable with the Office for National Statistics (ONS) Vacancy Survey.
Figure 8: The total volume of online job adverts on 29 October 2021 grew by 6% following the 6% fall in the previous week, to 142% of its February 2020 average level
Volume of online job adverts by category, index= February 2020 average, 4 January 2019 to 29 October 2021, non-seasonally adjusted, UK
Embed code
Notes:
Further category breakdowns are included in the online job advert estimates dataset and more details on the methodology can be found in Using Adzuna data to derive an indicator of weekly vacancies.
Users should note that week-on-week changes in online job advert volumes are outlined as percentages, rather than as percentage point changes. Percentage change figures quoted in the commentary will therefore not necessarily match the percentage point changes observed in the charts and accompanying dataset.
Download this chart
Of the 28 categories, 24 saw a weekly increase in the number of online job adverts, while 4 decreased when compared with the previous week. The largest weekly increase was in “graduate”, which rose by 18% following a 10% fall in the previous week and was the largest growth in this category since 5 September 2019 when it grew by 20%. The largest week-on-week decreases were in “wholesale and retail” and “travel and tourism”, which fell by 3% and 2%, respectively. Of the 28 categories, only “energy, oil and gas” and “legal” are below their February 2020 average level.
Job adverts by region
Figure 9: The volume of online job adverts increased across all UK countries and English regions on 29 October 2021 and remained above its February 2020 average level
Volume of online job adverts by UK countries and English regions, index: 100 = February 2020 average, 4 January 2019 to 29 October 2021, non-seasonally adjusted
Embed code
Download this chart
The volume of online job adverts grew for all 12 UK countries and English regions on 29 October 2021 and follows widespread decreases in the previous week. The largest week-on-week increase was in the East of England where it grew by 18% following a 15% fall in the previous week; this was the largest weekly increase in this region since 2 October 2020 when it also grew by 18%. The volume of online job adverts in all 12 UK countries and English regions is above its February 2020 average level.
Nôl i'r tabl cynnwys10. Transactions at Pret A Manger
Pret A Manger is a sandwich and coffee shop franchise chain, operating around 400 stores across the UK. Its transactional data are presented as an index and show total weekly till transactions at Pret A Manger shops as a proportion of the average weekly level in the first four weeks of 2020 (between Friday 3 January and Thursday 30 January 2020). Because of this comparison across the data time series, users should expect an element of seasonality in the data.
More information on the areas featured is available in the Measuring the data section. These data are also made available every Tuesday via Bloomberg.
Figure 10: Transactions at Pret A Manger stores in the week ending 28 October 2021 remained lowest in London city stores at 80% of the January 2020 average
Transactions in stores, index: 100 = January 2020 average, week ending 4 March 2021 to 28 October 2021, non-seasonally adjusted
Source: Pret A Manger
Notes:
- Dine in services in England were suspended during the third national lockdown remaining in place until Step 3 (17 May 2021) of England’s roadmap out of lockdown.
- Users should note not all store locations reopened as coronavirus restrictions were eased.
- The index begins on 4 March 2021 as most stores were closed prior to this therefore the corresponding indices were mostly zero.
Download this chart Figure 10: Transactions at Pret A Manger stores in the week ending 28 October 2021 remained lowest in London city stores at 80% of the January 2020 average
Image .csv .xlsIn the week ending 28 October 2021, transactions at Pret A Manger stores in Scotland increased by 2 percentage points compared with the previous week. In the same period, Yorkshire, Manchester, and London West End also saw increases of 11, 6 and 2 percentage points, respectively.
In the latest week, the level of transactions at Pret A Manger stores was highest in Yorkshire and London suburbs, at 159% and 128% of the weekly average level in January 2020, respectively.
Figure 11: Transactions at Pret A Manger stores in London airports decreased by 2 percentage points in the week to 28 October to 82% of the January 2020 average
Transactions in stores, index: 100 = January 2020 average, week ending 4 March 2021 to 28 October 2021, non-seasonally adjusted
Source: Pret A Manger
Download this chart Figure 11: Transactions at Pret A Manger stores in London airports decreased by 2 percentage points in the week to 28 October to 82% of the January 2020 average
Image .csv .xlsThe week ending 28 October 2021 saw the highest levels of transactions in both London stations and regional stations since the index began. However, transactions in all transport-related stores remain below the January 2020 average level.
Nôl i'r tabl cynnwys11. UK flight data
These data are daily flight figures from the European Organisation for the Safety of Air Navigation (EUROCONTROL). Daily flight numbers for the UK alongside other countries are available in EUROCONTROL's dashboard. EUROCONTROL is a pan-European, civil-military organisation dedicated to supporting European aviation. Its Aviation Intelligence and Performance Review Unit provides independent collection and validation of air navigation services performance-related data and intelligence gathering.
The flights data include international arrivals and departures to and from the UK (including crown dependencies) and domestic UK flights, but exclude overflights (flights that pass over UK territory). They capture all flight movements that operate under Instrument Flight Rules (IFR), where the pilot uses instruments in the flight deck to control, guide and adjust the plane. This includes commercial flights carrying passengers and cargo as well as non-commercial flights such as private and military flights.
Data from EUROCONTROL do not include information on the volume of passengers or cargo carried on UK flights. Especially in the context of the coronavirus (COVID-19) pandemic, flights might not be operating at full capacity and therefore trends in passengers and cargo will differ from trends in flights presented here.
Figure 12: The seven-day average number of UK daily flights was 3,666 in the week ending 31 October 2021, which is 60% of the level seen in the equivalent week of 2019
Number of daily flights, non-seasonally adjusted, and seven-day moving average, 2 January 2019 to 31 October 2021, UK
Source: European Organisation for the Safety of Air Navigation (EUROCONTROL)
Notes:
- The fall in February 2020 coincides with Storm Ciara.
- The falls in December and January coincide with Christmas Eve, Christmas Day, New Year’s Eve and New Year’s Day.
Download this chart Figure 12: The seven-day average number of UK daily flights was 3,666 in the week ending 31 October 2021, which is 60% of the level seen in the equivalent week of 2019
Image .csv .xlsThe average number of UK daily flights in the latest week was at 60% and 178% of the level seen in the equivalent week of 2019 and 2020, respectively. The seven-day average number of UK daily flights has been gradually rising since international travel was allowed to resume and the UK government implemented the travel traffic light system (17 May 2021). This is the highest percentage of the level seen in the equivalent week of 2019 since before the first UK lockdown in March 2020.
You can find the full data time series available for UK flights in the accompanying dataset, which contains daily flight numbers and the rolling seven-day averages.
Nôl i'r tabl cynnwys12. Shipping
A changeover in the systems used to collect these data has introduced a level shift in the data time series from 14 June 2021 onwards. Users should not make comparisons between data before and after this date. The data produced prior to the change, for 1 April 2019 to 13 June 2021, can still be compared within that period.
A full methodological review of our current method of data collection is under way and data may be subject to revision once this is complete. We will continue to update the accompanying dataset using the current method until the review is complete.
Figure 13: There was an average of 271 daily ship visits in the week to 31 October 2021, which was a 4% decrease from 283 in the previous week
Daily movements in shipping visits, seasonally adjusted, 1 April 2019 to 31 October 2021, UK
Source: exactEarth
Download this chart Figure 13: There was an average of 271 daily ship visits in the week to 31 October 2021, which was a 4% decrease from 283 in the previous week
Image .csv .xls
Figure 14: There was an average of 88 daily cargo ship visits in the week to 31 October 2021, broadly similar to the previous week at 89
Daily movements in cargo shipping visits, seasonally adjusted, 1 April 2019 to 31 October 2021, UK
Source: exactEarth
Notes:
- The vertical line indicates the date when the data collection system changed. Users should not compare data before and after this date.
- See the accompanying dataset for notable dates and weather events.
- In the coming weeks, we will continue to review the seasonally adjusted estimates of shipping indicators data following its reintroduction with the discontinuity.
Download this chart Figure 14: There was an average of 88 daily cargo ship visits in the week to 31 October 2021, broadly similar to the previous week at 89
Image .csv .xls14. OpenTable seated diners
Figure 15: The seven-day average estimate of UK seated diners increased by 6 percentage points in the week to 1 November 2021, at 129% of the level in the equivalent week of 2019
Seated diners, seven-day average, percentage compared with the equivalent week of 2019, week ending 24 February 2020 to week ending 1 November 2021, UK, London and Manchester
Source: OpenTable
Notes:
- Please note that data for Manchester are only available from week ending 16 November 2020.
Download this chart Figure 15: The seven-day average estimate of UK seated diners increased by 6 percentage points in the week to 1 November 2021, at 129% of the level in the equivalent week of 2019
Image .csv .xls15. Data
UK spending on credit and debit cards
Dataset | Released 4 November 2021
Experimental indicator for monitoring UK retail purchases derived from the Bank of England's CHAPS data.
Weekly shipping indicators
Dataset | Released 4 November 2021
Experimental weekly and daily ship visits dataset covering UK ports.
Traffic camera activity
Dataset | Released 4 November 2021
Experimental daily traffic camera counts data for busyness indices covering the UK.
Online job advert estimates
Dataset | Released 4 November 2021
Experimental job advert indices covering the UK online job market.
Company incorporations, voluntary dissolutions and compulsory dissolutions
Dataset | Released 4 November 2021
Weekly dataset showing the number of Companies House incorporations and voluntary dissolutions accepted, and companies placed into compulsory dissolution.
Daily UK flights
Dataset | Released 4 November 2021
Experimental daily UK flight numbers and rolling seven-day average, including flights to, from, and within the UK.
System Average Price (SAP) of gas
Dataset | Released 4 November 2021
Daily and rolling average System Average Price (SAP) of gas traded in the UK.
Vehicle flows around ports
Dataset | Released 4 November 2021
Monthly data showing vehicle flows around major ports in England. Contains average 15-minute sensor counts by size of vehicle, and average speeds.
Daily vehicle flows around ports
Dataset | Released 4 November 2021
Daily data showing vehicle flows around major ports in England. Contains average 15-minute sensor counts by size of vehicle, and average speeds
16. Glossary
Faster indicator
A faster indicator provides insights into economic activity using close-to-real-time big data, administrative data sources, rapid response surveys or Experimental Statistics, which represent useful economic and social concepts.
Company incorporations
Incorporations are when a company is added to the Companies House register of limited companies. This can also include where an existing business applies to become a limited company, where it was not one before.
Voluntary dissolution applications
A voluntary dissolution application is when a company applies to begin dissolution proceedings. As such, they effectively choose to be removed from the Companies House register. For a company to be eligible to voluntarily dissolve, it should not have completed any trading activity for a period of three months.
Compulsory dissolutions
When a company fails to file the required financial accounts and/or confirmation statements, if no contact is received by Companies House following a series of letters to the company and its officers, a first gazette notice is published in the Gazette, a notice of the Registrar's intention to dissolve the company.
Nôl i'r tabl cynnwys17. Measuring the data
UK coronavirus restrictions
A full overview of coronavirus (COVID-19) restrictions for each of the four UK constituent countries can be found here:
These restrictions should be considered when interpreting the data featured throughout this bulletin.
Pret A Manger index
The index shows total weekly till transactions at Pret A Manger stores as a proportion of the company's average weekly level in the first four weeks of 2020 (between 3 January 2020 and 30 January 2020).
These data are delivered weekly from Friday to Thursday in a week-ending format.
The index is broken down by region:
Yorkshire
London: Suburban (stores within Greater London but outside Zones 1 and 2)
London: City (notable office areas)
London: West End (notable retail areas)
London: Airports (four major airports in London)
London: Stations (three large train stations in London)
Manchester
Scotland
Regional Towns (stores in towns not included in this index)
Regional Stations (stores in stations in towns not included in this index)
These regions have been selected as in some areas of the UK -- there are limited numbers of Pret A Manger stores. For example, at the time of index creation, there were two stores open in Leeds and two in York, leading to these being grouped together as "Yorkshire".
Wales is omitted from the index as it has a low number of stores. Regional towns includes shops in towns other than those listed.
Nôl i'r tabl cynnwys18. Strengths and limitations
Information on the strengths and limitations of the indicators in this bulletin is available in the Coronavirus and the latest indicators of the UK economy and society methodology.
Nôl i'r tabl cynnwys
13. Social impact of coronavirus
This section includes some provisional results from the Opinions and Lifestyle Survey (OPN) covering the period 20 to 31 October 2021. The survey went out to 5,999 adults in Great Britain and had a response rate of 73% (4,397 responses). Further information to help understand the impact of the coronavirus (COVID-19) pandemic on people, households and communities in Great Britain will be available in Coronavirus and the social impacts on Great Britain, due to be published on 5 November 2021.
Travelling to work
In the period 20 to 31 October 2021, the proportion of working adults in Great Britain who in the past seven days:
travelled to work (both exclusively and in combination with working from home) remained unchanged from the previous period (6 to 17 October 2021) at 70%
worked exclusively from home remained unchanged from the previous period at 15%
neither travelled to work nor worked from home remained unchanged from the previous period at 15%
Shopping
Of the 96% of adults in Great Britain who reported leaving home in the past seven days, the proportion that did so to shop for food and medicine increased by 4 percentage points from the previous period to 85%.
The proportion of these adults who shopped for things other than food and medicine in the past seven days increased by 4 percentage points from the previous period to 46%.
Face coverings
Of the 96% of adults in Great Britain who reported leaving home in the past seven days, the proportion that did so and reported wearing a face covering was broadly similar to the previous period at 83%.
Further breakdowns, such as the situation when a face covering was worn (for example, while shopping), and by country, will be available in Coronavirus and the social impacts on Great Britain, due to be published on 5 November 2021.
Nôl i'r tabl cynnwys