Cynnwys
- Main points
- Latest indicators at a glance
- OpenTable seated diners
- Retail footfall
- Transactions at Pret A Manger
- UK spending on debit and credit cards
- Shelf availability of items from UK shops
- Traffic camera activity
- Road traffic in Great Britain
- Business impacts and insights
- Data
- Glossary
- Measuring the data
- Strengths and limitations
- Related links
1. Main points
The seven-day average estimate of UK seated diners fell by 14 percentage points in the week to 20 December 2021, to 88% of the level in the equivalent week of 2019; this is the lowest this figure has been since the week ending 17 May 2021 (OpenTable). Section 3.
In the week to 18 December 2021, overall retail footfall in the UK remains at 81% of the level seen in the equivalent week of 2019; this is slightly lower than the previous week where overall retail footfall was at 82% of the equivalent week of 2019 (Springboard). Section 4.
Transactions compared with January 2020 at Pret A Manger stores in the week ending 16 December 2021 fell in six of the seven urban locations; in London City stores transactions decreased 29 percentage points to the lowest level since the week ending 2 September 2021 (Pret A Manger). Section 5.
At the beginning of December 2021, the aggregate CHAPS-based indicator of credit and debit card purchases was 23 percentage points higher than the equivalent week in 2020; levels have since converged and in the week to 16 December 2021 were 4 percentage points higher than the equivalent week in 2020 (Bank of England CHAPS data). Section 6.
Shelf availability of items between 17 and 20 December 2021 was lowest for "paracetamol" and "frozen turkey" with 25% and 24%, respectively, of these items marked as "none" or "low"; shelf availability was highest for the "beer" category with 73% of this item recorded as "high" (Kantar Public). Section 7.
In the week to 19 December 2021, the seasonally adjusted counts of traffic camera activity for "cars", "buses" and "pedestrians and cyclists" in London were 120%, 112% and 149% of the levels of the equivalent days of 2020, respectively (Transport for London). Section 8.
In the run up to Christmas 2021, the weekday volume of all motor vehicle traffic ranged from 92% to 97% of the level seen on the equivalent day of the first week in February 2020; in the equivalent period of 2020, when national and local restrictions were in place, this ranged from 76% to 89% (Department for Transport). Section 9.
The total volume of online job adverts on 17 December 2021 was at 131% of its February 2020 average level; the highest level of job adverts relative to February 2020 continued to be in the "transport, logistics and warehouse" category, at 294% (Adzuna). See the accompanying dataset.
In Wave 46, 14% of businesses not permanently stopped trading reported their workforce were working from home in the last two weeks, this is up 2 percentage points from Wave 44 (initial results from Wave 46 of Business Insights and Conditions Survey (BICS)). Section 10.
The system average price (SAP) of gas increased by 25% in the week to 19 December 2021, its sixth consecutive week-on-week increase and the largest since 10 October 2021 when it increased by 33% (National Grid). See the accompanying dataset.
There was an average of 290 daily ship visits in the week to 19 December 2021, a 5% increase from the previous week, while the average number of daily cargo and tanker ship visits increased by 2% to 91 in the same period (exactEarth). See the accompanying dataset.
The seven-day average number of UK daily flights was 3,703 in the week ending 19 December 2021; this is 71% of the level seen in the equivalent week of 2019, and 243% of the equivalent week of 2020 (EUROCONTROL). See the accompanying dataset.
There were 12,809 company incorporations in the week to 17 December 2021, 11% higher than the equivalent week of 2019 (11,503) but 7% down from the previous week (13,757) (Companies House). See the accompanying dataset.
2. Latest indicators at a glance
Embed code
Notes:
- Users should note that the break in the available shipping data (from 14 to 19 June 2021) is when the data collection system changed.
3. OpenTable seated diners
OpenTable is a provider of data for online restaurant reservations, with daily data for the UK, London and Manchester being publicly available in its The state of the industry dashboard. These data show the impact of recent events and restrictions on the hospitality industry using a sample of restaurants on the OpenTable network across all channels, that is, online reservations, phone reservations, and walk-ins.
Figure 1: The seven-day average estimate of UK seated diners decreased by 14 percentage points in the week to 20 December 2021, to 88% of the level in the equivalent week of 2019
Seated diners, seven-day average, percentage compared with the equivalent week of 2019, week ending 24 February 2020 to week ending 20 December 2021, UK, London and Manchester
Source: OpenTable
Notes:
- Please note that data for Manchester are only available from week ending 16 November 2020.
Download this chart Figure 1: The seven-day average estimate of UK seated diners decreased by 14 percentage points in the week to 20 December 2021, to 88% of the level in the equivalent week of 2019
Image .csv .xlsAccording to OpenTable, in the week to 20 December 2021, the seven-day average estimate of UK seated diners fell 14 percentage points to 88% of the level in the equivalent week in 2019. This is the largest week-on-week fall since 6 September 2021. It is also the lowest level since indoor dining reopened in England, Wales and Scotland (17 May 2021), and the first time the level has fallen below 100% since then.
In the latest week, the seven-day average estimate of seated diners in London fell by 18 percentage points to 57% of the level seen in the equivalent week of 2019. This is the lowest since 17 May 2021 when it was 43%. For Manchester, despite the seven-day average estimate of seated diners falling by 8 percentage points, which was the sixth consecutive weekly decline, the level remains above that of equivalent week in 2019, at 104%.
Figure 2: The level of the daily estimate of UK seated diners in the run up to Christmas in 2021 remains above the level during the equivalent period in 2020
Daily seated diners, percentage compared with the equivalent day of 2019, 16 November to 21 December 2020 and 15 November to 20 December 2021, UK
Embed code
Notes:
- Data show the percentage of seated diners when compared with the same day in 2019. For example, Monday 21 December 2020 is compared with Monday 20 December 2021.
Download this chart
Figure 2 compares the 2019 levels of UK daily seated diners to 2020 and 2021 in the run up to the Christmas period. The level of seated diners saw a strong recovery from the start of December 2020 as national restrictions were eased, while over the equivalent period in 2021 the level has remained above that of 2020.
Despite this, the level of daily seated diners has continued to decline over recent weeks, with four days in the week to 20 December 2021 dipping below 80% of the level in the equivalent week of 2019 – the first time this has occurred since Sunday 16 May 2021, at 61%.
Nôl i'r tabl cynnwys4. Retail footfall
National retail footfall
National retail footfall figures are supplied by Springboard, a provider of data on customer activity. They measure the following for overall UK retail footfall, as well as by high street, retail park, and shopping centre categories:
- daily retail footfall as a percentage of its level on the same day of the equivalent week of 2019; for example, Saturday 18 December 2021 is compared with Saturday 14 December 2019
- total weekly retail footfall as a percentage of its level in the equivalent week of 2019
- the percentage change in weekly footfall compared with the previous week for example, Week 50 of 2021 is compared with Week 49 of 2021
Springboard's weekly data are defined over a seven-day period running from Sunday to Saturday. Week 50 of 2021 therefore refers to the period Sunday 12 December 2021 to Saturday 18 December 2021.
Users should note that all quoted figures have been rounded to the nearest integer.
Figure 3: In the week to 18 December overall retail footfall was below “normal” expectations for this time of year at 81% of the level seen in the equivalent week of 2019
Volume of overall daily retail footfall, percentage compared with the equivalent day of the equivalent week of 2019, 1 March 2020 to 18 December 2021, UK

Source: Springboard, The Department for Business, Energy and Industrial Strategy
Notes:
- The vertical lines indicate notable events and coronavirus (COVID-19) restriction changes.
- Users should note that week-on-week changes in retail footfall volumes are outlined as percentages, rather than as percentage point changes. Percentage change figures quoted in the commentary will therefore not necessarily match the percentage point changes observed in the chart.
Download this image Figure 3: In the week to 18 December overall retail footfall was below “normal” expectations for this time of year at 81% of the level seen in the equivalent week of 2019
.PNG (112.1 kB)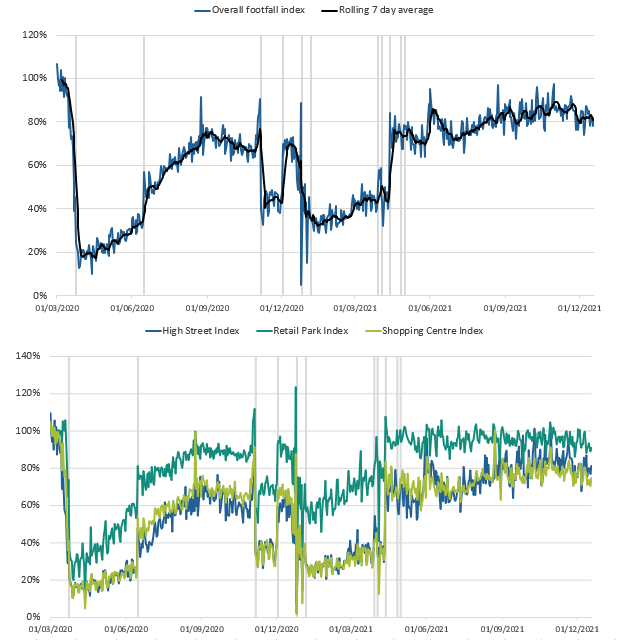
Although the UK saw a 6 percentage point rise in overall retail footfall in the latest week, the volume of overall daily retail footfall is still below “normal” expectations for this time of year, at 81% of the level seen in the equivalent week of 2019. This is the lowest level compared with the equivalent week of 2019 since Week 39 (week beginning 26 September 2021) where the level was also 81%.
Shopping centre retail footfall was at 73% of the level seen in the equivalent week of 2019. This is the lowest relative level since the week beginning 25 July 2021. The latest week follows a previous high of 84% of the level of the equivalent week of 2019, which occurred in the week beginning 24 October 2021. These lower levels of retail footfall may be because of more cautious behaviour caused by the emergence of the Omicron variant of COVID-19.
Regional retail footfall
Figure 4: In the week to 18 December 2021 the South West had the highest retail footfall relative to pre-coronavirus (COVID-19) pandemic levels, at 89%
Volume of daily retail footfall, percentage of the level recorded on the same day of the equivalent week of 2019, seven-day rolling average, UK countries and English regions, 1 March 2020 to 18 December 2021

Source: Springboard, The Department for Business, Energy and Industrial Strategy
Download this image Figure 4: In the week to 18 December 2021 the South West had the highest retail footfall relative to pre-coronavirus (COVID-19) pandemic levels, at 89%
.PNG (83.3 kB)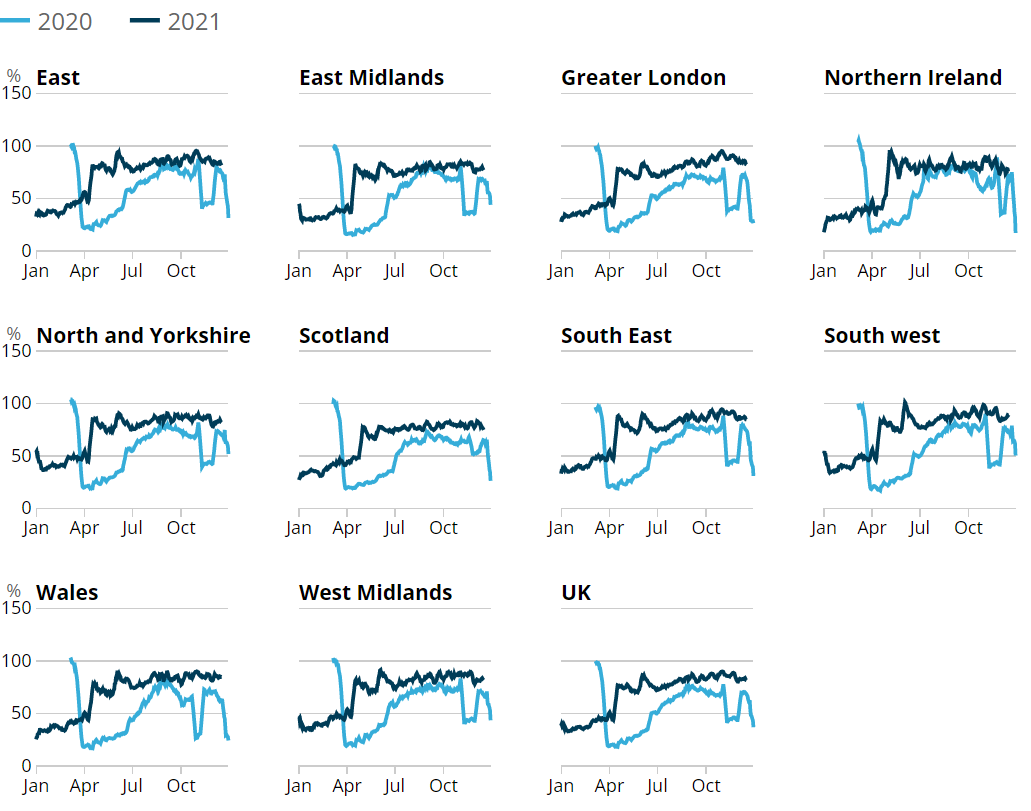
5. Transactions at Pret A Manger
Pret A Manger is a sandwich and coffee shop franchise chain, operating around 400 stores across the UK. Its transactional data are presented as an index and show total weekly till transactions at Pret A Manger shops as a proportion of the average weekly level in the first four weeks of 2020 (between Friday 3 January and Thursday 30 January 2020). Because of this comparison across the data time series, users should expect an element of seasonality in the data.
More information on the areas featured is available in the methodology page. These data are also made available every Tuesday via Bloomberg.
Figure 5: Transactions at Pret A Manger stores fell in six of the seven urban locations and were lowest when compared with January 2020 in London city stores where it fell 29 percentage points, to 52%
Transactions in stores, index: 100 = January 2020 average, week ending 4 March 2021 to 16 December 2021, non-seasonally adjusted
Source: Pret A Manger
Notes:
- Dine-in services in England were suspended during the third national lockdown, which remained in place until Step 3 (17 May 2021) of England’s roadmap out of lockdown.
- Users should note not all store locations reopened as coronavirus (COVID-19) restrictions were eased.
- The index begins on 4 March 2021 as most stores were closed before this therefore the corresponding indices were mostly zero.
Download this chart Figure 5: Transactions at Pret A Manger stores fell in six of the seven urban locations and were lowest when compared with January 2020 in London city stores where it fell 29 percentage points, to 52%
Image .csv .xlsIn the week ending 16 December 2021, transactions at urban Pret A Manger stores decreased in all regions apart from in Regional Towns. The largest fall was in London City stores, which was at the lowest level since the week ending 2 September 2021.
Yorkshire, London Suburban and Regional Town stores were the only locations where transactions remain above their January 2020 average levels at 148%, 128% and 123%, respectively.
Nôl i'r tabl cynnwys6. UK spending on debit and credit cards
Daily CHAPS-based indicator
These data series are experimental faster indicators for estimating UK spending on credit and debit cards. They track the daily CHAPS payments made by credit and debit card payment processors to around 100 major UK retail corporates. These payments are the proceeds of recent credit and debit card transactions made by customers at their stores, both through physical and online platforms. More information on the indicator is provided in the accompanying methodology article.
Companies are allocated to one of four categories based on their primary business:
"staples" refers to companies that sell essential goods that households need to purchase, such as food and utilities
"work-related" refers to companies providing public transport or selling petrol
"delayable" refers to companies selling goods whose purchase could be delayed, such as clothing or furnishings
"social" refers to spending on travel and eating out
Figure 6: In the lead up to Christmas 2021, the aggregate CHAPS-based indicator of credit and debit card purchases has been consistently higher than the equivalent period of 2020, but has slowed and converged to 2020 levels since early December
Index February 2020 = 100, a backward looking seven-day rolling average, 16 November to 17 December 2020, and 15 November to 16 December 2021, non-seasonally adjusted, nominal prices
Embed code
Notes:
Users should note the daily payment data are the sum of card transactions processed up to the previous working day, so there is a slight time lag when compared with real-life events on the chart.
Data show the CHAPS payments made by credit and debit card payment on the equivalent weeks in 2020 and 2021. For example, the week to Thursday 17 December 2020 is compared with the week to Thursday 16 December 2021.
Users should note that the composition of the sample of UK corporates has changed over the intervening 12 months and therefore the results are not fully comparable.
Download this chart
Figure 6 shows changes in the value of CHAPS payments received by large UK corporates from their credit and debit card processors, "merchant acquirers", since February 2020.
In the lead up to Christmas 2021, the aggregate CHAPS-based indicator of credit and debit card purchases has been consistently higher than the equivalent week in 2020. However, levels began to converge as aggregate levels stabilised from December 2021.
In the week to 16 December 2021, the aggregate CHAPS-based indicator of credit and debit card purchases was 4 percentage points higher than the equivalent week in 2020 – this has reduced from 23 percentage points on 1 December 2021. The convergence could be explained by the December 2020 recovery in aggregate spending following the November lockdown, whereas December 2021 spending has remained relatively stable.
Throughout the second half of November 2021, “delayable” spending was consistently higher than the same month in 2020, as a result of the lockdown last year. However, spending in this category fell below its 2020 level in the week to 6 December 2021, and in the latest week was 20 percentage points below the equivalent week in 2020, at 129% of its February 2020 average level.
Since mid-November 2021, “work-related” and “social” spending have been notably higher than in 2020. In the latest week, “work-related” and “social” spending were 35 and 29 percentage points higher than the equivalent week in 2020, respectively. In the latest week both “work-related” and “social” fell 4 percentage points to 117% and 90% of their February 2020 average levels, respectively.
“Staple” spending in the lead up to Christmas has closely mirrored the pattern of 2020. In the latest week “staple” spending broadly matched the equivalent week in 2020, at 124% of its February 2020 average level.
Nôl i'r tabl cynnwys7. Shelf availability of items from UK shops
Shelf availability research for shops across the UK has been undertaken by Kantar Public. Collectors gathered information on a range of items from up to three different shops across multiple locations, recording availability across four categories: "none", "low", "medium", or "high". It is important to note these categories are subjective as they are recorded by individual collectors. The data were collected between 17 and 20 December 2021. This series will be published on a fortnightly basis from the new year.
Figure 7: Shelf availability of items between 17 and 20 December 2021 was lowest for “paracetamol”, with 25% of this item’s availability marked as “none” or “low”, followed by “frozen turkey” with 24%
Item availability in shops across 127 locations covering UK countries and English regions, between 17 and 20 December 2021
Source: Kantar Public
Notes:
- Shelf availability does not imply stock availability in warehouses or storage units and is simply the level of available products in a selected sample of shops at the time of data collection.
- In this period, 272 shops were visited and 5,902 observations were made.
- Categories in this chart have been rounded for illustrative purposes and may not sum to category total or 100.
Download this chart Figure 7: Shelf availability of items between 17 and 20 December 2021 was lowest for “paracetamol”, with 25% of this item’s availability marked as “none” or “low”, followed by “frozen turkey” with 24%
Image .csv .xlsIn the current period (17 to 20 December 2021), the overall proportion of observations for all items recorded as "high" was 52%, broadly stable from the previous four-day period (10 to 13 December 2021, 53%). Observations for all items recorded as "none" or "low" was at 9%, unchanged from the previous period.
Across the four availability categories, the largest proportion of observations recorded as "high" was "beer" at 73%, followed by "potatoes" and "fresh vegetables", both at 64%. The items with the highest proportion of availability recorded as either "none" or "low" were "paracetamol" and "frozen turkey" at 25% and 24%, respectively, followed by "ibuprofen" (19%) and "chocolate selection boxes" (18%).
Data for all categories are available in the accompanying dataset.
Nôl i'r tabl cynnwys8. Traffic camera activity
Traffic cameras are a valuable source for understanding the level of activity in towns and cities as well as changing patterns of mobility.
Figure 8: In the latest week, the seasonally adjusted counts of traffic camera activity for cars, buses and pedestrians and cyclists in London were all above the equivalent days of 2020
Traffic camera activity count for cars, buses and pedestrians and cyclists, percentage compared with the equivalent day of 2020, London and North East, 15 November to 19 December 2021, seasonally adjusted
Embed code
Notes:
Data show the percentage of traffic camera counts compared with the equivalent day in 2020 and 2021. For example, Sunday 20 December 2020 is compared with Sunday 19 December 2021.
Users should note that because of faulty or missing camera images, there were high levels of imputation data in the North East for the period 16 to 19 December 2021.
Download this chart
In the latest week in London, the seasonally adjusted counts of traffic camera activity for:
Cars decreased by 2% to 110% of pre-coronavirus (COVID-19) lockdown levels
buses increased by 2% to 98% of pre-coronavirus lockdown levels
pedestrians and cyclists increased by 17% to 123% of pre-coronavirus lockdown levels
Over the period 15 November to 19 December 2021, car and bus traffic camera counts in London generally remained above 100% of the level on the equivalent day of 2020.
Further information on the methodology used to produce these data is available in our methodology article and Data Science Campus blog. Data for all available regions can be found in the accompanying dataset.
Nôl i'r tabl cynnwys9. Road traffic in Great Britain
These data are non-seasonally adjusted traffic volumes from the Department for Transport (DfT).
Figure 9: In the run up to Christmas 2021, the volume of all motor vehicle traffic was consistently higher than the equivalent period of 2020, when national and local restrictions were in place
Daily road traffic index: 100 = same traffic as the equivalent day of the week in the first week of February 2020, 16 November 2020 to 21 December 2020, and 15 November 2021 to 20 December 2021, non-seasonally adjusted, Great Britain
Embed code
Notes:
- Data show DfT non-seasonally adjusted road traffic data on the equivalent days in 2020 and 2021. For example, Monday 21 December 2020 is compared with Monday 20 December 2021.
Download this chart
Between Monday 15 November and Monday 20 December 2021, the weekday volume of all motor vehicle traffic ranged from 92% to 97% of the level seen on the Monday of the first week in February 2020. In the equivalent period of 2020, when national and local restrictions were in place, this ranged from 76% to 89%.
Between Monday 15 November and Monday 20 December 2021, the weekday traffic volume of:
cars ranged from 87% to 93% of the level seen on the Monday of the first week in February 2020 (in the equivalent period of 2020, this ranged from 70% to 83%)
light commercial vehicles ranged from 104% to 112% of the level seen on the Monday of the first week in February 2020 (in the equivalent period of 2020, this ranged from 88% to 102%)
heavy goods vehicles ranged from 104% to 112% of the level seen on the Monday of the first week in February 2020 (in the equivalent period of 2020, this ranged from 100% to 111%)
10. Business impacts and insights
Initial results from Wave 46 of the Business Insights and Conditions Survey (BICS) cover the reference period 29 November to 12 December 2021, with a response rate of 20.4% (7,947 responses). The survey was live for the period 13 December to 21 December 2021.
Figure 10: In Wave 46, 14% of businesses not permanently stopped trading reported their workforce were working from home in the last two weeks, this is up from 12% in Wave 44
Working arrangements, businesses not permanently stopped trading, weighted by employment, UK, 15 November to 7 December 2021 and 29 November to 12 December 2021
Source: Office for National Statistics – Business Insights and Conditions Survey (BICS)
Notes:
- Initial weighted results, Wave 46 of the Office for National Statistics' (ONS') Business Insights and Conditions Survey (BICS).
- Bars may not sum to 100% because of rounding and percentages less than 1% being removed for disclosure purposes.
- "Other" includes all other arrangements not defined in the question.
- Businesses were asked for their experiences for the reference period 29 November to 12 December 2021. However, for questions regarding the last two weeks, businesses may respond from the point of completion of the questionnaire (13 December to 21 December 2021).
Download this chart Figure 10: In Wave 46, 14% of businesses not permanently stopped trading reported their workforce were working from home in the last two weeks, this is up from 12% in Wave 44
Image .csv .xls11. Data
Traffic camera activity
Dataset | Released 23 December 2021
Experimental daily traffic camera counts data for busyness indices covering the UK.
System Average Price (SAP) of gas
Dataset | Released 23 December 2021
Daily and rolling average system average price (SAP) of gas traded in the UK.
Shelf availability of items from UK shops
Dataset | Released 23 December 2021
Data provided by Kantar Public, recording item availability of 23 popular products across the UK and English regions.
UK spending on credit and debit cards
Dataset | Released 23 December 2021
Experimental indicator for monitoring UK retail purchases derived from the Bank of England's CHAPS data.
Online job advert estimates
Dataset | Released 23 December 2021
Experimental job advert indices covering the UK online job market.
Users should note that this section lists a selection of the data available with this publication. For the full list of available datasets please see the accompanying dataset page.
Nôl i'r tabl cynnwys12. Glossary
Faster indicator
A faster indicator provides insights into economic activity using close-to-real-time big data, administrative data sources, rapid response surveys or Experimental Statistics, which represent useful economic and social concepts.
Company incorporations
Incorporations are when a company is added to the Companies House register of limited companies. This can also include where an existing business applies to become a limited company, where it was not one before.
Voluntary dissolution applications
A voluntary dissolution application is when a company applies to begin dissolution proceedings. As such, they effectively choose to be removed from the Companies House register. For a company to be eligible to voluntarily dissolve, it should not have completed any trading activity for a period of three months.
Compulsory dissolutions
When a company fails to file the required financial accounts and/or confirmation statements, if no contact is received by Companies House following a series of letters to the company and its officers, a first gazette notice is published in the Gazette, a notice of the Registrar's intention to dissolve the company.
Nôl i'r tabl cynnwys13. Measuring the data
UK coronavirus restrictions
A full overview of coronavirus (COVID-19) restrictions for each of the four UK constituent countries can be found here:
These restrictions should be considered when interpreting the data featured throughout this bulletin
Nôl i'r tabl cynnwys14. Strengths and limitations
Information on the strengths and limitations of the indicators in this bulletin is Message available in the Economic activity and social change in the UK, real-time indicators methodology..
Nôl i'r tabl cynnwys