Cynnwys
- Main findings
- Your views matter
- Overview
- Summary
- Section A: Total international trade in services (excluding travel, transport and banking) by continent and countries
- Section B: Trade in services products: geographical analysis
- Section C: Trade in Services by Products: Industry Analysis
- Background notes
- Methodoleg
1. Main findings
- Total UK exports of services (excluding travel, transport and banking) in current prices continued to rise, increasing from £103,828 million in 2012 to £117,193 million in 2013, an increase of 12.9%.
- Total UK exports of services to Europe witnessed the largest increase in 2013 rising from £51,963 million in 2012 to £57,150 million, an increase of 10.0%. Exports to Germany contributed most towards the increase.
- The professional, scientific and technical activities sector continued to be the largest sector contributing 27.4% of total UK exports in 2013.
- Total UK imports of services (excluding travel, transport and banking) in current prices increased by 15.1% rising from £46,399 million in 2012 to £53,387 million in 2013.
- Imports of services to the UK from the Irish Republic showed the largest growth within Europe rising from £2,597 million in 2012 to £4,084 million in 2013.
- The information and communication services sector made the largest contribution to UK imports of services in 2013, contributing 25.5% of total UK imports.
2. Your views matter
The structure of this release has been modified in response to some feedback received from its users. We are constantly aiming to improve this release and its associated commentary. We would welcome any feedback you might have and would be particularly interested in knowing how you make use of these data to inform our work. Please contact us via email: itis@ons.gov.uk or telephone Michael Hardie on +44 (0)1633 455923
Nôl i'r tabl cynnwys3. Overview
A detailed breakdown of annual trade in services estimates, analysing data by product, industry and country are provided in the 2013 International Trade in Services (ITIS) publication. These data are sourced from the Office for National Statistics International Trade in Services survey.
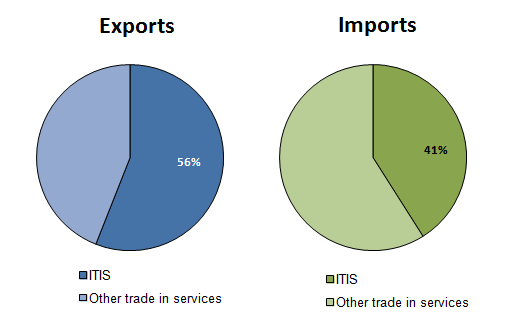
The ITIS survey is a key source of UK trade data although it is important to note the survey does not cover the whole of the UK economy. Data for the travel, transport and banking sectors of the economy are not covered by the ITIS survey as these data are obtained from other sources such as the International Passenger Survey and the Bank of England. Estimates for the overall level of trade in services, including these industries, are published in the Office for National Statistics annual Pink Book and monthly UK trade publications. Based on the 2013 estimates the ITIS data contributed approximately 56% and 41% respectively to the total trade in services export and import estimates for the whole of the UK.
Figure 0: % contribution of ITIS to total Trade in Services, 2013
Source: Office for National Statistics
Download this image Figure 0: % contribution of ITIS to total Trade in Services, 2013
.png (17.4 kB)The 2013 estimates contained within this publication are the first set of ITIS results that have been collected and published according to the agreed international standards set out in the sixth edition of the International Monetary Fund (IMF) Balance of Payments Manual (BPM6). Implementing the recommendations from the revised BPM6 manual resulted in the ITIS questionnaire being thoroughly reviewed and updated. Changes to the survey included:
- six deleted questions - for example, 'Reinsurance claims and premiums' were removed from the questionnaire
- three split questions - for example, 'Other on-site processing services' became 'Manufacturing services on goods owned by others' and 'Maintenance and repair services'
- 10 new questions - for example, 'Manufacturing services on goods owned by others'. This question aims to collect data on fees charged by foreign businesses for the processing, assembly, labelling, and packing of goods overseas that are owned by a respondents business
- three merged questions - for example, 'Advertising' and 'Market research and public opinion polling’ merged to become 'Advertising, market research and public opinion polling services'
- rebranding of the ‘Royalties and licences’ section – This section was re-named ‘Intellectual Property’ and the questions within this section have all been revised and contain two new additional questions
- questionnaire layout - for example, renumbering of question codes and changes to sections for example, the 'Communications' section has been merged with 'Computer and Information Services' and 'Information services' to create one complete section titled 'Telecommunications, Computer and Information Services'
- updated wording and guidance – descriptions surrounding what data should be reported against specific questions have been enhanced to clarify to users what information should be reported
As a result of updated wording and guidance data variations at service product level may partly be explained by this. Users should be mindful of this when analysing product level estimates over time.
A copy of the ITIS questionnaire is available on the Introduction to ITIS page on the ONS website.
Nôl i'r tabl cynnwys4. Summary
Total exports of services (excluding travel, transport and banking) from the UK in current prices, increased from £103,828 million in 2012 to £117,193 million in 2013, an increase of 12.9%.
Prior to this, UK exports increased by 9.2% on an annual basis (2001-2012), reaching a peak of £117,193 million in 2013.
Total imports of services (excluding travel, transport and banking) to the UK, in current prices increased from £46,399 million in 2012 to £53,387 million in 2013, an increase of 15.1%.
The ITIS estimates show the UK continued to be a net exporter of services in 2013, meaning more services were exported from the UK than imported. The UK trade balance for services stood at £63,806 million in 2013, an increase of 11.1% when compared to 2012.
Figure 1: Total international trade in services (excluding travel, transport and banking)
Source: Office for National Statistics
Download this chart Figure 1: Total international trade in services (excluding travel, transport and banking)
Image .csv .xls5. Section A: Total international trade in services (excluding travel, transport and banking) by continent and countries
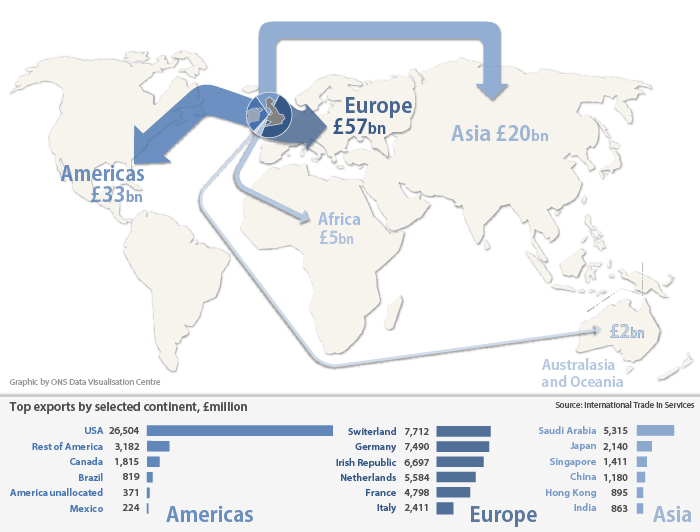
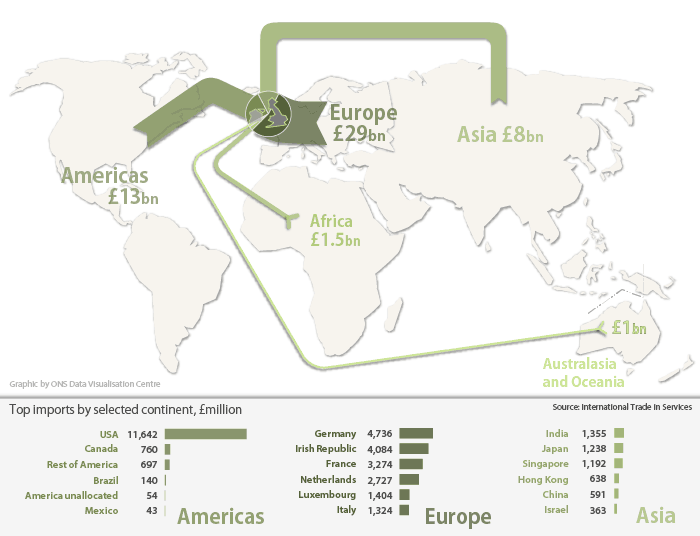
This section shows key geographical findings for total UK international trade in services (excluding travel, transport and banking). The size of the arrows in figures 2 and 3 are proportionate to the size of the continental export and import markets for the UK.
For more detailed geographic information relating to total export and imports of services please refer to table A0 – Total trade in Services (excluding travel, transport and banking) analysed by continents and countries.
Exports of services
Figure 2: UK international trade in services (excluding travel, transport and banking) exports by continent, 2013
Source: Office for National Statistics
Download this image Figure 2: UK international trade in services (excluding travel, transport and banking) exports by continent, 2013
.png (101.5 kB) .xls (18.9 kB)UK exports of services to Europe increased from £51,963 million in 2012 to £57,150 million in 2013 and remained the largest area in receipt of UK exports. Switzerland surpassed the Irish Republic to become the main trading partner of the UK within Europe, with UK exports to Switzerland increasing from £6,248 million in 2012 to £7,712 million in 2013. UK exports of services to Germany also increased in 2013 rising from £6,018 million in 2012 to £7,490 million in 2013, an increase of 24.5%. This increase has resulted in Germany becoming the second largest country within Europe in receipt of UK service exports.
The Americas, mainly supported by the USA, remained the UK’s second largest area in receipt of UK exports. Exports to the USA increased in 2013 rising from £22,759 million in 2012 to £26,504 million in 2013, an increase of 16.5%.
Asia remained the third largest destination for UK exports of services with exports increasing from £16,284 million in 2012 to £19,660 million in 2013, an increase of 20.7% Saudi Arabia made the largest contribution to the overall exports total for Asia contributing 27.0%.
An interactive map can be found on the ONS website detailing the UK’s European import and exports of services.
Imports of services
Figure 3: UK international trade in services (excluding travel, transport and banking) imports by continent, 2013
Source: Office for National Statistics
Download this image Figure 3: UK international trade in services (excluding travel, transport and banking) imports by continent, 2013
.png (92.6 kB) .xls (18.9 kB)UK imports of services from Europe rose from £24,192 million in 2012 to £29,359 million in 2013 and remained the main import area. Within Europe, Germany remained the main origin for UK imports of services, increasing from £4,102 million in 2012 to £4,736 million in 2013. The Irish Republic was the second largest trading partner of the UK for imports of services increasing from £2,597 million in 2012 to £4,084 million in 2013. UK imports from the Irish Republic more than doubled between 2009 and 2013, with the most notable increase seen in the 2013.
The Americas remained the second largest area that the UK imported services from followed by Asia. There were no compositional changes of countries within these continents from which the UK imported services from.
An interactive map can be found on the ONS website detailing the UK’s European import and exports of services.
Nôl i'r tabl cynnwys6. Section B: Trade in services products: geographical analysis
In this section UK trade in services exports and imports are broken down by product groups. Each group is analysed by continent, making comparisons between 2012 and 2013.
As a result of changes to international regulations the ITIS questionnaire used to collect trade in services data for 2013 was revised. This has improved coverage of ITIS data collection and should be considered when comparing product groupings over time.
The percentage contributions to total UK exports and imports of services of each of the product groupings contained within this section are:
Table 1: Percentage contributions of product groups to total ITIS, 2013
| Exports | Imports | |
| Technical, trade related, operational leasing & other business services | 14.70% | 10.60% |
| Professional, management consulting and R&D services | 24.80% | 29.20% |
| Merchanting, other-trade related and services between related enterprises | 14.30% | 17.80% |
| Source: Office for National Statistics |
Download this table Table 1: Percentage contributions of product groups to total ITIS, 2013
.xls (28.2 kB)Technical, trade related, operational leasing and other business services group
The table below shows the service products used to compile the technical, trade related, operational leasing and other business services group across both 2012 and 2013.
Table 2: Service products used to compile the technical, trade related, operational leasing and other business services group across both 2012 and 2013
| 2012 | 2013 |
| Agricultural services | Agricultural, forestry and fishing |
| Mining services | Mining and oil and gas extraction services |
| Waste treatment and depollution | Waste treatment and depollution |
| Other on site processing | Manufacturing services on goods owned by others |
| Maintenance and repair services | |
| Construction in the UK | Construction in the UK |
| Construction outside the UK | Construction outside the UK |
| Architectural services | Architectural services |
| Engineering services | Engineering services |
| Surveying services | Scientific and other technical services inc surveying |
| Operational leasing services | Operational leasing services |
| Source: Office for National Statistics | |
Download this table Table 2: Service products used to compile the technical, trade related, operational leasing and other business services group across both 2012 and 2013
.xls (27.1 kB)Exports
UK exports of technical, trade-related, operational leasing and other business services increased by £6,392 million in 2013 to £17,277 million.
Figure 4: Exports (excluding travel, transport and banking) of technical, trade related, operational leasing and other business services, by continent, 2009 to 2013
Source: Office for National Statistics
Download this chart Figure 4: Exports (excluding travel, transport and banking) of technical, trade related, operational leasing and other business services, by continent, 2009 to 2013
Image .csv .xlsUK exports to Europe almost doubled in 2013 rising from £3,397 million in 2012 to £6,277 million in 2013. Prior to this, exports of services to Europe had been on a broad downward trend before a slight recovery in 2012. Within Europe, UK exports to the Netherlands showed the largest increase from £303 million in 2012 to £997 million in 2013, an increase of £694 million. This was followed by UK exports to both Germany and Norway which increased by £572 million and £377 million respectively.
UK exports to Asia have been on an upward trend since 2009 with the exception of 2011 which showed flat growth. UK exports to Asia increased from £3,140 million in 2012 to £4,566 million in 2013. Within Asia, UK exports to Saudi Arabia showed the largest growth rising from £699 million in 2012 to £1,315 million in 2013. This follows strong growth in recent years, with the 2012 estimate more than doubling in comparison to 2011.
UK exports to the Americas also experienced growth in 2013 rising from £2,573 million in 2012 to £4,237 million in 2013. Within the Americas, UK exports to the USA showed the largest increase rising to £2,773 million and accounted for over half the total export value to the Americas in 2013.
Imports
Imports to the UK of technical, trade-related, operational leasing and other business services has grown at a much more subdued rate since 2011 with imports to the UK rising to £5,675 million in 2013, an increase of £1,349 million.
Figure 5: Imports (excluding travel, transport and banking) of technical, trade related, operational leasing and other business services by continent, 2009 to 2013
Source: Office for National Statistics
Download this chart Figure 5: Imports (excluding travel, transport and banking) of technical, trade related, operational leasing and other business services by continent, 2009 to 2013
Image .csv .xlsImports to the UK from Europe increased from £2,194 million in 2012 to £2,961 million in 2013. Germany made the largest contribution to the overall UK imports total in 2013 with an estimated imports total of £570 million and has been increasing at a steady rate since 2011. France and the Netherlands also made large contributions to total UK imports in 2013, with estimates of £441 million and £321 million respectively.
Imports from Asia increased from £1,102 million in 2012 to £1,426 million in 2013, the second largest contribution to the total UK imports estimate in 2013. Imports from Asia were predominantly sourced from Singapore and the Rest of Asia, with an estimated £347 million and £554 million imported to the UK from these countries respectively. Imports from Saudi Arabia showed a marked increase in 2012 rising to £252 million before returning to pre 2012 levels in 2013.
Imports to the UK from the Americas grew by £324 million rising from £706 million in 2012 to £1,030 million in 2013. The USA was the dominant country within the Americas, which the UK imported these services from, with an overall imports total in 2013 of £692 million.
Professional, management consulting and R&D services
The table below shows the service products used to compile the professional, management consulting and R&D services group across both 2012 and 2013.
Table 3: Service products used to compile the professional, management consulting and R&D services group across both 2012 and 2013
| 2012 | 2013 |
| Accountancy, auditing, bookkeeping and tax consulting services | Accountancy, auditing, bookkeeping and tax consulting services |
| Advertising | Advertising, market research and public opinion polling |
| Management consulting | Business management and management consulting services |
| Public relations services | Public relations services |
| Recruitment and training services | Recruitment services |
| Other business management services | Legal Services |
| Legal services | Procurement Services |
| Market research and public opinion polling | Property management services |
| Procurement | Provision of R&D services |
| Property management | Provision of product development and testing activities |
| Research and Development | Other business and professional services |
| Other business and professional services | |
| Source: Office for National Statistics | |
Download this table Table 3: Service products used to compile the professional, management consulting and R&D services group across both 2012 and 2013
.xls (28.2 kB)Exports
UK exports of professional, management consulting and R&D services continued on an upward trend with total UK exports rising to £29,109 million in 2013, an increase of £4,657 million.
Figure 6: Exports (excluding travel, transport and banking) of professional, management consulting and reseach and development services by continent, 2009 to 2013
Source: Office for National Statistics
Download this chart Figure 6: Exports (excluding travel, transport and banking) of professional, management consulting and reseach and development services by continent, 2009 to 2013
Image .csv .xlsEurope remained the largest export destination and showed growth of 21.4% rising from £13,702 million in 2012 to £16,629 million in 2013. Switzerland remained the largest export destination and showed the largest year on year increase rising from £2,220 million in 2012 to £3,464 million in 2013. Germany, the Irish Republic and the Netherlands also made large contributions to the overall UK exports total, all of which saw notable year on year increases. UK exports to Europe ‘unallocated’ experienced a decline in 2013 falling from £1,033 million in 2012 to £387 million in 2013. Europe ‘unallocated’ comprises of data where the respondent knows the continent services have been exported to but not specifically which country.
UK exports to the Americas increased from £7,089 million in 2012 to £8,182 million in 2013, an increase of 15.4%. This is in contrast to 2012 when the Americas showed flat growth. The USA continued to be the largest trading partner in receipt of UK exports of these services and was also the country which experienced the largest growth within the Americas in 2013.
UK exports to Asia increased by 17.5% in 2013, rising from £2,821 million in 2012 to £3,315 million. UK exports to Japan and the Rest of Asia made the largest contribution to the overall UK exports total in 2013, experiencing growth of £109 million and £126 million respectively.
Imports
Imports of professional, management consulting and R&D services to the UK increased from £12,349 million in 2012 to £15,608 million in 2013.
Figure 7: Imports (excluding travel, transport and banking) of professional, management consulting and research and development services 2009 to 2013
Source: Office for National Statistics
Download this chart Figure 7: Imports (excluding travel, transport and banking) of professional, management consulting and research and development services 2009 to 2013
Image .csv .xlsUK imports from the Americas continued to make the second largest contribution to the overall UK imports total. Imports to the UK from the Americas increased by £1,161 million in 2013, from £2,905 million in 2012 to £4,066 million in 2013. Imports of these services were primarily sourced from the USA which made the largest contribution to the overall UK imports total for the Americas, which rose to £3,671 million in 2013.
Merchanting, other trade related and services between related enterprises
The table below shows the service products used to compile the merchanting, other trade related and services between related enterprises group across both 2012 and 2013.
Table 4: Service products used to compile the merchanting, other trade related and services between related enterprises group across both 2012 and 2013
| 2012 | 2013 |
| Merchanting | Merchanting |
| Other trade related | Other trade related |
| Services between related enterprises | Services between related enterprises |
| Source: Office for National Statistics | |
Download this table Table 4: Service products used to compile the merchanting, other trade related and services between related enterprises group across both 2012 and 2013
.xls (27.1 kB)Exports
UK exports of merchanting, other trade related and services between related enterprises showed a decline in 2013 falling from £21,308 million in 2012 to £16,763 million, a decrease of £4,545 million. The time series from 2009 to 2011 shows that UK exports of these services had been increasing at a steady rate before growth started to decline in 2011.
Figure 8: Exports (excluding travel, transport and banking) of merchanted, other trade related and services between related enterprises by continent, 2009 to 2013
Source: Office for National Statistics
Download this chart Figure 8: Exports (excluding travel, transport and banking) of merchanted, other trade related and services between related enterprises by continent, 2009 to 2013
Image .csv .xlsUK exports to Europe continued to decline in 2013, falling from £11,579 million in 2012 to £8,872 million in 2013, a decrease of £2,707 million. Within Europe, UK exports to the Netherlands showed the largest decline falling from £2,189 million in 2012 to £1,189 million in 2013. Exports to Switzerland increased to £1,855 million in 2013, resulting in Switzerland making the largest contribution to the overall UK exports total. Despite showing a decline in 2013, the Netherlands continued to make a notable contribution to the overall UK exports total to Europe.
UK exports to the Americas also witnessed a decline in 2013, falling from £6,005 million in 2012 to £4,894 million in 2013, a decrease of £1,111 million. Apart from Brazil, the decline in exports of these services to the Americas was broad based, with the USA experiencing the largest decline.
UK exports to Asia declined in 2013, falling from £2,463 million in 2012 to £1,950 million in 2013. Declines were seen across the whole of Asia with the exception of Singapore, Hong Kong and the Rest of Asia which combined increased by £169 million.
The worldwide decline of these services seen in 2013 can in part be attributed to the decline of UK exports of ‘services between related enterprises’ which decreased by £5,646 million. Over recent years the product ‘services between related enterprises’, had become the largest service product contributing to total UK exports. Implementing the recommendations made in the current BPM6 manual resulted in a proportion of the data collected under this service product being reported elsewhere on the ITIS questionnaire therefore contributing to part of the decline seen in 2013.
Imports
UK imports of merchanting, other trade related and services between related enterprises to the UK also saw a decline in 2013, falling from £9,902 million in 2012 to £9,490 million in 2013. The rate of decline seen in UK imports of these services is much more subdued in comparison to the decline experienced in UK exports of these services, which saw a sharp downturn in 2013.
Figure 9: Imports (excluding travel, transport and banking) of merchanted, other trade related and services between related enterprises by continent, 2009 to 2013
Source: Office for National Statistics
Download this chart Figure 9: Imports (excluding travel, transport and banking) of merchanted, other trade related and services between related enterprises by continent, 2009 to 2013
Image .csv .xlsUK imports from Europe experienced marginal growth, rising from £5,407 million in 2012 to £5,502 million in 2013. The Netherlands made the largest contribution to the increase with imports rising to £973 million in 2013, an increase of £604 million. The rise in imports of these services from the Netherlands has resulted in the country making the largest contribution to the UK imports total of these services from Europe, superseding France which made the largest contribution in 2012.
UK imports from the Americas declined in 2013 falling from £2,409 million in 2012 to £2,206 million in 2013. This decline was primarily driven by a reduction in imports of these services from the USA to the UK, which fell by £290 million.
UK Imports from Asia continued to decline in 2013 falling by £299 million. Singapore showed the largest decline falling by £95 million to a total of £202 million in 2013.
Nôl i'r tabl cynnwys7. Section C: Trade in Services by Products: Industry Analysis
This section illustrates UK trade in services exports and imports detailed by industry and product classification.
Exports
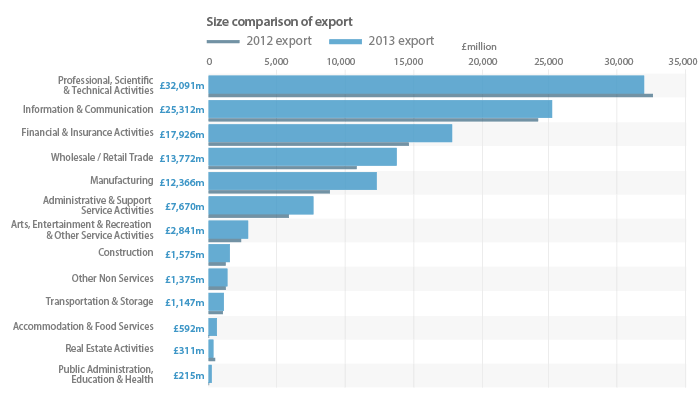
Figure 10: UK exports of products, by industry, 2013
Source: Office for National Statistics
Download this image Figure 10: UK exports of products, by industry, 2013
.png (35.1 kB) .xls (28.2 kB)The professional, scientific & technical activities sector remains the largest sector contributing to total UK exports followed by the information and communication sector, with shares of 27.4% and 21.6% respectively. UK exports from this sector experienced a small decline in 2013 of £633 million, falling from £32,724 million in 2012 to £32,091 million in 2013.
The breakdown of this sector by type of service product (Table C5 - 2013) shows that this sector primarily exported ‘business and professional’ type services, which accounted for £16,237 million of the sectors total services exports estimate. Exports of these services from this sector showed a decline of £6,789 million in 2013, which can partly be attributed to the revised layout of the ITIS questionnaire. Research and development services were included under ‘business and professional services’ up to 2012, however, from 2013, research and development estimates have a designated category of their own. Please refer to Table C5 – 2013 to see the revised service product layout.
The service product ‘services between related enterprises’ also showed a marked decline in 2013 falling by £3,302 million. This can also in part be attributed to the redesign of the ITIS questionnaire as values previously reported under this service type by respondents are now reported elsewhere on the questionnaire.
UK service exports from within the manufacturing sector expanded the most in 2013, rising by £3,356 million to a total service exports figure of £12,366 million. This is in contrast to the time series from 2009 which shows exports from the manufacturing sector have gradually been reducing. A large proportion of the increase was driven by exports of ‘manufacturing services on goods owned by others’ and ‘maintenance and repair services’ which had a combined exports figure of £2,558 million. These are new questions as of 2013. UK exports of ‘engineering services’ continued to make the largest contribution to the overall UK exports total for the manufacturing industry in 2013 with an estimated export total of £2,630 million.
Imports
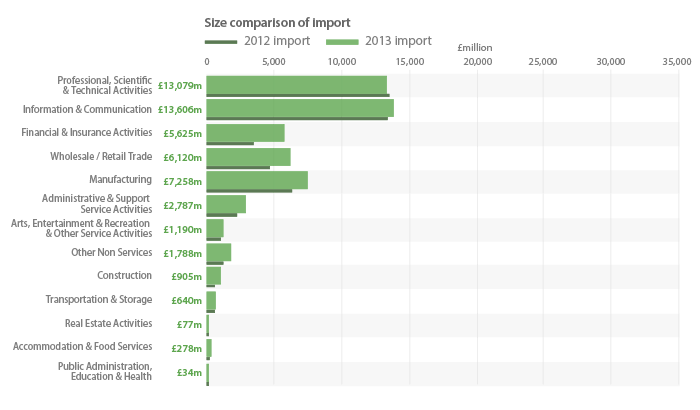
Figure 11: UK imports of products, by industry, 2013
Source: Office for National Statistics
Download this image Figure 11: UK imports of products, by industry, 2013
.png (32.6 kB) .xls (21.0 kB)In 2013, the information and communication sector made the largest contribution to total UK imports of services closely followed by the professional, scientific & technical activities sector.
Imports of services to the UK by the information and communication sector increased by £330 million, rising from £13,276 million in 2012 to £13,606 million in 2013. The increase seen in 2013 resulted in the information and communication sector becoming marginally the largest sector responsible for importing services to the UK.
The breakdown of this sector by type of service product (Table C4) shows that telecommunication and computer services are primarily the main types of services imported to the UK by the information and communication sector. Combined, these have a total UK imports estimate of £6,507 million which equates to 47.8% of the total UK imports value for this sector.
Analysing sector level growths between 2012 and 2013 shows that the financial and insurance activities sector expanded the most in terms of importing services to the UK which grew by £2,255 million in 2013, followed by the wholesale and retail sector which increased by £1,610 million.
Nôl i'r tabl cynnwys
