Cynnwys
- Main points
- Your views matter
- Overview
- Summary
- Section A: Total international trade in services (excluding travel, transport and banking) by continent and countries
- Section B: Trade in services products: geographical analysis
- Section C: Trade in services by products: industry analysis
- Background notes
1. Main points
Total UK exports of services (excluding travel, transport and banking) in current prices continued to rise, increasing from £117,193 million in 2013 to £119,703 million in 2014, an increase of 2.1%.
Total UK exports of services to Europe witnessed the largest increase in 2014, rising from £57,150 million in 2013 to £58,711 million, an increase of 2.7%. Exports to the Netherlands contributed most towards the increase.
The professional, scientific and technical industrial grouping was the largest in terms of UK service exports in 2014.
Total UK imports of services (excluding travel, transport and banking) in current prices increased by 2.0%, rising from £53,387 million in 2013 to £54,455 million in 2014.
Imports of services to the UK from Germany showed the largest growth within Europe rising from £4,736 million in 2013 to £5,287 million in 2014.
The information and communication services industrial grouping was the largest in terms of UK services imports in 2014.
2. Your views matter
The structure of this release has been modified in response to your feedback. We are constantly aiming to improve this release and its associated commentary. We would welcome any feedback you might have and would be particularly interested in knowing how you make use of these data to inform your work. Please contact us via email: itis@ons.gov.uk or telephone Michael Hardie on +44 (0)1633 455923.
Nôl i'r tabl cynnwys3. Overview
The 2014 International Trade in Services (ITIS) publication provides a detailed breakdown of annual trade in services estimates, analysing data by country, product and industry. These data are sourced from our International Trade in Services survey.
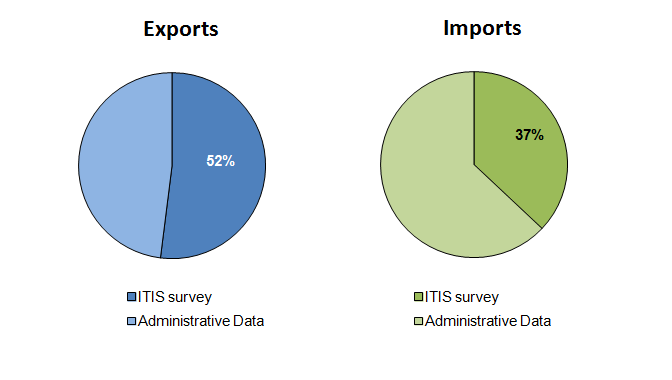
The ITIS survey is a main source of UK trade data although it is important to note that the survey does not cover the whole of the UK economy. The travel, transport and banking sectors of the economy are not covered by the ITIS survey, as these data are obtained from other sources such as the International Passenger Survey and the Bank of England. Estimates for the overall level of trade in services, including these industries, are published in our annual Pink Book and monthly UK trade publications. Based on the 2014 estimates, the ITIS data contributed approximately 52% and 37% respectively to the total trade in services export and import estimates for the whole of the UK.
More information on UK trade can be found on our website.
Figure 1: Percentage contribution of International Trade in Service (ITIS) to total Trade in Services, 2014
UK
Source: Office for National Statistics
Download this image Figure 1: Percentage contribution of International Trade in Service (ITIS) to total Trade in Services, 2014
.png (18.5 kB) .xls (25.6 kB)The 2013 edition of this publication contained the first set of ITIS results that had been collected and published according to the agreed international standards set out in the sixth edition of the International Monetary Fund (IMF) Balance of Payments manual (BPM6). The recommendations from the revised manual resulted in the ITIS questionnaire being thoroughly reviewed and updated. The data for 2014 was collected and processed in the same manner as 2013, meaning a comprehensive and comparable 2 year time series is now available.
A copy of the ITIS questionnaire is available on the Introduction to ITIS page on our website.
Nôl i'r tabl cynnwys4. Summary
Total exports of services (excluding travel, transport and banking) from the UK increased from £117,193 million in 2013 to £119,703 million in 2014 in current prices, an increase of 2.1%.
UK exports of services increased by an average annual rate of 9.6% between 2001 and 2013. The rate of growth slowed in 2014 with UK exports increasing by 2.1%, the lowest recorded in over a decade.
Total imports of services (excluding travel, transport and banking) to the UK, in current prices increased from £53,387 million in 2013 to £54,455 million in 2014, an increase of 2.0%.
Imports of services to the UK increased by an annual average rate of 9.2% between 2001 and 2014; although growth of imports has fluctuated more between years than UK exports. The rate of growth in UK imports slowed in 2014 to 2.0%, the lowest recorded growth rate since 2010, when imports to the UK grew by 1.2%.
The ITIS estimates show that in 2014 the UK continued to be a net exporter of services meaning more services were exported from the UK than imported. The UK trade balance for services stood at £65,248 million in 2014, an increase of 2.3% when compared with 2013.
Figure 2: Total International Trade In Services (excluding travel, transport and banking), 2001 to 2014
UK
Source: Office for National Statistics
Notes:
- All values are at current prices (see background notes for definition).
Download this chart Figure 2: Total International Trade In Services (excluding travel, transport and banking), 2001 to 2014
Image .csv .xls5. Section A: Total international trade in services (excluding travel, transport and banking) by continent and countries
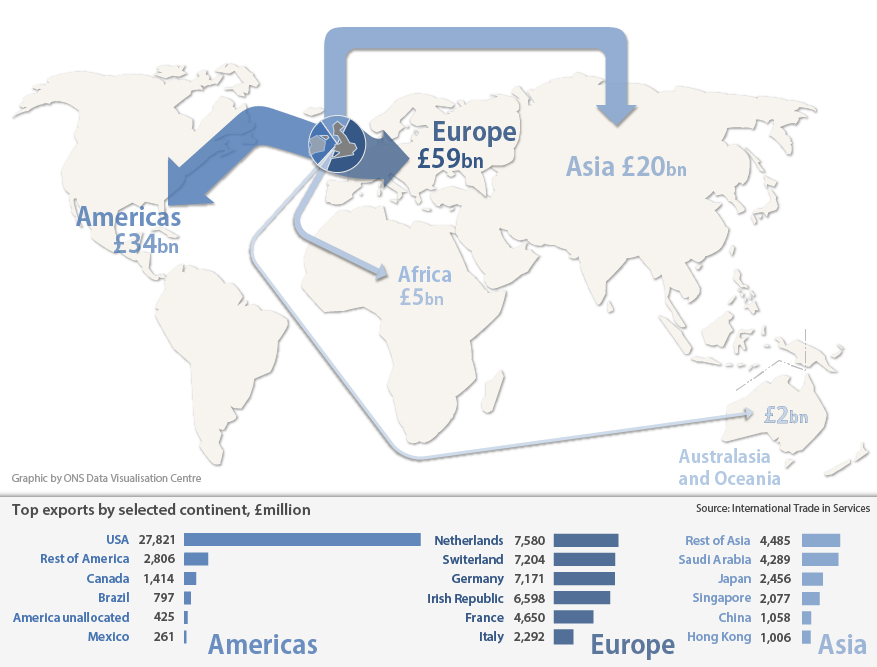
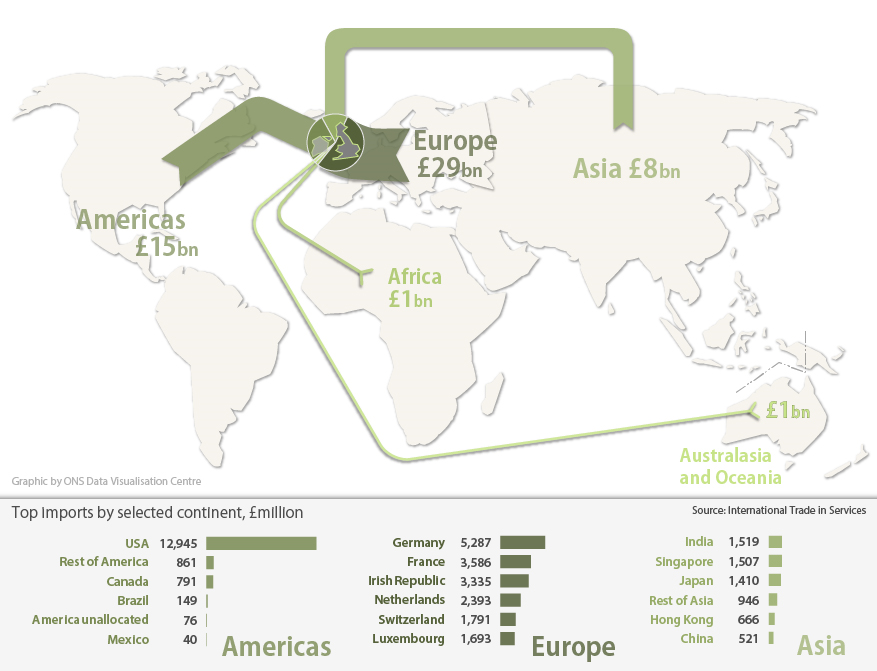
This section shows geographical findings for total UK international trade in services (excluding travel, transport and banking). The size of the arrows in figures 2 and 3 are proportionate to the size of the continental export and import markets for the UK.
For more detailed geographic information relating to total export and imports of services please refer to table A0 – Total trade in services (excluding travel, transport and banking) analysed by continents and countries.
Exports of services
Figure 3: UK International Trade In Services (excluding travel, transport and banking), exports by continent, 2014
Source: Office for National Statistics
Notes:
- All values are at current prices (see background notes for definition).
- Geographical groupings can be found in the background notes.
- bn refers to billion.
Download this image Figure 3: UK International Trade In Services (excluding travel, transport and banking), exports by continent, 2014
.png (241.4 kB) .xls (19.5 kB)UK exports of services to Europe continued on an upward trend in 2014, rising from £57,150 million in 2013 to £58,711 million in 2014 and Europe remained the largest area in receipt of UK exports of services. The Netherlands surpassed Switzerland in 2014 to become the main trading partner of the UK within Europe, with UK exports to the Netherlands increasing from £5,584 million in 2013 to £7,580 million in 2014. Switzerland and Germany remained prime destinations for UK exports; although both countries saw small declines in UK exports of £508 million and £319 million respectively in 2014.
The Americas, supported by the USA, remained the second largest area in receipt of UK exports of services in 2014. UK exports of services to the Americas increased from £32,915 million in 2013 to £33,523 million in 2014, of which UK exports to the USA made the largest contribution with exports of £27,821 million in 2014.
As in previous years, Asia remained the third largest destination for UK exports of services and increased marginally in 2014, rising from £19,660 million in 2013 to £19,703 million in 2014. The rest of Asia surpassed Saudi Arabia in 2014 to become the largest destination for UK service exports in Asia in 2014. UK service exports to Saudi Arabia declined in 2014 falling from £5,315 million in 2013 to £4,289 million in 2014.
Imports of services
Figure 4: UK International Trade In Services (excluding travel, transport and banking), imports by continent, 2014
Notes:
- bn refers to billion.
Download this image Figure 4: UK International Trade In Services (excluding travel, transport and banking), imports by continent, 2014
.png (229.2 kB) .xls (19.5 kB)UK imports of services from Europe showed a decline in 2014, falling from £29,359 million in 2013 to £29,085 million in 2014. The most notable decline was from the Irish Republic where UK imports fell from £4,084 million in 2013 to £3,335 million in 2014. Partly offsetting this decline were increases in UK imports from Germany and France, which rose by £551 million and £312 million respectively. Germany remained the main origin for UK imports in 2014, with UK imports increasing to £5,287 million. France surpassed the Irish Republic to become the second largest origin for UK imports in 2014, rising to £3,586 million in 2014. The decline in UK imports of services from Europe in 2014 is the first recorded since 2011.
UK imports of services from the Americas have increased each year since 2010 and increased further in 2014, from £13,336 million in 2013 to £14,863 million in 2014. The USA remained the largest place of origin for UK imports from the Americas in 2014 and increased from £11,642 million in 2013 to £12,945 million in 2014.
Asia remained the third largest area from which UK imports of services originated, with imports being primarily sourced from India and Singapore in 2014.
Nôl i'r tabl cynnwys6. Section B: Trade in services products: geographical analysis
This section presents UK trade in services estimates by broad product type, and provides an overview of the changes in the value of exports and imports for these types of services by continent between 2013 and 2014.
The ITIS statistical bulletin provides geographical breakdowns for 3 broad services product types: technical, trade related, operational leasing and other business services; professional, management consulting and research and development (R&D) services; and merchanting, other-trade related and services between related enterprises. The proportions each of these product types contributed to total UK exports and imports of services in 2014 are presented in Table 1.
Table 1: Composition of trade in services by broad product type, 2014
| UK | ||
| Exports | Imports | |
| Technical, trade related, operational leasing and other business services | 15.1% | 11.7% |
| Professional, management consulting and R&D services | 25.9% | 26.8% |
| Merchanting, other-trade related and services between related enterprises | 12.2% | 19.0% |
| Source: Office for National Statistics | ||
Download this table Table 1: Composition of trade in services by broad product type, 2014
.xls (25.6 kB)Technical, trade related, operational leasing and other business services group
Table 2 presents the service products that comprise the technical, trade related, operational leasing and other business services group up to 2012 and from 2013 onwards. Implementing the latest BPM6 recommendations resulted in a change to the grouping from 2013 onwards.
Table 2: Service products used to compile the technical, trade related, operational leasing and other business services group, 2012 and 2013 onwards
| 2012 | 2013 onwards |
| Agricultural services | Agricultural, forestry and fishing |
| Mining services | Mining and oil and gas extraction services |
| Waste treatment and depollution | Waste treatment and depollution |
| Other on site processing | Manufacturing services on goods owned by others |
| Maintenance and repair services | |
| Construction in the UK | Construction in the UK |
| Construction outside the UK | Construction outside the UK |
| Architectural services | Architectural services |
| Engineering services | Engineering services |
| Surveying services | Scientific and other technical services inc surveying |
| Operational leasing services | Operational leasing services |
| Source: Office for National Statistics | |
Download this table Table 2: Service products used to compile the technical, trade related, operational leasing and other business services group, 2012 and 2013 onwards
.xls (25.6 kB)Exports
UK exports of technical, trade related, operational leasing and other business services showed further growth in 2014, rising from £17,277 million in 2013 to £18,094 million in 2014.
Figure 5: Exports (excluding travel, transport and banking) of technical, trade related, operational leasing and other business services, by continent, 2010 to 2014
UK
Source: Office for National Statistics
Notes:
- All values are at current prices (see background notes for definition).
- Geographical groupings can be found in the background notes.
Download this chart Figure 5: Exports (excluding travel, transport and banking) of technical, trade related, operational leasing and other business services, by continent, 2010 to 2014
Image .csv .xlsUK exports of technical, trade related, operational leasing and other business services to Europe reached £6,841 million in 2014, a £564 million increase compared with 2013. Growth in 2014 appears notably smaller than in 2013, when UK exports of these types of services almost doubled. The Netherlands remained the largest destination for UK services exports in 2014, reaching £1,229 million in 2014, a £232 million increase compared with 2013. Norway remained the second largest destination for UK exports of these types of services within Europe, with the value of exports rising to £1,028 million in 2014, an increase of £158 million compared with 2013.
UK exports of technical, trade related, operational leasing and other business services to Asia increased from £4,566 million in 2013 to £4,748 million in 2014. UK exports to Singapore showed the largest growth, rising from £183 million in 2013 to £821 million in 2014. In contrast to 2013, UK exports to Saudi Arabia almost halved, falling from £1,315 million in 2013 to £713 million in 2014 signalling a return to levels seen in 2012.
The Americas were the third largest destination in 2014 for UK exports of technical, trade related, operational leasing and other business services; however, experienced a decline, falling from £4,237 million in 2013 to £3,926 million in 2014. The decline was driven by the rest of America where exports fell from £424 million in 2013 to £201 million in 2014. Despite experiencing a decline in 2014, the USA remained the largest destination in the Americas for these types of UK services exports.
Imports
UK imports of technical, trade related, operational leasing and other business services increased from £5,675 million in 2013 to £6,383 million in 2014, the third consecutive period of growth since 2011.
Figure 6: Imports (excluding travel, transport and banking) of technical, trade related, operational leasing and other business services, by continent, 2010 to 2014
UK
Source: Office for National Statistics
Download this chart Figure 6: Imports (excluding travel, transport and banking) of technical, trade related, operational leasing and other business services, by continent, 2010 to 2014
Image .csv .xlsImports to the UK from Europe of technical, trade related, operational leasing and other business services increased from £2,961 million in 2013 to £3,292 million in 2014. Italy made the largest positive contribution to UK imports, rising from £274 million in 2013 to £410 million in 2014. With the exception of 2013, UK imports of these types of services from Italy have increased in each year since 2010. Imports of these types of services to the UK from Germany fell from £570 million in 2013 to £495 million in 2014. Germany remained the largest source of imports to the UK for these types of services from within Europe.
Imports to the UK from Asia of technical, trade related, operational leasing and other business services increased from £1,426 million in 2013 to £1,636 million in 2014. Singapore made the largest contribution to the increase, with imports to the UK more than doubling from £347 million in 2013 to £735 million in 2014. Partly offsetting the rise in imports from Singapore was a decline in imports from the rest of Asia, which fell from £554 million in 2013 to £268 million in 2014.
Imports to the UK from the Americas of technical, trade related, operational leasing and other business services increased from £1,030 million in 2013 to £1,251 million in 2014. The USA remained the largest country within the Americas for these types of imports, accounting for £736 million in 2014.
Professional, management consulting and research and development (R&D) services
Table 3 presents the service products used to compile the professional, management consulting and R&D services group up to 2012 and from 2013 onwards. Implementing the latest BPM6 recommendations resulted in a change to the grouping from 2013 onwards.
Table 3: Service products used to compile the professional, management consulting and R&D services group, 2012 and 2013 onwards
| 2012 | 2013 onwards |
| Accountancy, auditing, bookkeeping and tax consulting services | Accountancy, auditing, bookkeeping and tax consulting services |
| Advertising | Advertising, market research and public opinion polling |
| Management consulting | Business management and management consulting services |
| Public relations services | Public relations services |
| Recruitment and training services | Recruitment services |
| Other business management services | Legal Services |
| Legal services | Procurement Services |
| Market research and public opinion polling | Property management services |
| Procurement | Provision of R&D services |
| Property management | Provision of product development and testing activities |
| Research and Development | Other business and professional services |
| Other business and professional services | |
| Source: Office for National Statistics | |
Download this table Table 3: Service products used to compile the professional, management consulting and R&D services group, 2012 and 2013 onwards
.xls (17.9 kB)Exports
UK exports of professional, management consulting and R&D services showed further growth in 2014, with exports rising from £29,109 million in 2013 to £31,063 million in 2014.
Figure 7: Exports (excluding travel, transport and banking) of professional, management consulting and research and development services, by continent, 2010 to 2014
UK
Source: Office for National Statistics
Notes:
- All values are at current prices (see background notes for definition).
- Geographical groupings can be found in the background notes.
Download this chart Figure 7: Exports (excluding travel, transport and banking) of professional, management consulting and research and development services, by continent, 2010 to 2014
Image .csv .xlsEurope remained the largest destination for UK exports of professional, management consulting and R&D services, and showed continued growth in 2014, rising from £16,629 million in 2013 to £17,291 million in 2014. The Netherlands showed the largest increase in 2014, rising from £1,373 million in 2013 to £1,973 million in 2014. Switzerland remained the largest destination within Europe for these types of UK service exports, despite falling from £3,464 million in 2013 to £3,090 million in 2014. Germany was the second largest destination for exports of these types of services in 2014 and also saw a decline.
UK exports to the Americas of professional, management consulting and R&D services increased from £8,182 million in 2013 to £8,916 million in 2014. The USA remained the largest destination in the Americas for these types of services, rising from £6,847 million in 2013 to £7,783 million in 2014.
UK exports to Asia of professional, management consulting and R&D services increased in 2014, rising from £3,315 million in 2013 to £3,675 million in 2014. Within Asia, Japan remained the largest destination for UK exports of these types of services, reaching £1,014 in 2014, a £137 million increase compared with 2013. Singapore experienced the largest increase in 2014, rising from £268 million in 2013 to £419 million in 2014. UK exports of these types of services to the rest of Asia fell from a peak of £930 million in 2013 to £795 million in 2014.
Imports
Imports of professional, management consulting and R&D services to the UK decreased from £15,608 million in 2013 to £14,610 million in 2014.
Figure 8: Imports (excluding travel, transport and banking) of professional, management consulting and research and development services, by continent, 2010 to 2014
UK
Source: Office for National Statistics
Notes:
- All values are at current prices (see background notes for definition).
- Geographical groupings can be found in the background notes.
Download this chart Figure 8: Imports (excluding travel, transport and banking) of professional, management consulting and research and development services, by continent, 2010 to 2014
Image .csv .xlsEurope was the main source for UK imports of professional, management consulting and R&D services in 2014. The value of UK imports of these types of services from Europe declined in 2014, falling from a peak of £8,536 million in 2013 to £7,953 million in 2014. Small declines in imports to the UK were generally experienced by most countries within Europe; Sweden and Switzerland saw the largest decreases, falling by £246 million and £129 million respectively. Partly offsetting these falls were positive contributions from Germany, where imports rose from £1,581 million in 2013 to £1,723 million in 2014 and the Netherlands, where imports increased from £485 million in 2013 to £574 million in 2014.
The Americas remained the second largest source for UK imports of professional, management consulting and R&D services. Imports of these types of services increased from £4,066 million in 2013 to £4,161 million in 2014. The USA remained the largest country in the Americas for these type of imports, reaching £3,788 million in 2014.
Merchanting, other trade related and services between related enterprises
Table 4 presents the service products used to compile the merchanting, other trade related and services between related enterprises group up to 2012 and from 2013 onwards. Implementing the latest BPM6 recommendations resulted in a change to the grouping from 2013 onwards.
Table 4: Service products used to compile the merchanting, other trade related and services between related enterprises group, 2014
| UK | |
| 2012 | 2013 onward |
| Merchanting | Merchanting |
| Other trade related | Other trade related |
| Services between related enterprises | Services between related enterprises |
| Source: Office for National Statistics | |
Download this table Table 4: Service products used to compile the merchanting, other trade related and services between related enterprises group, 2014
.xls (23.0 kB)Exports
UK exports of merchanting, other trade related and services between related enterprises showed a decline in 2014, falling from £16,763 million in 2013 to £14,590 million in 2014. UK exports of these types of services had been increasing at a steady rate before growth started to decline in 2012.
Figure 9: Exports (excluding travel, transport and banking) of merchanted, other trade related and services between related enterprises by continent, 2010 to 2014
UK
Source: Office for National Statistics
Notes:
- All values are at current prices (see background notes for definition).
- Geographical groupings can be found in the background notes.
Download this chart Figure 9: Exports (excluding travel, transport and banking) of merchanted, other trade related and services between related enterprises by continent, 2010 to 2014
Image .csv .xlsUK exports to Europe of merchanting, other trade related and services between related enterprises continued to decline in 2014, falling from £8,872 million in 2013 to £7,885 million in 2014. Within Europe, UK exports to Germany showed the largest decline, falling from £1,180 million in 2013 to £805 million in 2014. UK exports to Switzerland also saw a notable decline, falling from £1,855 million in 2013 to £1,530 million in 2014. Partly offsetting the decline was a rise in UK exports of these types of services to the Netherlands, which increased from £1,189 million in 2013 to £1,437 million in 2014. Switzerland and the Netherlands were the largest and second largest European UK export markets for these types of services in 2014.
UK exports to the Americas of merchanting, other trade related and services between related enterprises also experienced a decline in 2014, falling from £4,894 million in 2013 to £4,458 million in 2014. The USA experienced the largest decline, falling from £4,505 million in 2013 to £4,094 million in 2014.
Imports
UK imports of merchanting, other trade related and services between related enterprises to the UK increased in 2014 rising from £9,490 million in 2013 to a peak of £10,355 million in 2014, the highest recorded value since 2010.
Figure 10: Imports (excluding travel, transport and banking) of merchanted, other trade related and services between related enterprises by continent, 2010 to 2014
UK
Source: Office for National Statistics
Notes:
- All values are at current prices (see background notes for definition).
- Geographical groupings can be found in the background notes.
Download this chart Figure 10: Imports (excluding travel, transport and banking) of merchanted, other trade related and services between related enterprises by continent, 2010 to 2014
Image .csv .xlsEurope continued to be the main source for UK imports of merchanting, other trade related and services between related enterprises, with a total import value from Europe of £5,154 million in 2014. Despite remaining a dominant area in 2014, UK imports from Europe declined by £348 million to £5,154 million in 2014 compared with 2013. The decline can be attributed to a reduction in UK imports from the Netherlands, which fell from a peak of £973 million in 2013 to £486 million in 2014, signalling a return to pre-2013 levels. Germany and France were the 2 largest sources for these types of UK imports from Europe in 2014, accounting for £951 million and £895 million respectively.
The growth seen in UK imports of merchanting, other trade related and services between related enterprises in 2014 was driven by increased imports from the Americas which increased from £2,206 million in 2013 to £3,237 million in 2014. The increase was mainly from the USA, which increased from £1,940 million in 2013 to £2,838 million in 2014.
UK imports from Asia also grew in 2014, rising from £1,369 million in 2013 to £1,584 million in 2014. India and Japan made the largest contributions to the increase in 2014, with imports to the UK rising by £82 million and £70 million respectively.
Nôl i'r tabl cynnwys7. Section C: Trade in services by products: industry analysis
This section provides an overview of UK trade in services exports and imports detailed by industry.
Exports
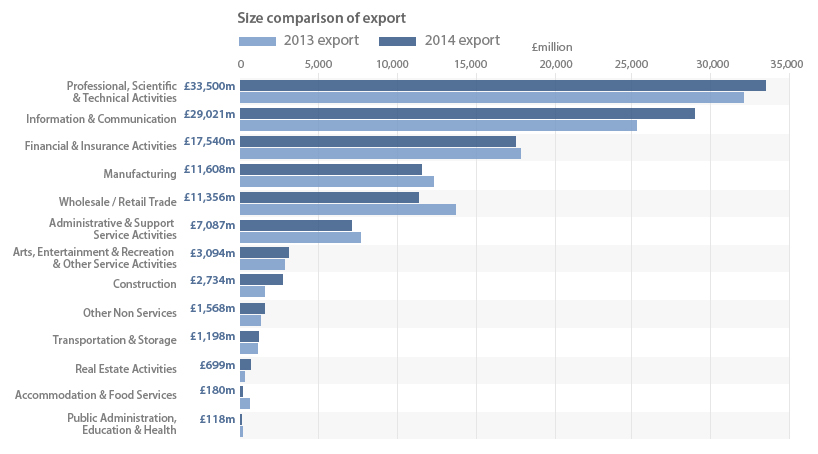
Figure 11: UK exports of products, by industry, 2014
Source: Office for National Statistics
Notes:
- All values are at current prices (see background notes for definition).
- m refers to million.
Download this image Figure 11: UK exports of products, by industry, 2014
.png (67.5 kB) .xls (27.6 kB)In 2014, the professional, scientific and technical activities industrial grouping remained the largest in terms of UK exports of services, accounting for 28.0% of total services exports; followed by the information and communication services industrial grouping, which accounted for 24.2%.
UK exports from the professional, scientific and technical activities industrial grouping increased from £32,091 million in 2013 to £33,500 million in 2014.
A breakdown of this industrial grouping by type of service product is presented in table C5. The table shows that "business and professional" services accounted for £17,567 million of total UK exports from within this industrial grouping. UK exports of legal services was the largest service product within "business and professional" services. UK exports of legal services increased from £4,015 million in 2013 to £4,552 million in 2014. The service product "services between related enterprises" also made a notable positive contribution to the growth of UK exports of "business and professional" services, increasing from £3,320 million in 2013 to £3,650 million in 2014.
The information and communication sector was the second largest industrial grouping in terms of UK exports of services and expanded the most in 2014, rising from £25,312 million in 2013 to £29,021 million in 2014, an increase of £3,709 million. The breakdown of the information and communication sector by type of service product (table C4) shows that this sector mainly exported "telecommunication, computer and information" type services, which grew from £12,788 million in 2013 to £15,854 million in 2014.
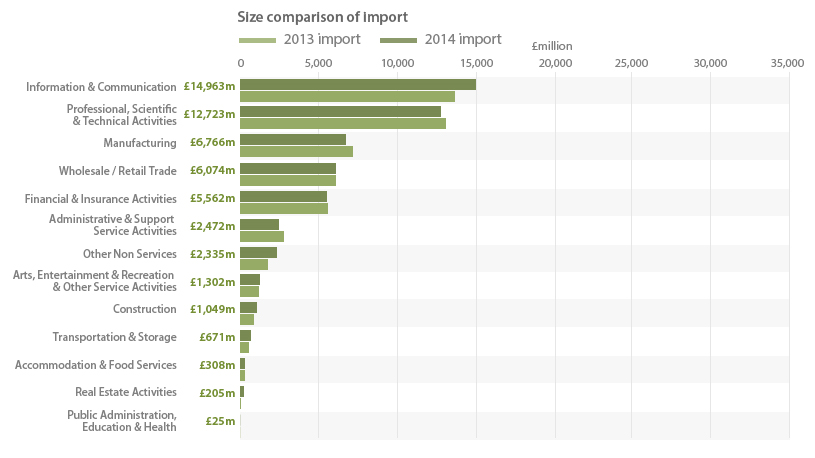
Figure 12: UK imports of products, by industry, 2014
Source: Office for National Statistics
Notes:
- All values are at current prices (see background notes for definition).
- m refers to million.
Download this image Figure 12: UK imports of products, by industry, 2014
.png (65.1 kB) .xls (20.5 kB)In 2014, the information and communication industrial grouping continued to account for the largest amount of UK imports of services.
UK imports of services by the information and communication industries increased from £13,606 million in 2013 to £14,963 million in 2014. A breakdown of this industrial grouping by type of service product (table C4) shows that telecommunication and computer services were the main types of services imported to the UK within the information and communication industries. Imports of telecommunication services increased from £3,227 million in 2013 to £4,221 million in 2014 whereas imports of computer services experienced a small decline, falling from £3,230 million in 2013 to £2,926 million in 2014.
The professional, scientific and technical activities industrial grouping was the second largest industrial grouping, despite experiencing a decline in 2014. Imports to the UK from this industrial grouping fell from £13,079 million in 2013 to £12,723 million in 2014. This is the second period of decline since 2012 when imports to the UK for these industries reached £13,401 million. The decline in 2014 is driven by a fall in imports to the UK of intellectual property type services (table c5), which fell from £923 million in 2013 to £649 million in 2014.
Imports to the UK by industries related to financial and insurance activities showed a small decline in 2014, falling from £5,625 million in 2013 to £5,562 million in 2014. This is in contrast to the notable increase seen by these industries in 2013, when imports rose from £3,370 million in 2012 to £5,625 million in 2013.
Nôl i'r tabl cynnwys
