Cynnwys
- Main points
- Statistician’s comment
- Things you need to know about this release
- Average worthwhile and happiness ratings increase in the UK
- Scotland is the only country to show improvements across any measures of personal well-being
- A larger proportion of people in Wales report low ratings of life satisfaction, worthwhile and happiness compared with the UK average
- Are the current personal well-being thresholds the best way to measure well-being inequality?
- Quality and methodology
1. Main points
Between the years ending December 2016 and 2017, average ratings of happiness and feeling that the things done in life are worthwhile have slightly increased in the UK.
There has been no overall change in average ratings of life satisfaction and anxiety.
Scotland has shown improvements in average ratings of life satisfaction, worthwhile and happiness but there have been no overall changes in England, Wales or Northern Ireland.
A larger proportion of people in Wales reported low levels of life satisfaction, worthwhile and happiness compared with the UK average in the year ending December 2017.
2. Statistician’s comment
"An important aspect of our work is to shed light on inequalities in society to better support who is struggling in different aspects of life. For example, over this period we have seen some differences between countries, with Scotland driving improvements in personal well-being in the UK. We have reported today some initial work on how to best measure well-being inequalities. We are planning more work to explore them, especially any characteristics and circumstances common to people who give the lowest well-being scores.”
Silvia Manclossi, Head of Quality of Life Team, Office for National Statistics
Nôl i'r tabl cynnwys3. Things you need to know about this release
Measuring National Well-being programme
The four personal well-being questions are included as measures for the wider Measuring National Well-being (MNW) programme, which began in November 2010 with the aim to develop and publish an accepted and trusted set of National Statistics, which help people understand and monitor well-being.
The statistics mentioned in this bulletin are displayed through our well-being dashboard, which reports how the UK is doing for the different areas of life that matter most to the UK public.
Please see the Quality and methodology section for more information.
Measuring well-being inequalities
To increase the value of our work for decision makers and in keeping with our aspiration to “leave no one behind”, work has been undertaken with the New Economics Foundation (NEF) and the What Works Centre for Well-being to identify a possible headline indicator to measure well-being inequalities. Alongside this release, a summary of the work has been published, as well as the full report being available on the NEF website.
The second half of this bulletin discusses the work done as part of the recommendation to test the possibility of widening the lowest thresholds of personal well-being to better capture inequalities and the next steps in relation to our inequalities work.
It is important to note that the data in this bulletin are taken from a household survey to help understand the well-being of those living in private residential households. People living in communal establishments (such as care homes) or other non-household situations are not represented in the Annual Population Survey. This may be important in interpreting the findings as we could possibly be excluding some of those more likely to have poor well-being.
Nôl i'r tabl cynnwys4. Average worthwhile and happiness ratings increase in the UK
The average (mean) ratings across the four measures of personal well-being in the year ending December 2017 were:
7.7 out of 10 for life satisfaction
7.9 out of 10 for feeling that what you do in life is worthwhile
7.5 out of 10 for happiness yesterday
2.9 out of 10 for anxiety yesterday
Between the years ending December 2016 and 2017, there were improvements in average ratings of happiness and feeling that the things done in life are worthwhile for the UK overall. There were no significant changes in average ratings of life satisfaction or anxiety.
Figures 1a and 1b display the changes in personal well-being in the UK between the years ending March 2012 and December 2017.
Figure 1a: Average life satisfaction, worthwhile and happiness ratings, year ending March 2012 to year ending December 2017
UK
Source: Annual Population Survey, Office for National Statistics
Download this chart Figure 1a: Average life satisfaction, worthwhile and happiness ratings, year ending March 2012 to year ending December 2017
Image .csv .xls
Figure 1b: Average anxiety ratings, year ending March 2012 to year ending December 2017
UK
Source: Annual Population Survey, Office for National Statistics
Download this chart Figure 1b: Average anxiety ratings, year ending March 2012 to year ending December 2017
Image .csv .xls5. Scotland is the only country to show improvements across any measures of personal well-being
Between the years ending December 2016 and 2017, improvements in worthwhile and happiness ratings in the UK were driven by Scotland, where average (mean) ratings also improved. Interestingly, average life satisfaction ratings also improved for Scotland; however, there were no significant changes for ratings of anxiety. No overall changes were reported for any measure of personal well-being in England, Wales or Northern Ireland.
People in Northern Ireland did, however, continue to report higher levels of personal well-being compared with the UK average in the year ending December 2017. Since we began reporting the data in 2012, every country has seen an improvement in their mean ratings of life satisfaction, worthwhile and happiness. England and Northern Ireland have also seen a drop in their average ratings of self-reported anxiety over this period.
Figure 2a shows how the mean levels of life satisfaction, worthwhile and happiness have changed in Scotland between the years ending March 2012 and December 2017. Figure 2b shows how the mean ratings of anxiety have changed in Scotland over the same period.
Figure 2a: Average life satisfaction, worthwhile and happiness ratings in Scotland between the years ending March 2012 and December 2017
Source: Annual Population Survey, Office for National Statistics
Download this chart Figure 2a: Average life satisfaction, worthwhile and happiness ratings in Scotland between the years ending March 2012 and December 2017
Image .csv .xls
Figure 2b: Average anxiety ratings in Scotland between the years ending March 2012 and December 2017
Source: Annual Population Survey, Office for National Statistics
Download this chart Figure 2b: Average anxiety ratings in Scotland between the years ending March 2012 and December 2017
Image .csv .xls6. A larger proportion of people in Wales report low ratings of life satisfaction, worthwhile and happiness compared with the UK average
In the year ending December 2017, a larger proportion of people in Wales reported low levels of life satisfaction, worthwhile and happiness compared to the UK average. For example, 4.3% of people in Wales reported a score of 0 to 4 for their worthwhile ratings compared with only 3.4% in the whole of the UK. However, there was no significant difference in anxiety ratings between Wales and the UK average.
Over the same period, a larger proportion of people in Northern Ireland reported very high ratings for life satisfaction, worthwhile and happiness and very low scores for anxiety compared with the UK average. This has been a consistent trend over time.
Figure 3 compares the proportion of people reporting low ratings of life satisfaction, worthwhile and happiness in Wales with the UK average.
Figure 3: Proportions of people reporting low levels of life satisfaction, worthwhile and happiness in Wales compared to the UK average, for the year ending December 2017
UK and Wales
Source: Annual Population Survey, Office for National Statistics
Download this chart Figure 3: Proportions of people reporting low levels of life satisfaction, worthwhile and happiness in Wales compared to the UK average, for the year ending December 2017
Image .csv .xls7. Are the current personal well-being thresholds the best way to measure well-being inequality?
Background
As part of increasing interest in how well-being is distributed across the UK and groups within it, research was undertaken to investigate a range of possible measures of well-being inequalities. This work was commissioned by Office for National Statistics (ONS) and carried out by the New Economics Foundation (NEF) in collaboration with the What Works Centre for Well-being. Understanding how different groups of people rate their personal well-being is important to identify who is thriving and who is struggling in different aspects of life.
The project involved interviews with a range of stakeholders as well as an online survey to understand more about what the goals of reducing well-being inequality might be. This informed our views of what it is important to measure. The project report, which explores the strengths and weaknesses of different measures of well-being inequality, has been published alongside this release.
The conclusion from this project is that “thresholds” seem to be the most appropriate way to present well-being inequalities. This means that people’s self-reported ratings of life satisfaction, worthwhile, happiness and anxiety may be said to represent “very high” or “very low” well-being depending on the score they attributed to each question. Although this is the method currently used by ONS, a recommendation was made to consider widening the threshold for lowest well-being. It was suggested that:
the current definition may exclude individuals who are struggling but giving slightly higher scores to the questions
increasing the threshold may allow further disaggregation of the data, especially at local level, to better explore issues affecting people in the current low threshold (0 to 4)
The current thresholds used in the personal well-being publications are detailed in Table 1. The thresholds were initially established in 2011 when the first well-being data were collected by ONS. They were developed with expert academic advice and agreed by the National Statistician’s Measuring National Well-being Advisory Forum.
Table 1: Labelling of thresholds, UK
| Life satisfaction, worthwhile and happiness scores | Anxiety scores | ||
|---|---|---|---|
| Response on an 11 point scale | Label | Response on an 11 point scale | Label |
| 0 to 4 | Low | 0 to 1 | Very low |
| 5 to 6 | Medium | 2 to 3 | Low |
| 7 to 8 | High | 4 to 5 | Medium |
| 9 to 10 | Very high | 6 to 10 | High |
| Source: Office for National Statistics | |||
Download this table Table 1: Labelling of thresholds, UK
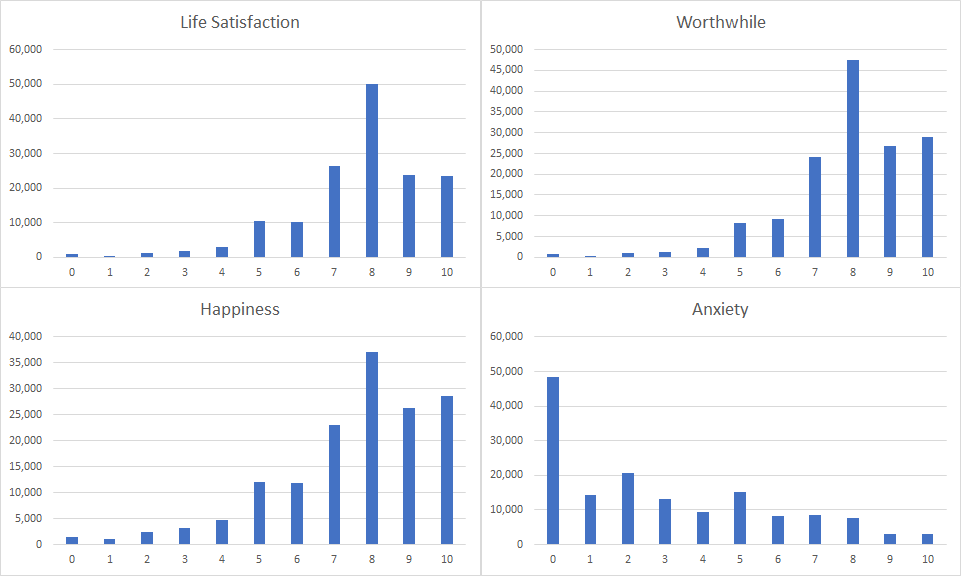
.xls (32.8 kB)Figure 4 shows the distribution of responses for each measure of personal well-being in the year ending December 2017. The distributions of the life satisfaction, worthwhile and happiness scores are skewed to the right (the positive end of the scale) and for anxiety the distribution is skewed to the left (also the positive end of the scale). Additionally, Figure 4 shows that more people rate their life satisfaction, worthwhile and happiness as 5 (the mid-point of the response scale) than 4 or below. For anxiety, more people gave ratings up to 5 while fewer gave ratings of 6 or more.
Figure 4: Distributions showing the number of people responding to each point on the scale, year ending December 2017
UK
Source: Annual Population Survey, Office for National Statistics
Download this image Figure 4: Distributions showing the number of people responding to each point on the scale, year ending December 2017
.png (27.7 kB) .xlsx (11.6 kB)
The purpose of testing different thresholds was to explore:
whether wider thresholds show similar patterns in the data over time
how much the sample size in the low threshold increases when it is widened
whether increasing the size of the low threshold would allow for more robust analysis of this group
whether the demographics of the respondents reporting 0 to 4 differ from those reporting 5 or 6 on the scale
Details of the thresholds tested are shown in Table 2.
Table 2: Testing of thresholds, UK
| Well-being measure | Current Threshold | First threshold tested | Second threshold tested | Label |
|---|---|---|---|---|
| Life Satisfaction | 0 to 4 | 0 to 5 | 0 to 6 | Low |
| Worthwhile | 0 to 4 | 0 to 5 | 0 to 6 | Low |
| Happiness | 0 to 4 | 0 to 5 | 0 to 6 | Low |
| Anxiety | 6 to 10 | 5 to 10 | 4 to 10 | High |
| Source: Office for National Statistics | ||||
Download this table Table 2: Testing of thresholds, UK
.xls (35.8 kB)Main findings from the threshold testing
The initial analysis considered change over time (year ending December 2012 to year ending December 2017). Increasing the threshold from 0 to 4 to 0 to 5 showed a similar pattern over time; however, increasing the threshold to 0 to 6 tended to present different results. This suggested that those reporting a score of 6 for life satisfaction, worthwhile and happiness are potentially a different group to those reporting 5 and below.
An increase in the sample size of the low well-being group could potentially allow us to carry out more robust analysis of this group, including comparisons between data points over time. To test this, the data were run on the current and proposed new thresholds: although the standard errors of the estimates increased, the relative standard errors, or coefficient of variations, decreased. The improved precision of the estimates would represent one advantage of widening the lowest threshold.
To further test the change in thresholds, it was investigated whether the same population demographics were captured by the different thresholds. The article What matters most to Personal Well-being? reported that the three most influential factors on our well-being are employment status, self-reported health and relationship status. Research has consistently shown that unemployment, poor health and being divorced or separated are all linked to poorer well-being. To investigate whether people who score 0 to 4, 5 and 6 had similar characteristics, these factors that are known to be important to personal well-being were considered.
The distributions of these three factors, as shown in Tables 3a and 3b, indicate that people who gave ratings of 0 to 4 had different characteristics than those who responded either 5 or 6. Those rating life satisfaction, worthwhile and happiness as 4 or below were more likely to have the characteristics and circumstances expected to be associated with poorer well-being than those rating their well-being as 5 or 6.
Table 3a shows the differences found in employment status. For example, those who were employed were 10 percentage points more likely to report 5 for their life satisfaction compared with 0 to 4 and 23 percentage points more likely to report 6 than 0 to 4. Similar differences also appeared when considering respondents self-reported health (as shown in Table 3b) and their relationship status.
Table 3a: Percentage of respondents rating their life satisfaction as 0 to 4, 5 and 6, UK
| Well-being Measure | Employment status | ||
|---|---|---|---|
| Life Satisfaction | In employment | ILO unemployed | Inactive |
| 0 to 4 | 36.3% | 7.3% | 56.4% |
| 5 | 46.7% | 5.8% | 47.5% |
| 6 | 58.9% | 5.4% | 35.7% |
| Source: Office for National Statistics | |||
Download this table Table 3a: Percentage of respondents rating their life satisfaction as 0 to 4, 5 and 6, UK
.xls (35.8 kB)
Table 3b: Percentage of respondents rating their life satisfaction as 0 to 4, 5 and 6 , UK
| Well-being Measure | Self-reported health | ||||
|---|---|---|---|---|---|
| Life Satisfaction | Very Good | Good | Fair | Bad | Very Bad |
| 0 to 4 | 10.6% | 22.1% | 27.3% | 26.0% | 14.0% |
| 5 | 16.1% | 32.6% | 31.2% | 15.9% | 4.2% |
| 6 | 22.3% | 39.7% | 27.5% | 8.6% | 2.0% |
| Source: Office for National Statistics | |||||
Download this table Table 3b: Percentage of respondents rating their life satisfaction as 0 to 4, 5 and 6 , UK
.xls (36.4 kB)These patterns are similar for life satisfaction, worthwhile and happiness. However, when considering anxiety there are not as many differences between those reporting 6 to 10 and 5; differences only start to emerge when increasing the threshold to 4 to 10.
Conclusions
Following this testing, it was concluded that the thresholds should be kept as they currently are until further work takes place, as there seem to be differences in the characteristics and circumstances of those reporting 0 to 4 for their personal well-being and those reporting 5 or 6.
Our initial analysis suggests that people rating life satisfaction, worthwhile and happiness as 4 or below on the scale are much more likely to have the characteristics and circumstances associated with poor well-being than those rating these aspects of well-being even one point higher (5 or above), who are rating their own well-being more positively.
While the definition of lowest well-being should not be overly narrow, it needs to be narrow enough to offer clear insights into the lives of those with the poorest well-being. This will enable clearer decision-making about what can be done to support them.
The research (see Measuring Well-being Inequality: working paper on the selection of a headline indicator for more information) clearly showed that stakeholders and those responding to the online survey were most interested in taking a progressive universalism approach to well-being. This means helping to ensure positive well-being for everyone, but prioritising the needs of those with the poorest well-being. This is another reason to clearly identify who has the poorest well-being and what characteristics and circumstances are associated with this.
Next steps
This year, ONS will be establishing a Centre of Expertise for Inequalities. The aim of this centre will be to ensure that the right data are available to address the main social and policy questions about fairness and equity in our society, that the relevant analysis is taken forward and that the most appropriate methods are used. This will involve partnerships across government, academia and other organisations to identify where better evidence is needed and to make better use of new and existing data sources.
As part of this, work is currently ongoing focussing on the lowest levels of personal well-being to help uncover the characteristics and circumstances of individuals or groups who report poor well-being. This project aims to help inform policy decisions and improve the well-being of the worst off in society. We will also explore whether those in the current “medium (5 to 6)” threshold might be “at risk” of poor well-being, for example, by monitoring the size of this group and possible transitions in and out of poor well-being.
If you have any comments or questions regarding this work, please contact us at: QualityOfLife@ons.gov.uk.
Nôl i'r tabl cynnwys8. Quality and methodology
The Personal well-being in the UK Quality and Methodology Information report contains important information on:
the strengths and limitations of the data and how it compares with related data
uses and users of the data
how the output was created
the quality of the output including the accuracy of the data
How we measure personal well-being
Since 2011, we have asked personal well-being questions to adults aged 16 and over in the UK to better understand how they feel about their lives. This release presents headline results for the year ending December 2017, along with changes over the last five years. It provides data at a national level and country level. The four personal well-being questions are:
Overall, how satisfied are you with your life nowadays?
Overall, to what extent do you feel the things you do in your life are worthwhile?
Overall, how happy did you feel yesterday?
Overall, how anxious did you feel yesterday?
People are asked to respond on a scale of 0 to 10, where 0 is “not at all” and 10 is “completely”. We produce estimates of the mean ratings for all four personal well-being questions, as well as their distributions (as shown in Table 1 in Section 7).
Please note that:
any changes mentioned in this publication are “statistically significant”
the statistical significance of differences noted within the release are determined based on non-overlapping confidence intervals
comparisons have been based on unrounded data
We are able to compare with the same period last year (January 2016 to December 2016) to identify any changes that may have occurred. However, we are not able to reliably compare with the preceding period (October 2016 to September 2017) as they include overlapping time periods that contain the same data.
For more information on personal well-being, please see:
Nôl i'r tabl cynnwys