Cynnwys
- Main points
- Summary
- Measuring personal well-being in the UK
- Personal well-being across UK countries
- Personal well-being in the English regions
- Personal well-being in local areas of the UK
- Uses of the data
- Methodology
- The Measuring National Well-being programme
- Further information
- References
- Background notes
1. Main points
Reported personal well-being has improved every year since financial year ending 2012 when data were first collected, suggesting that an increasing number of people in the UK are feeling positive about their lives
Proportions reporting the highest levels of personal well-being have increased since the financial year ending 2012 for each of the 4 measures considered. The greatest improvement has been for levels of anxiety
The proportion of people rating their well-being at the lowest levels for all 4 of the measures has reduced, but not as much as the proportion reporting high levels has grown
People in Northern Ireland gave higher average ratings for personal well-being for all measures except anxiety compared to the other 3 UK countries (based on figures before rounding). This has been the case in every year since data were first collected
People in London reported lower personal well-being on average for each of the measures than the equivalent UK averages, but London has seen improvements across all the average measures of personal well-being, particularly in reductions to anxiety since data were first collected
Since the financial year ending 2012, average ratings of personal well-being have improved significantly across all measures in the West Midlands. The region also had the lowest average anxiety rating of any English region in financial year ending 2015
Wales was the only UK country that did not have any significant positive improvements between the financial year ending 2014 and the latest estimates across any of the measures for average ratings
The North West of England reported increases in the rate of personal well-being for 3 out of 4 of the measures, compared with the financial year ending 2014
The North East and Yorkshire and The Humber were the only 2 English regions with no significant reductions in low levels of well-being across any of the personal well-being measures compared with the financial year ending 2014
2. Summary
Reported personal well-being has been improving every year since financial year ending 2012, when we started to collect the data across all 4 measures.
Comparing the average ratings for the financial year ending 2015 with the previous year for each of the 4 measures of personal well-being:
life satisfaction was 7.6 out of 10 (up 0.10 points)
feeling that what one does in life is worthwhile was 7.8 out of 10 (up 0.08 points)
happiness yesterday was 7.5 out of 10 (up 0.08 points)
anxiety yesterday was 2.9 out of 10 (down 0.07 points)
The year-on-year differences are small but statistically significant in each case. The proportion of people giving the highest ratings (scores of 9 or 10 out of 10 for life satisfaction, worthwhile and happiness, and 0 to 1 out of 10 for anxiety) for each measure of personal well-being also increased significantly in financial year ending 2015.
Additionally, the proportions of people reporting personal well-being at the lowest levels (scores of 0 to 4 for life satisfaction, worthwhile and happiness and ratings of 6 to 10 for anxiety) reduced, although the decreases in low well-being were small compared with the improvements in the highest ratings.
This is important because it indicates that while improvements are widespread across the population, they are uneven. The proportion reporting very high personal well-being is growing faster than the proportion reporting low levels is falling. This indicates increasing inequality in personal well-being.
Also released today, 23 September 2015:
Interactive maps for exploring the personal well-being estimates in local areas of the UK

Short story exploring personal well-being and tenure.
For more information on National Well-being please see National Well-being Interactive Wheel and Measuring National Well-being - Domains and Measures - September 2015 - September 2015 due to be published on 29th September 2015.
Nôl i'r tabl cynnwys3. Measuring personal well-being in the UK
This bulletin is published as part of our Measuring National Well-being programme. It presents annual estimates of personal well-being in different areas of the UK for the financial year ending 2015. It also compares the latest results to our previous personal well-being estimates covering the same periods in financial years ending 2014, 2013, and 2012 (ONS 2014a; ONS 2013a, ONS 2012). The latest estimates of personal well-being among people with different characteristics or circumstances are included in the reference tables with this release.
The personal well-being estimates in this bulletin are based on data from the Annual Population Survey (APS) with responses to the personal well-being questions from around 165,000 people. This provides a large representative sample of adults aged 16 and over living in residential households in the UK.
Personal well-being, people's thoughts and feelings about their own quality of life, is an important aspect of national well-being. It is part of a much wider initiative in the UK and internationally to look beyond Gross Domestic Product (GDP), and to measure what really matters to people. We regularly monitor 41 different headline measures in areas such as the natural environment, our relationships, health, what we do, where we live, personal finances, the economy, education and skills, governance and personal well-being to measure the progress and well-being of the nation. The latest updates to these headline measures will be available in Measuring National Wellbeing - Domains and Measures, released by the end of September 2015. Section 7 provides further information about how the well-being data are used.
The UK Statistics Authority has designated our personal well-being statistics as National Statistics, signifying compliance with the Code of Practice for Official Statistics.
This means that these statistics:
meet identified user needs
are well explained and readily accessible
are produced according to sound methods
are managed impartially and objectively in the public interest
It is a statutory requirement that the Code of Practice shall continue to be observed
3.1 How personal well-being is measured
We began measuring personal well-being in April 2011. Since then, the Annual Population Survey (APS) has included 4 questions which are used to monitor personal well-being in the UK:
Overall, how satisfied are you with your life nowadays?
Overall, to what extent do you feel the things you do in your life are worthwhile?
Overall, how happy did you feel yesterday?
Overall, how anxious did you feel yesterday?
People are asked to give their answers on a scale of 0 to 10, where 0 is “not at all” and 10 is “completely”. These questions allow people to make an assessment of their life overall, as well as providing an indication of their day-to-day emotions. Although “yesterday” may not be a typical day for an individual, the large sample means that these differences “average out” and provide a reliable assessment of the self-reported anxiety and happiness of the adult population in the UK over the year.
Since the introduction of these 4 questions they have been introduced in over 20 other surveys across government and numerous surveys in the academic, private and third sector.
It is important to remember that the findings presented are based on survey estimates and are subject to a degree of uncertainty. Therefore, they should be interpreted as providing a good estimate, rather than an exact measure of personal well-being in the UK. For more information about how the statistics are produced and implications for the accuracy of the estimates, see the Methodology section (section 8).
Differences in the personal well-being estimates over time are described only where they are statistically significant. That is where the change is not likely to be only due to variations in sampling, but to a real change over time. A 5% standard is used, which means that there is no more than a 5% chance that a difference will be classified as significant when in fact there is no underlying change. The country and regional estimates for financial year ending 2015 are compared to the equivalent estimates for the UK and discussed only where a statistically significant difference is found.
Figure 1: Distribution of personal well-being ratings, financial years ending 2012 to 2015 (1) - Life Satisfaction
United Kingdom
Source: Annual Population Survey (APS) - Office for National Statistics
Notes:
- Adults aged 16 and over were asked: "Overall, how satisfied are you with your life nowadays?" "Overall, to what extent do you feel the things you do in your life are worthwhile?" "Overall, how happy did you feel yesterday?" "Overall, how anxious did you feel yesterday?" Where 0 is "not at all" and 10 is "completely"
Download this chart Figure 1: Distribution of personal well-being ratings, financial years ending 2012 to 2015 (1) - Life Satisfaction
Image .csv .xls
Figure 1: Distribution of personal well-being ratings, financial years ending 2012 to 2015 (1) - Worthwhile
United Kingdom
Source: Annual Population Survey (APS) - Office for National Statistics
Notes:
- Adults aged 16 and over were asked: "Overall, how satisfied are you with your life nowadays?" "Overall, to what extent do you feel the things you do in your life are worthwhile?" "Overall, how happy did you feel yesterday?" "Overall, how anxious did you feel yesterday?" Where 0 is "not at all" and 10 is "completely"
Download this chart Figure 1: Distribution of personal well-being ratings, financial years ending 2012 to 2015 (1) - Worthwhile
Image .csv .xls
Figure 1: Distribution of personal well-being ratings, financial years ending 2012 to 2015 (1) - Happiness
United Kingdom
Source: Annual Population Survey (APS) - Office for National Statistics
Notes:
- Adults aged 16 and over were asked: "Overall, how satisfied are you with your life nowadays?" "Overall, to what extent do you feel the things you do in your life are worthwhile?" "Overall, how happy did you feel yesterday?" "Overall, how anxious did you feel yesterday?" Where 0 is "not at all" and 10 is "completely"
Download this chart Figure 1: Distribution of personal well-being ratings, financial years ending 2012 to 2015 (1) - Happiness
Image .csv .xls
Figure 1: Distribution of personal well-being ratings, financial years ending 2012 to 2015 (1) - Anxiety
United Kingdom
Source: Annual Population Survey (APS) - Office for National Statistics
Notes:
- Adults aged 16 and over were asked: "Overall, how satisfied are you with your life nowadays?" "Overall, to what extent do you feel the things you do in your life are worthwhile?" "Overall, how happy did you feel yesterday?" "Overall, how anxious did you feel yesterday?" Where 0 is "not at all" and 10 is "completely"
Download this chart Figure 1: Distribution of personal well-being ratings, financial years ending 2012 to 2015 (1) - Anxiety
Image .csv .xlsPeople in the UK tend to rate their life satisfaction, feeling that what they do in life is worthwhile and happiness at the high end of the scale. This indicates that people tend to answer towards the end of the 0-10 scale for these measures. People most commonly rated each of these questions at 8 out of 10. A higher proportion rated their life satisfaction and feelings that what they do in life are worthwhile at 8 out of 10 (just over 30% in each case) than rated their happiness levels this way (just under 25%).
The pattern for how people rate their anxiety is different to the other questions. For the anxiety question the scale is reversed as a score of 10 out of 10 indicates the highest possible anxiety, and a score of 0 out of 10 indicates the lowest possible anxiety. Compared to the other 3 measures, a much higher proportion of people rate their anxiety at the lower end of the scale (as 0 or 1), but more also rate their anxiety levels in the middle of the scale (as 5 out of 10). In each year, the majority of people rated their anxiety at a low level between 0 and 3. The most common response was 0 out of 10, which indicates that they felt “not at all anxious” on the previous day.
This pattern of personal well-being ratings in the UK has been fairly consistent for each of the 4 years with small (but statistically significant) increases emerging year-on-year.
3.3 Average ratings of personal well-being in the UK
Average ratings of personal well-being are a simple way to make comparisons over time. The average ratings for each of the 4 measures of personal well-being in the financial year ending 2015 compared with the previous year:
life satisfaction was 7.6 points out of 10 (up 0.10 points)
feeling that what one does in life is worthwhile was 7.8 out of 10 for (up 0.08 points)
happiness yesterday was 7.5 out of 10 (up 0.08 points)
anxiety yesterday was 2.9 out of 10 (down 0.07 points)
The latest estimates suggest improvement in the past year in the average ratings of personal well-being in the UK across all of the measures. The year-on-year differences are small but statistically significant in each case.
Comparing the latest average estimates with those from financial year ending 2012, there have also been small but significant improvements in personal well-being across all 4 measures (as shown in Figure 2).
Figure 2: Change in average annual UK personal well-being ratings between the financial year ending 2012 and 2015
United Kingdom

Source: Annual Population Survey (APS) - Office for National Statistics
Notes:
- * Indicates a statistically significant difference from 2011/12 at the 0.05 level
- + Indicates a statistically significant difference from 2012/13 at the 0.05 level
- ~ Indicates a statistically significant difference from 2013/14 at the 0.05 level
The continued significant improvements in the UK are interesting, especially when viewed in the context of Eurobarometer estimates for the UK for life satisfaction which have shown proportions with high life satisfaction to be broadly stable over 35 years but with similar increases in recent years (Cabinet Office, 2014).
3.4 Highest and lowest personal well-being in the UK
Average ratings of personal well-being provide a useful summary, but do not tell the whole story. An important consideration is whether the proportions of people in the UK who rated their personal well-being at the highest and lowest levels in financial year ending 2015, compared to financial year ending 2014, and financial year ending 2012 has changed over time. This helps us to see whether the overall improvement in average personal well-being has resulted from increases in people reporting personal well-being at the highest levels, and/or reductions in the proportions of people reporting personal well-being at the lowest levels. In other words, this helps us to understand if improvements in personal well-being are a result of raising the ceiling and or lifting the floor. This is important as it has implications for how equal the distribution of personal well-being is in society.
3.4.1 Measuring “highest” and “lowest” personal well-being
The highest levels of personal well-being for life satisfaction, worthwhile and happiness are defined as ratings of 9 or 10. For reported anxiety, ratings of 0 or 1 are used, because lower levels of anxiety suggest better personal well-being. On the other hand, lowest levels of personal well-being are defined as ratings of 0 to 4 for life satisfaction, worthwhile and happiness. For reported anxiety, ratings of 6 to 10 are used, because higher levels of anxiety suggest lower personal well-being. It is particularly important to look at concentrations of low levels of personal well-being over time so that policy makers can target and measure interventions designed to reduce the proportions of people with low levels of personal well-being.
3.4.2 Highest and lowest personal well-being in the UK, financial year ending 2015
Figure 3 shows the percentages of people in the UK reporting the highest and lowest levels of well-being in financial year ending 2015 and how this has changed since financial year ending 2012.
The reported highest and lowest well-being for financial year ending 2015:
28.8% rated their life satisfaction at the highest levels compared to 4.8% at the lowest
34.4% rated their sense that what they do in life is worthwhile at the highest levels, compared to 3.8% at the lowest
34.1% rated their happiness at the highest levels, while 8.9% rated their happiness at the lowest
40.9% rated their anxiety at the lowest levels, while 19.4% rated it at the highest levels
Figure 3: Percentages rating personal well-being at highest and lowest levels, financial years ending 2012 to 2015
United Kingdom

Source: Annual Population Survey (APS) - Office for National Statistics
3.4.3 Changes over time in highest and lowest personal well-being in the UK
The proportion of people giving the highest ratings for each aspect of personal well-being increased significantly in financial year ending 2015 compared to the previous year. The biggest changes in percentage points were for life satisfaction (up 2.0) and worthwhile (up 1.9) .This suggests that more people in the UK are feeling positive about their lives, and is consistent with the higher average ratings of personal well-being noted in the previous section.
This positive picture is also reflected in significant decreases in the proportions of people reporting low well-being across all 4 measures between financial year ending 2015 and the previous year, although the changes are smaller than for the increases in the proportions of people giving the highest ratings.
Looking at how ratings have changed over the 4 year period, there have been statistically significant gains in the proportions of people reporting very high personal well-being for each of the 4 measures in financial year ending 2015 compared to financial year ending 2012, particularly for improvements in low levels of anxiety.
3.5 Possible reasons for the personal well-being patterns observed in the UK
The latest picture of personal well-being, similar to findings last year, is of more positive well-being across all of the 4 measures in financial year ending 2015 compared to both financial year ending 2014 and financial year ending 2012, when we started to collect personal well-being data. This improvement appears to have resulted more from the proportions of people reporting the highest levels of personal well-being growing, than by reductions in people reporting low levels of personal well-being. This is important as it has implications for how equal the distribution of personal well-being in society is, and suggests growing inequality in reported personal well-being.
This is only the fourth year we have collected personal well-being data, so it is too early to identify definite trends over time. However, one reason for the overall small improvement in personal well-being over the past year may be the economic outlook in financial year ending 2015 compared with financial year ending 2014. ONS economic data shows that unemployment has been on a downwards trend since the beginning of 2013 and fell to 5.5% in the 3 months to March 2015 (ONS 2015a). Our research (ONS 2013b) and academic sources (Blanchflower et al, 2013) has shown that unemployment has a negative effect on personal well-being, therefore this finding is to be expected.
Additionally, research into personal well-being has found that “periods of rapid change...are often associated with drops in happiness” (Graham et al., 2015). It could be that the rapid changes that occurred with the economic downturn in 2008 - 2009 were being felt more strongly in financial year ending 2012, and the greater stability in financial year ending 2015 could be one of the reasons for an improvement in personal well-being over this period. Looking at the 4 measures since financial year ending 2012, the biggest improvement has been for anxiety. However, as personal well-being data was not collected prior to the economic downturn it is not possible to determine with accuracy the effect of the downturn on personal well-being measures.
Looking at the 4 countries of the UK (see section 4) and English regions (see section 5), we can see that not all countries and regions are seeing the positive improvements to personal well-being at the same rate, and some areas have improved more than others. For example, Wales was the only UK country that did not have any significant positive improvements in average personal well-being between financial years ending 2014 and 2015 across any of the measures.
In some English regions the proportion of people reporting very low well-being remained largely static between financial years ending 2014 and 2015. For example, the North East and Yorkshire and The Humber were the only 2 English regions with no significant improvement in low levels of well-being across 2 out of the 4 measures (see section 5.4).
One possible reason for the slower improvement in personal well-being for some areas could be differing economic situations, for example, from February to April 2015 unemployment in the UK was highest in the North East at 7.4%, and second highest in Yorkshire and The Humber at 6.9% (ONS, 2015b).
The North West was the English region that had the largest average improvements for life satisfaction, worthwhile and happiness when comparing financial year ending 2015 and financial year ending 2014. During the financial year ending 2015 there has been discussion about the ‘Northern Powerhouse’ proposal to boost economic growth in the North of England. It could be that this proposal has contributed to a feeling of optimism in the North West.
The West Midlands had the largest average improvements in average life satisfaction, worthwhile and happiness between financial year ending 2012 and financial year ending 2015. The West Midlands had the third largest percentage point decrease in the unemployment rate (those aged 16 and over) between financial years ending 2012 and 2015 compared to the other English regions (ONS 2015c). HMRC data shows that the West Midlands was the region with the largest increase in the value of exports between the first quarter of 2012 and the first quarter of 2015 (HMRC 2015) which as well as potentially contributing to reducing unemployment, may have contributed to improved feelings of optimism.
Between the financial years ending 2012 and 2015 average reported anxiety levels have decreased the most in London, although London, jointly with the North East, still has the highest reported average anxiety of all the English regions and countries of the UK.
Nôl i'r tabl cynnwys4. Personal well-being across UK countries
This section examines the latest findings on personal well-being across UK countries.
4.1 Average reported personal well-being in UK countries
Figure 4 shows the latest average ratings of personal well-being across the UK countries and how they compare to the UK averages.
In financial year ending 2015:
Northern Ireland had the highest average reported rating for life satisfaction in the UK (7.9 out of 10), and was the only country to be significantly higher than the UK average
Wales was the only country to have reported significantly lower life satisfaction than the UK as a whole (7.55 compared with 7.61)1
Northern Ireland was the only country where reported average ratings for worthwhile (8.1), were significantly above the UK average; Wales was the only country where average reporting ratings for worthwhile were significantly below UK average (UK 7.82, Wales 7.77)1
Northern Ireland had highest average reported happiness (7.8), and again, was the only country where this measure was significantly higher than the UK average
average reported anxiety in England and Wales was the same as the UK average at 2.9, both Scotland and Northern Ireland had slightly lower average anxiety at 2.8; although none of the 4 countries had a significantly different average anxiety compared to the UK as a whole
Northern Ireland had the highest reported personal well-being for 3 out of the 4 measures; Wales had the lowest reported average for 3 out of the 4 measures
Figure 4: Average personal well-being ratings compared to UK averages: by country, financial year ending 2015
United Kingdom

Source: Annual Population Survey (APS) - Office for National Statistics
Notes:
- * Indicates a statistically significant difference determined on the basis of non-overlapping confidence intervals
4.2 Changes over time in average reported personal well-being in the UK countries
When comparing the latest average estimates for each country to the previous year’s estimates, as shown in Figure 5, important points include:
England, Scotland and Northern Ireland all had significant improvements in the average estimates for life satisfaction
England and Scotland had significant improvements in ratings for the things that we do in life being worthwhile and for happiness
England was the only country with significant reductions in anxiety levels
Wales was the only country that did not have any significant positive improvements between financial year ending 2015 and the previous year across any of the measures
The average ratings of personal well-being in Wales did not improve between financial year ending 2014 and financial year ending 2015. However, Wales reported the greatest improvements across the UK in the preceding period, financial year ending 2013 to financial year ending 2014, for all personal well-being measures except anxiety.
Since financial year ending 2012, when we first collected the personal well-being data, there have been statistically significant improvements across all of the measures and in each of the UK countries. This is to be expected given the overall improvement in personal well-being for the UK as a whole during this period.
Figure 5: Annual change in average UK personal well-being ratings compared from the financial year ending 2012, by country
United Kingdom

Source: Annual Population Survey (APS) - Office for National Statistics
Notes:
- * Indicates a statistically significant difference from 2011/12 at the 0.05 level
- + Indicates a statistically significant difference from 2012/13 at the 0.05 level
- ~ Indicates a statistically significant difference from 2013/14 at the 0.05 level
4.3 Highest and lowest ratings of personal well-being across UK countries
This section provides the latest estimates of the proportions of people in each country reporting the highest and lowest levels of personal well-being.
Concentrations of highest well-being across the UK countries in the financial year ending 2015:
in financial year ending 2015, England, Scotland and Wales all had similar proportions of people reporting the highest levels of life satisfaction, and happiness
England and Wales had similar proportions of people reporting a very high sense that the things that they do in their lives are worthwhile, while Scotland had a significantly lower score than the equivalent proportion for the UK as a whole
Northern Ireland had the highest percentages of people rating their life satisfaction, sense that the things they do in their lives are worthwhile and happiness as very high; it was the only country that had significantly higher proportions to the equivalent proportion for the UK for life satisfaction, worthwhile and happiness, for example, 45.0% of people in Northern Ireland rated the things they do in life as worthwhile as a 9 or 10, compared to 34.4% in the UK as a whole
Concentrations of lowest well-being across the UK countries in the financial year ending 2015:
- Wales was the only country with significantly higher proportions of people with lower life satisfaction, lower sense that the things they do in their lives are worthwhile as well as higher proportions of people reporting high levels of anxiety compared to the UK average
4.4 Changes over time in highest and lowest personal well-being across the UK countries
Comparing the latest estimates of highest well-being for each country to the financial year ending 2014 estimates:
all countries, except Scotland, had significant increases in the proportions of people reporting very high life satisfaction
England and Scotland had significant increases in the proportions of people reporting a very high sense that the things that they do in life are worthwhile
England and Scotland had significant increases in the proportions of people reporting very high happiness
England was the only country that had an increase in the proportions of people reporting very low anxiety compared with financial year ending 2014
Comparing the latest estimates of lowest well-being for each country to the financial year ending 2014 estimates:
For England and Northern Ireland the proportions of people reporting very low life satisfaction between financial year ending 2014 and financial year ending 2015 had significantly reduced
England was the only country which had a significant reduction in the lowest ratings for people’s sense that the things we do in life are worthwhile, happiness, and anxiety
This is interesting as it suggests that the improvements in average scores, particularly for Scotland and Wales, have resulted more from an increase in people reporting very high personal well-being, than by a decrease in people reporting low well-being.
Since financial year ending 2012, when we first collected well-being data, there have been changes in the lowest and highest personal well-being ratings in each UK country (as shown in Figure 6). These changes include:
England, Wales and Northern Ireland all had significant improvements in the proportions of people reporting very high life satisfaction
all countries, except Wales, had a significant improvement in the proportions of people rating the things that they do in life are worthwhile as very high
all countries had significant improvements in the proportions of people reporting very high happiness and very low anxiety
Changes in the proportions of people reporting lowest well-being since the financial year ending in 2012:
the proportions of people rating life satisfaction and happiness as very low had significantly reduced in all 4 countries
the proportions of people reporting that their sense that the things they do in life are worthwhile at the lowest levels significantly reduced for all countries except Wales
the proportions of people reporting very high anxiety significantly reduced for all countries except Northern Ireland, however, it should be noted that Northern Ireland has had the lowest proportions of people reporting high anxiety for each year since financial year ending 2012 compared to England, Scotland and Wales
Figure 6: Percentages rating personal well-being at highest and lowest levels, by country
Comparing the financial year ending 2012 and the financial year ending 2015, United Kingdom

Source: Annual Population Survey (APS) - Office for National Statistics
Notes for Personal well-being across UK countries
- displayed to 2 decimal places to show difference
5. Personal well-being in the English regions
This section focuses on personal well-being across the English regions in financial year ending 2015 and changes over time. Our previous analysis (ONS 2013c) found that a range of characteristics relating to individuals and where they live, the region where they live in, and whether they live in an urban or rural area are related to personal well-being. However, the effect is not as strong as other aspects of life, such as employment situation or health, for example. As the differences between regions may not be statistically significant, comparisons are made between each region and the equivalent UK figure. They are commented on only where there is a statistically significant difference between the regional and the UK figure (the Methodology section has more information).
As discussed in section 3.5 not all English regions are seeing the positive improvements to personal well-being at the same rate, and some areas have improved more than others.
5.1 Average personal well-being ratings in the English regions
The average reported ratings across the regions for each measure of personal well-being in financial year ending 2015 are shown in Figure 7, as well as how they compare to the UK averages. Regions where reported average ratings were significantly above the UK averages include:
the South West and South East reported significantly higher average ratings of life satisfaction (both 7.7), additionally the South East was the only English region which reported significantly higher sense that things they do in life are worthwhile (7.9) and happiness (7.5)
the West Midlands was the region with the lowest levels of reported average anxiety (2.6)
Regions where average ratings were significantly below the UK averages include:
London and Yorkshire and The Humber had the lowest reported life satisfaction (7.5), London was among the lowest for people reporting a low sense that things we do in life are worthwhile, along with the North East (7.7)
the North East, North West and London reported significantly lower happiness ratings than the UK average
the North East, London, and Yorkshire and The Humber reported significantly higher anxiety levels
Figure 7: Average personal well-being ratings compared to UK averages: by English region, financial year ending 2015
United Kingdom

Source: Annual Population Survey (APS) - Office for National Statistics
Notes:
- * Indicates a statistically significant difference determined on the basis of non-overlapping confidence intervals
5.2 Changes over time in average personal well-being ratings in the English regions
Comparing the latest average estimates for each region to the financial year ending 2014 estimates:
the North West had the biggest reported improvement for average life satisfaction, worthwhile and happiness
all regions except Yorkshire and The Humber had a significant improvement in average life satisfaction ratings
all regions except the North East, East Midlands and the West Midlands had significantly improved average ratings for the things we do in life being worthwhile
for average happiness the picture was more mixed with 5 out of the 9 English regions reported a significant improvement in happiness levels including: the North West, East Midlands, East of England, South East and South West; there was no significant improvements for London, the West Midlands, Yorkshire and The Humber and the North East
only the East of England and London reported significant reductions in average ratings for anxiety; London had the largest reduction, although it has one of the highest average anxiety levels overall
The only 4 regions where positive changes were not seen for at least 2 out of the 4 measures were the North East, West Midlands, East Midlands and Yorkshire and The Humber.
Since financial year ending 2012, when we first collected these data, all of the English regions have reported significant increases in life satisfaction, happiness and worthwhile, and reductions in average anxiety. This is to be expected given the overall improvement in personal well-being in the UK as a whole. The region which has seen the biggest average improvement for life satisfaction, worthwhile and happiness was the West Midlands. People in London reported the biggest reduction in average anxiety levels over this period.
Figure 8: Annual change in annual average personal well-being ratings, by region, between the financial years ending 2012 and 2015
United Kingdom

Source: Annual Population Survey (APS) - Office for National Statistics
Notes:
- * Indicates a statistically significant difference from 2011/12 at the 0.05 level
- + Indicates a statistically significant difference from 2012/13 at the 0.05 level
- ~ Indicates a statistically significant difference from 2013/14 at the 0.05 level
5.3 Highest and lowest personal well-being in the English regions in the financial year ending 2015
This section considers whether the highest and lowest reported personal well-being is spread evenly across the regions or whether highest and lowest well-being are concentrated in certain areas. The percentages of people in each region reporting the highest well-being in financial year ending 2015 is shown in Map 1 and the lowest reported well-being shown in Map 2. These maps also show the direction of changes in the estimates since financial year ending 2012.
The concentrations of highest levels of reported personal well-being across the English regions, compared the UK as a whole, are:
the South East was the only region with a significantly higher proportion of people reporting very high life satisfaction compared to the UK
the North West and Yorkshire and The Humber had a significantly higher proportion of people reporting a very high sense that the things that they do in their lives are worthwhile compared to the UK as a whole
only the East Midlands had a significantly higher proportion of people reporting very high happiness compared to the UK as a whole
the East Midlands and West Midlands were the only 2 regions that reported statistically significantly higher proportions of people reporting low anxiety
This also shows that the patterns of high well-being across the UK differ for each of the 4 measures.
Map 1: Percentages rating personal well-being at highest levels: by English region for financial year ending 2015 and change since financial year ending 2012

Source: Annual Population Survey (APS) - Office for National Statistics
Notes:
- Adults aged 16 and over were asked: "Overall, how satisfied are you with your life nowadays?" "Overall, to what extent do you feel the things you do in your life are worthwhile?" "Overall, how happy did you feel yesterday?" "Overall, how anxious did you feel yesterday?" Where 0 is "not at all" and 10 is "completely"
The concentrations of the lowest levels of reported personal well-being across the English regions, compared to the UK as a whole, are:
the North East, North West and Yorkshire and The Humber all had significantly greater proportions of people reporting very low life satisfaction, happiness and high anxiety, only the South East had a significantly lower proportion of people reporting very low life satisfaction and happiness
the North East and North West also had greater proportions of people reporting low ratings for sense that what they do in life is worthwhile, while again the South East and also the East of England had lower proportions of people reporting low worthwhile compared to the UK as a whole
only the West Midlands had a significantly lower proportion of people reporting high anxiety compared to the UK figure
Map 2: Percentages rating personal well-being at lowest levels: by English region financial year ending 2015 and change since financial year ending 2012

Source: Annual Population Survey (APS) - Office for National Statistics
Notes:
- Adults aged 16 and over were asked: "Overall, how satisfied are you with your life nowadays?" "Overall, to what extent do you feel the things you do in your life are worthwhile?" "Overall, how happy did you feel yesterday?" "Overall, how anxious did you feel yesterday?" Where 0 is "not at all" and 10 is "completely"
5.4 Changes over time in highest and lowest personal well-being in the regions
Comparing the concentrations of highest reported personal well-being in the regions compared to financial year ending 2014:
the regions with the largest growth in the proportion of people reporting well-being at the highest levels were: the East of England and the South East for life satisfaction, the North West, Yorkshire and The Humber and the South East for worthwhile
for high levels of happiness the regions with the largest growth in the proportion of people reporting high levels of happiness since financial year ending 2014 were the North West and the East Midlands
the regions that reported the biggest improvements in reported low levels of anxiety were the East Midlands and London; note that London is the region that, jointly with the North East, reported the highest average anxiety in the financial year ending 2015
Comparing the concentrations of lowest reported personal well-being to those of financial year ending 2014:
the proportions of people reporting low levels of life satisfaction significantly reduced for all regions except for the North East, Yorkshire and The Humber and the East of England
for the other measures of personal well-being there were only a few regions which had significant reductions in the proportions of people reporting very low well-being: for worthwhile the only region that had a significant reduction was the North West
for happiness, the only 2 regions with significant reported reductions were the West Midlands and London
for anxiety, the only significant reported reductions in the proportions of people reporting high anxiety were the East of England and London
the North East and Yorkshire and The Humber were the only 2 English regions with no significant reported improvement in low levels of well-being across all 4 of the measures
It is important to look at concentrations of low levels of personal well-being over time so that policy makers can target and measure interventions designed to improve personal well-being for these groups.
There has been a greater improvement in the proportions of people reporting high well-being than reductions in people reporting well-being at the lowest levels. This reflects the pattern for the UK as a whole, as well as for the 4 UK countries.
Since financial year ending 2012, when we first collected these data, changes in concentrations of highest reported personal well-being across the regions, as shown in Map 1, include:
significant increases in the proportions of people reporting very high life satisfaction for all regions apart from the North East and the South West
significant increases in the proportions of people reporting very high sense that the things they do in life are worthwhile across all regions except for the East Midlands
significant increases in the proportions of people reporting low anxiety for all regions
Of the 4 measures, anxiety is the one that has seen the most positive improvement. This could be due to greater stability in the UK economy compared to financial year ending 2012, which may have affected people’s anxiety levels more than the other measures of personal well-being.
Since financial year ending 2012, when we first collected the data, changes in concentrations of lowest reported personal well-being across the regions, as shown in Map 2 include:
significant reductions in the proportions of people reporting low life satisfaction in all English regions except the North East
significant reductions in the proportions of people reporting a low sense that the things they do in life are worthwhile except in the North East, Yorkshire and The Humber and the South West
significant reductions in the proportions of people reporting low levels of happiness in all regions
significant reductions in the proportions of people reporting high anxiety in all regions except the North East and Yorkshire and The Humber
This is to be expected given the general improvements in personal well-being in the UK as a whole during this period; however, as was found in for the 4 countries of the UK, the gains in personal well-being are greater in some areas than others.
5.5 Summary of Personal Well-being in English Regions
5.5.1 Summary of Personal Well-being in the English Regions in financial year ending 2015
The South East was one of the regions with highest personal well-being, including the highest average reported life satisfaction and worthwhile, but also for the proportions of people reporting life satisfaction at the highest levels, and was the region with the highest average reported happiness.
In terms of reported anxiety, the pattern of reporting was different in the English regions compared to the other 3 measures. For example, the West Midlands was the region with the lowest average anxiety and the lowest proportions of people reporting high anxiety, but was not among the regions with the highest reported life satisfaction, sense that the things we do in life are worthwhile or happiness. This shows that it is important to capture personal well-being for all 4 measures as they capture different aspects of personal well-being.
Regions that reported 2 or more below average/low levels personal well-being across all the measures were the North East, North West, London, and Yorkshire and The Humber.
5.5.2 Summary comparison of Personal Well-being change in the English Regions between financial years ending 2014 and 2015
For change in average ratings, only the North East, West Midlands, East Midlands and Yorkshire and The Humber did not report significant improvements for at least 2 out of the 4 measures. The North East and Yorkshire and The Humber were the only 2 English regions with no significant improvement in low levels of well-being across all 4 of the measures.
The regions with the largest growth in the proportions of people reporting well-being at the highest levels were: the East of England and South East for life satisfaction, the North West, Yorkshire and The Humber and South East for worthwhile. For high levels of happiness the biggest growth in proportions were the North West and East Midlands. For anxiety the regions that reported the biggest improvements in those reporting low levels of anxiety were the East Midlands and London. This is interesting as London was one of the regions which had the highest average anxiety reported for the financial year ending 2015, and with the lowest proportions of people reporting low levels of anxiety.
Both average levels in reported personal well-being and proportions of people reporting low levels of personal well-being have remained static in some regions, despite overall improvements for the UK as a whole.
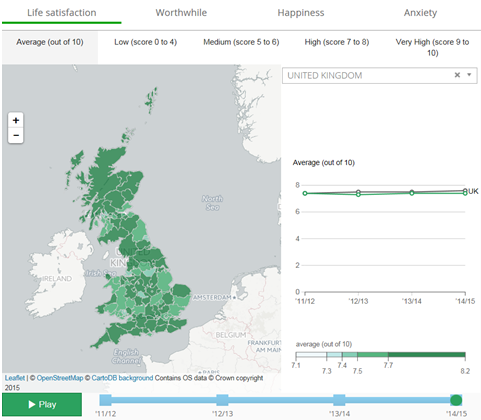
Nôl i'r tabl cynnwys6. Personal well-being in local areas of the UK
For more local areas of the UK, the personal well-being estimates are available as interactive maps, which can be explored in a variety of ways, and in the reference tables accompanying this bulletin. The personal well-being estimates have been published for the following administrative areas in England, Scotland, Wales and Northern Ireland in the reference tables:
unitary authorities or counties in England
local authority districts in England
unitary authorities in Wales
local authorities in Scotland
local government districts in Northern Ireland
We have also published further analysis looking at how personal well-being differs according to the characteristics of areas and the people living there (ONS, 2013b; ONS, 2014b). In 2014 we released the first combined 3 years of personal well-being data (ONS, 2015d). We will publish a rolling combined 3 year personal well-being dataset annually. This is designed to provide larger sample sizes and more robust analysis of personal well-being in local areas and among smaller population subgroups.
We would welcome feedback on this bulletin, particularly how the data are used.
Please contact us via email at: personal.well-being@ons.gov.uk or telephone Lucy Tinkler 01633 455713.
Nôl i'r tabl cynnwys7. Uses of the data
The personal well-being statistics are used to inform decision making among policy-makers, individuals, communities, businesses and civil society. They complement other traditional measures of progress and quality of life, such as unemployment and household income. We use the personal well-being estimates as part of a wider programme to monitor and understand UK national well-being over time and in comparison to other countries.
One of the main benefits of collecting personal well-being data is that people are able to give their views about each aspect of their well-being. Without it, assumptions must be made about how objective conditions, such as people’s health and income, might influence their individual well-being. However, personal well-being measures are grounded in individuals’ preferences and take account of what matters most to them by allowing them to decide what is important when providing an assessment of their own quality of life.
The uses of personal well-being data are varied, but the 4 main uses are:
overall monitoring of national well-being
use in the policy making process
international comparisons
public decision making
7.1 Overall monitoring of national well-being
Collected regularly, personal well-being data can provide an indication of how the well-being of a nation is changing. To get a full picture of national well-being we believe it is important to use this information to supplement existing objective information. After extensive public consultation we have identified different aspects (or domains) of well-being that sit alongside the personal well-being domain. These include:
health
our relationships
what we do
where we live
personal finance
education and skills
the economy
the environment
governance
The National Well-being wheel of measures includes indicators for all these.
7.2 Use in policy making
Personal well-being data, within the framework of wider measures of national well-being, focuses on how people think and feel about their lives. This is an important addition to official statistics, helping policy makers understand how their decisions may affect people’s quality of life. Personal well-being data is increasingly being used both in the UK and internationally in the development and evaluation of policies and services. These include:
in 2015 the airports commission assessed personal well-being around airports to inform it’s recommendations on airport expansion;
the Cabinet Office has recently released results analysing personal well-being in areas where social action projects have been running
the What Works Centre for Well-being released personal well-being results by occupation and this is being used to develop a new careers application for young people
the Behavioral Insights Team recently evaluated the personal well-being of young people participating in Youth Social Action trials compared to control groups
The What Works Centre for Well-being was launched in October 2014. They aim to encourage greater use of well-being data among decision makers by making it easy to understand and use in practical ways
7.2.1 Identifying need and targeting policies
The large sample size of the Annual Population Survey (APS) Personal Well-being dataset allows for comparisons between different groups of the population (for example, different age groups or different ethnic groups) and between different areas in the UK (for example, countries, regions and local authority districts). This can help policy-makers target policy at the groups or areas with highest need in terms of personal well-being.
Analysis can also be carried out to look at how different circumstances relate to personal well-being and which are most strongly associated with it. This can help to identify which policies could be most effective in improving personal well-being. In May 2013 we published analysis looking at What matters most to personal well-being? (ONS, 2013b) which identified health, relationship status and employment status as the factors most highly associated with personal well-being in the APS. Our recent publications have also looked at relationships between commuting and personal well-being (ONS, 2014c), household income and expenditure (ONS, 2014d), and aspects of where we live (ONS, 2014b).
7.2.2 Policy appraisal
Another use is in cost-benefit analysis for policy appraisal. Personal well-being estimates can provide an alternative method to value the costs and benefits of different policies. This process could also help inform decisions about what forms of spending will lead to the largest increases in personal well-being (Dolan et al, 2011 (99.8 Kb Pdf)).
The Green Book is HM Treasury's guide for government departments on the appraisal of the costs and benefits of projects through social cost-benefit analysis. A Green Book discussion paper (Fujiwara and Campbell, 2011), produced jointly by HM Treasury and the Department for Work and Pensions, looks at the potential uses of personal well-being measures in social cost-benefit analysis. Another recent example of the use of personal well-being data in this area has been to produce a method for the monetary valuation of volunteering (Fujiwara et al, 2013).
7.2.3 Examples of use of personal well-being data for policy evaluation and monitoring
Personal well-being data are increasingly being used to evaluate and monitor the effectiveness of policy interventions in the UK. A recent example is the National Citizen Service, the reported personal well-being of young people before and after their participation in the service was evaluated. The results compared people’s reported personal well-being before and after participation in the programme and found statistically significant increases. The well-being of participants’ also improved compared to a control group of similar people who had not participated in the programme. As well as government interventions, other civil society and third sector interventions could be evaluated in a similar way. Added to this, looking at policies through a “well-being lens” and using data to inform, not only the formulation of policy, but also how policy could be better implemented with people’s well-being in mind is also important. The Social Impacts Taskforce (SITF), comprising of senior analysts from across government, has been working to make use of personal well-being data and share approaches and findings across government. The Cabinet Office has also convened a cross-Whitehall steering group of senior policy makers to encourage the consideration of well-being in policy.
Separate initiatives to investigate well-being are being undertaken by the devolved governments. These include: the National Performance Framework, which forms part of the “Scotland performs” initiative and the recently published Analysis of subjective well-being in Wales: Evidence from the Annual Population Survey. These initiatives reflect the specific needs of the countries they represent.
Most UK government departments are actively engaged in well-being research in some way, particularly analysis of personal well-being data. This explores how people’s ratings of their personal well-being are associated with particular policy areas including housing, crime, adult learning, sport, culture, volunteering and health.
Further information, including examples of how personal well-being data are being used in the policy process, is available in recent government evidence submitted by the Cabinet Office to the UK Parliament’s Environmental Audit Committee as part of their inquiry on well-being,
Well-being Policy and Analysis is also available; this report provides updated information about well-being work across Whitehall (including use of our personal well-being questions and data in evaluations, surveys and specialised data exploration tools).
7.3 International developments to monitor well-being
The benefit of understanding where the UK is placed compared to other nations is another important reason for the collection of personal well-being data. There are increasing calls from international organisations, such as Eurostat (the Statistical Office of the European Union) and the Organisation for Economic Cooperation and Development (OECD), to develop national personal well-being estimates and increasing recognition internationally that this should be included in official data collection. Eurostat (the Statistical Office of the European Union) have started to collect personal well-being statistics from member states as part of the European Statistics on Income and Living Conditions (EU-SILC) in an ad-hoc well-being module in 2013. Eurostat’s Quality of Life Indicators, currently being developed, will also include personal well-being information to supplement objective information already collected across Europe.
The OECD has also published guidance on the measurement of subjective well-being, which we have contributed to (OECD, 2013).
Nôl i'r tabl cynnwys8. Methodology
8.1 The APS Personal Well-being dataset
The data analysed in this bulletin are from the Annual Population Survey (APS) Personal Well-being dataset, covering the period April 2014 to March 2015. ONS will release a new annual APS Personal Well-being dataset every year, soon after the publication of the latest Personal Well-being in the UK statistical bulletin in September. The dataset includes responses to the four ONS personal well-being questions as well as a range of other variables useful for the analysis of personal well-being. Also, special weighting is included in the dataset to make the data representative of the UK population. The weighting also adjusts for the fact that each respondent must answer the questions for themselves, with no one else in the household allowed to answer on their behalf. Estimates for 2014/15 have been weighted using population totals from the 2011 census. Estimates from previous years were weighted to population totals from the 2001 census. This difference may impact estimates but it is impossible to quantify and is likely to be small.
Since 2012, the annual version of the APS Personal Well-being dataset has been archived so that approved researchers can use the data for their own analysis. Further details of how researchers can access the data are available from our Frequently Asked Questions page or by contacting the Personal Well-being Team: personal.well-being@ons.gov.uk.
8.2 The ONS personal well-being questions and their development
The ONS personal well-being questions were developed as part of the Measuring National Well-being Programme. ONS sought advice from experts working in the field of subjective well-being (see Dolan et al, 2011 (99.8 Kb Pdf)) and consulted with specialists on the National Statistician’s Measuring National Well-being Advisory Forum and Technical Advisory Group. Based on this, as well as extensive question testing, four questions were designed. They provide a concise and balanced approach to the measurement of subjective well-being, drawing on three main theoretical approaches (Dolan et al, 2011 (99.8 Kb Pdf), ONS, 2011a (240.8 Kb Pdf)). These include:
the ‘evaluative’ approach which asks people to reflect on their life and assess how it is going overall in terms of their satisfaction with life;
the ‘eudemonic’ approach which asks people to consider the extent to which they feel a sense of meaning and purpose in life;
the ‘experience’ approach which ask about people’s positive and negative experiences and emotions over a short period of time to assess these aspects of personal well-being on a day-to-day basis
ONS conducted focus groups with members of the public in 2013, and found that ‘personal well-being’ is clearer and simpler for people to understand than ‘subjective well-being’. Since then, both the questions and estimates have been referred to as ‘personal well-being’.
The following are the ONS personal well-being questions that have been included on the Annual Population Survey each year since 2011:
overall, how satisfied are you with your life nowadays? (evaluative approach)
overall, to what extent do you feel the things you do in your life are worthwhile? (eudemonic approach)
overall, how happy did you feel yesterday? (experience approach)
overall, how anxious did you feel yesterday? (experience approach)
All are answered using a 0 to 10 scale where 0 is ‘not at all’ and 10 is ‘completely’. Further information on the ONS approach to measuring personal well-being can be found in the paper ‘Measuring Subjective Well-being’ (240.8 Kb Pdf) (ONS, 2011a).
8.3 APS design and its implications for the personal well-being statistics
Early in the Measuring National Well-being Programme, ONS selected the Annual Population Survey (APS) as the key survey on which to include the personal well-being questions for the national estimates of personal well-being. The APS is one of the largest household surveys run by ONS and offers a very cost-effective means of measuring personal well-being in a representative way across the UK and for each UK country. Also, because of its very large sample size, it provides opportunities for analysis of the personal well-being estimates of smaller groups, such as minority ethnic groups, and across regional and local areas. These are important considerations in deciding how best to monitor the personal well-being of the nation.
Whenever including new questions on a survey originally designed for another purpose, there are some aspects of the design and coverage of the survey which present challenges. These are highlighted in this section wherever they are relevant.
8.3.1 How the APS is constructed
The APS is an annual version of the quarterly Labour Force Survey (LFS). It is constructed by combining data collected on the LFS (waves 1 and 5), and also includes data from LFS ‘boost’ samples in England, Wales and Scotland (all 4 waves). The APS is comprised of data collected over a 12 month period, and includes a panel element where a household, once selected for interview, is retained in the sample for a set period of time (known as ’waves’). The way the APS is constructed makes sure that no person appears more than once in the dataset. Table 1 shows this, with all the bold text highlighting the waves contributing to the APS data between April 2014 and March 2015:
Table 1: Data structure of the APS Personal Well-being dataset, 2014/15 (1, 2)
| APS Personal Well-being dataset: April 2014 to March 2015 | ||||
| April - June 2014 | July - Sept 2014 | Oct - Dec 2014 | Jan - March 2015 | |
| LFS cohort 1 (first sampled April - June 2013) | Wave 5 | |||
| LFS cohort 2 (first sampled July - Sept 2013) | Wave 4 | Wave 5 | ||
| LFS cohort 3 (first sampled Oct - Dec 2013) | Wave 3 | Wave 4 | Wave 5 | |
| LFS cohort 4 (First sampled Jan - March 2014) | Wave 2 | Wave 3 | Wave 4 | Wave 5 |
| LFS cohort 5 (First sampled April - June 2014) | Wave 1 | Wave 2 | Wave 3 | Wave 4 |
| LFS cohort 6 (first sampled July - Sept 2014) | Wave 1 | Wave 2 | Wave 3 | |
| LFS cohort 7 (first sampled Oct - Dec 2014) | Wave 1 | Wave 2 | ||
| LFS cohort 8 (First sampled Jan - March 2015) | Wave 1 | |||
| LFS boost cohort 1 (first sampled April 2011 - March 2012) | Wave 4 | |||
| LFS boost cohort 2 (first sampled April 2012 - March 2013) | Wave 3 | |||
| LFS boost cohort 3 (first sampled April 2013 - March 2014) | Wave 2 | |||
| LFS boost cohort 4 (first sampled April 2014 - March 2015) | Wave 1 | |||
| Source: Office of National Statistics | ||||
| Notes: | ||||
| 1. LFS households are interviewed over a 5-wave period, with 3 months between interviews | ||||
| 2. LFS boost households are interviewed over a 4-wave period, with 1 year between interviews | ||||
Download this table Table 1: Data structure of the APS Personal Well-being dataset, 2014/15 (1, 2)
.xls (56.3 kB)8.3.2 Sample sizes and representativeness
In total, the APS personal well-being file includes responses from over 300,000 people per year, based in around 135,000 households. Unlike other questions on the APS, people are only asked the personal well-being questions directly and no one else in the household is allowed to respond on their behalf. For this reason the sample size for the APS Personal Well-being dataset is smaller than the normal APS dataset, at around 165,000 people per year. This still makes it the largest dataset in the UK to include the personal well-being questions.
The APS is a household survey, and after weighting, the APS Personal Well-being dataset provides a representative sample of adults (aged 16 and over) living in residential households in the UK. It is not representative of young people under the age of 16 nor people living in institutional settings such as nursing homes, care homes, prisons or hostels. It also does not include homeless people. It is important to acknowledge that the personal well-being of people living in these circumstances might differ substantially from that of adults living in household settings. As a result, the estimates of personal well-being from the APS can only be seen as representative of the adult population of the UK living in household settings and any generalisations should be made on this basis.
8.3.3 Data collection methods and their implications
The APS uses both face-to-face and telephone interviewing methods. These different data collection methods appear to affect how people respond to the personal well-being questions. In general, people rate each aspect of their well-being more positively when interviewed by telephone than when interviewed face-to-face by an interviewer. For example, in 2014/15, higher ratings were given on average for the life satisfaction, worthwhile, and happy yesterday questions during telephone interviews compared to face-to-face (see Table 2).
Table 2: Average personal well-being, by mode of interview, 2014/15
| United Kingdom | ||
| Average | ||
| Telephone | Face-to-face | |
| Life satisfaction | 7.7 | 7.5 |
| Worthwhile | 7.9 | 7.8 |
| Happy yesterday | 7.6 | 7.4 |
| Anxious yesterday | 3 | 2.8 |
| Source: Annual Population Survey, Office for National Statistics | ||
Download this table Table 2: Average personal well-being, by mode of interview, 2014/15
.xls (28.2 kB)The relationship between the mode of interview and average responses to the personal well-being questions has been examined using regression analysis to hold other possible influences on personal well-being constant. This shows the same pattern found in descriptive statistics: on average, people give more positive responses when interviewed by telephone than when interviewed face-to-face. These findings, first published by ONS in May 2013 (ONS, 2013a), are reproduced in Table 3.
Table 3: Effects of interview mode on ratings of personal well-being (1,2,3) after controlling for individual characteristics
| Great Britain | ||||
| Coefficients | ||||
| Life satisfaction | Worthwhile | Happy yesterday | Anxious yesterday | |
| Reference group: Telephone Interview4 | ||||
| Face to Face Interview | -0.171* | -0.165* | -0.132* | 0.054* |
| Source: Annual Population Survey, Office for National Statistics | ||||
| Notes: | ||||
| 1. Adults aged 16 and over were asked 'Overall, how satisfied are you with your life nowadays?', 'Overall, to what extent do you feel the things you do in your life are worthwhile?', 'Overall, how happy did you feel yesterday?' and 'Overall, how anxious did you feel yesterday?' where nought is 'not at all' and 10 is 'completely' | ||||
| 2. Data from April 2011 to March 2012 | ||||
| 3. All data weighted | ||||
| 4. The reference group for interview mode is 'telephone interviews' | ||||
| 5. * shows that the relationship is statistically significant at the 5% level | ||||
Download this table Table 3: Effects of interview mode on ratings of personal well-being (1,2,3) after controlling for individual characteristics
.xls (29.7 kB)The findings in Table 3 indicate the size and statistical significance of the mode effects, or the extent to which people rate their well-being differently by telephone or in person. The effect is smallest for the question about anxiety yesterday which people rate 0.05 points higher on average on the 0-10 scale when interviewed face-to-face compared to telephone. The effect is greatest on ratings of life satisfaction which people rate 0.17 points lower on average when interviewed face-to-face compared to telephone. These differences are statistically significant for all four questions, implying that they are likely to be due to factors other than sampling variation.
Table 4 shows proportions of people interviewed via each method in each of the three years for which the personal well-being data are available.
Table 4: Proportions of respondents: by mode of interview, 2011/12 to 2014/15 (1)
| United Kingdom | ||||
| Percentage | ||||
| 2014/152 | 2013/14 | 2012/13 | 2011/12 | |
| Type of Interview | ||||
| Telephone | 37.6 | 44.2 | 41.7 | 42.2 |
| Face-to-face | 62.4 | 55.8 | 58.3 | 57.8 |
| Total | 100 | 100 | 100 | 100 |
| Source: Annual Population Survey, Office for National Statistics | ||||
| Notes: | ||||
| 1. Data is weighted | ||||
| 2. Proportions differ from previous years due to a movement from telephone to face to face interviewing, and the greater weight given to face to face interviews | ||||
Download this table Table 4: Proportions of respondents: by mode of interview, 2011/12 to 2014/15 (1)
.xls (28.7 kB)8.3.4 Implications of mode effects for personal well-being estimates
It is challenging to account for mode effects when using statistics. As regression analysis has found mode of interview to be significant to all personal well-being measures, it is advisable to include mode of interview in any planned regression analysis using the APS Personal Well-being dataset.
In the ONS national estimates of personal well-being, the impact of mode is statistically significant. It has been roughly consistent over the period for which the data are available, suggesting that mode effects are unlikely to affect any substantive conclusions drawn.
There may be more of an impact of mode effects on comparisons between personal well-being for lower level geographical estimates. This is for two reasons: different groups may have different balances of telephone and face-to-face response; and the impact of mode may differ by area.
In general, most wave 1 interviews will be conducted face-to-face and subsequent wave interviews will be by telephone. This should lead to a roughly equal balance of face-to-face and telephone respondents for most geographic regions south of the Caledonian Canal. North of the Caledonian Canal all APS interviews are conducted by telephone. Care should therefore be taken when comparing geographies north of the Caledonian Canal to those which are south of the Caledonian Canal, and users may wish to disregard any differences between such areas which are only marginally statistically significant.
There is some preliminary evidence that the impact of mode may vary between areas, potentially introducing bias into geographical comparisons. However, this impact tends to be smaller than the standard error, implying that a difference which is statistically significant according to the published standard errors would be likely to remain if it were possible to account for the variation in mode effects (although it may no longer be significant). ONS plan to investigate this further and to make the results of further analysis available to users.
8.3.5 Topic coverage of the APS
As the APS is based on a labour market survey, it includes an extensive range of questions which are important for understanding labour market participation, many of which are also useful for the analysis of personal well-being. For example, it includes a wide range of social and demographic questions as well as items about housing, employment and education. For full details of the variables included in the APS Personal Well-being dataset, please see the survey user guide (1.01 Mb Pdf).
As interest in personal well-being data extends to the full spectrum of policy areas, ONS has also included the questions on other major surveys that it runs. It has worked collaboratively with other UK government departments and with the European statistical institute, Eurostat, to encourage wide use of the questions. A list of the surveys that currently include the questions, their broad topic coverage and how to get further information is available on our Frequently Asked Questions page or from the Cabinet Office website.
8.4 How to access the APS personal well-being data
There is a range of ways in which the data are made available. A regular set of key estimates from the data are available in Excel spreadsheets published alongside the Personal Well-being in the UK statistical bulletin:
The APS Personal Well-being data are deposited with the UK Data Service (UKDS) about six weeks after the publication of the Personal Well-being in the UK statistical bulletin. It is available from UKDS in two formats:
End User License (a fully anonymised non-disclosive set of data containing basic demographic information, available to UK and overseas academics),
Special License versions (a more disclosive set of data, containing more detailed variables such as Unitary Authority / Local Authority, however Unitary Authority / Local Authority level data is only available for Great Britain but not for Northern Ireland. Access to this data requires Approved Researcher accreditation, and is only available to UK-based researchers)
Further information about these options and how to access the data is available from the UK Data Service.
Data can also be accessed through the ONS Virtual Microdata Laboratory (VML) or through the Secure Data Service of UKDS. This is usually the way to access more detailed data with smaller sample sizes or lower levels of geography, which require access through a more secure route. Users accessing data in this format will require Approved Researcher accreditation. Overseas academics interested in this can also apply through this route but they must travel to the UK to use these facilities. Please contact either UKDS or socialsurveys@ons.gov.uk for further details.
ONS also provide the data directly to UK Civil Service statisticians and government researchers. Government analysts interested in this option should please contact ONS at: socialsurveys@ons.gov.uk.
8.5 Interpreting the personal well-being estimates
8.5.1 Using average ratings versus grouped ratings
When comparing differences between average ratings of groups or areas, it must be remembered that this does not account for variability within the groups. Just because the average of sample respondents has a certain rating of personal well-being does not necessarily mean that all people with that characteristic will have that particular outcome. For example, even though women on average have higher life satisfaction than men, it is important not to infer that all women are more satisfied with their lives than men. Recent research suggests that women may tend to rate their life satisfaction as either very high or very low. This pattern of responses may be masked when using averages alone. Looking at the percentage who rate their well-being at different levels can add further insight into patterns of well-being and this is why both methods are used in this bulletin. It also helps to make clear that what is true for part of the sample with a certain characteristic is unlikely to be true for all people with that characteristic.
8.5.2 Association versus causation
The APS personal well-being data have been analysed by different personal characteristics and circumstances in the online reference tables accompanying this bulletin, but any relationships observed should not necessarily be taken to imply causation. It can only be asserted that a specific characteristic or circumstance is associated with higher or lower well-being, not that it has caused this outcome. Although some groups are more likely to give higher life satisfaction ratings on average, it may not be the particular characteristic that is causing them to rate their well-being at a higher level. There are other factors that could also influence their ratings which would need to be controlled for in a regression model, and even then causation is often difficult to infer. For example, although married people on average rate their happiness at higher levels, it is difficult to say with certainty whether marriage increases reported happiness or whether happier people are more likely to marry. Longitudinal data which tracks people’s characteristics, experiences and views over time is needed to establish whether the well-being or the circumstance came first.
8.5.3 The meaning of small differences
The size of differences between ratings of personal well-being between groups of people with certain characteristics or in specific areas of the UK can appear fairly small. This is also the case for the size of year-on-year changes in the national personal well-being estimates. The personal well-being estimates in this bulletin are generally presented to one decimal place, but the estimates relating to change over time are presented to two decimal places. This is to present more clearly the direction of change over time for these estimates.
A key challenge is to determine the relevance of these changes. One theory suggests that people may have a personal set-point for well-being to which they naturally return after a positive or negative life event. This would suggest that levels of well-being may only vary within a fairly small range over time, particularly in the aggregate (Cummins, 1998; Allin and Hand, 2014, p.13).
Other research suggests that there may be some shocks from which people do not necessarily regain their previous set-point such as the death of a spouse (Dolan, Peasgood and White, 2008; Lucas et al, 2004) or that policy initiatives can affect levels of personal well-being in a sustained way (Helliwell, Layard, Sachs, 2012).
Although the size of the changes reported in this bulletin may appear small in the aggregate, they may mask larger changes in the well-being of particular groups within society or within particular areas of the UK. This is why ONS look not only at changes in average levels of personal well-being, but also in the proportions of people who rate their personal well-being as very high or very low and how this changes over time and between groups. Both are required to get a rounded picture of personal well-being in the UK and regular monitoring will help to uncover any important patterns.
8.5.4 Approaches to statistical significance
In this bulletin, when describing changes over time the term ‘significant’ refers to statistical significance (at the 95% level). Unless otherwise stated, the changes over time mentioned in the text have been found to be statistically significant at the 95% confidence level. Standard errors have been calculated and used in tests of statistical significance and are available in the reference tables published alongside this bulletin.
The statistical significance of differences in the estimates for a specific area of the UK and the equivalent UK estimate are approximate, and determined on the basis of non-overlapping confidence intervals. This method provides a conservative estimate of statistical significance but may result in estimates which are statistically significantly different to one another being assessed as not. The result is that some estimates which may be significantly different to the UK estimates may not be identified as such. This would tend to underestimate the differences observed in personal well-being between a country or English region, and the equivalent UK estimates.
As the personal well-being data have only been collected for three years, it is not yet possible to know how volatile the data will be over time. This makes it difficult to put the seemingly small changes reported here into a wider context which would help to shed light on how important they are. This is also a key reason why ONS do not plan to change the questions in the near future as building up a consistent time series will help interpretations.
8.6 Personal well-being question testing
A number of other methodological issues have been/ are being tested as part of a programme of work looking at how the questions perform in different circumstances (see ONS, 2011b). This involves both quantitative testing of question variations using the Opinions and Lifestyle (OPN) Survey, and qualitative testing methods in which people are asked to explain more about the way they answered the questions and why. It is important to note that, although ONS continue to test the questions they have not been changed on the APS since they were first introduced in 2011. This is to make sure a consistent time series is developed.
The Personal Well-being Team are also in contact with researchers who have used the questions in a range of different settings. Their feedback provides valuable information for ONS and other prospective users. If you have used the questions or have done analysis which could benefit others, please let us know by contacting the Personal Well-being Team at personal.well-being@ons.gov.uk. One way we intend to share the results of our question testing is via the Measuring National Well-being group of StatsUserNet. We would encourage other researchers to share their findings there as well.
The following section summarises some of the key issues looked at by ONS in the question testing to date.
8.6.1 Contextual effects
The respondent’s mood and the immediate context of the interview can affect responses to evaluative questions. In a household survey context, responses to the personal well-being questions could be affected by other household members being present during face-to-face interviews. ONS have explored this issue in cognitive testing conducted in 2013 among OPN respondents. The results suggested that people may give both more positive and more negative responses to the questions depending on which other member of the household is present. In order to test this more fully, a ‘flag’ has been added to the OPN survey to indicate if someone else is present when a respondent is interviewed. This work is ongoing and results are expected later in the year.
Another effect of context that appears to influence responses is the day of the week on which the respondent is interviewed. Interviewing on the APS is conducted every day of the week throughout the year, but many fewer interviews are conducted on Sundays and certain public holidays. As two of the questions refer to ‘yesterday’, there are inevitably fewer responses relating to Saturdays, when personal well-being ratings may be different to other days of the week.
The process for identifying the day of the week on which a respondent has been interviewed is complicated. ONS are currently working on a simpler means of identifying day of the week when the interview took place so this can be added to the dataset.
The month of the year in which a respondent is interviewed may also affect responses. Preliminary evidence suggests that there may be a seasonal effect, but with only three years of data available, it is too early to be sure. This is something that ONS will continue to monitor as the time series builds.
8.6.2 Question order
Responses to personal well-being questions have been shown to be affected by earlier questions in the survey (for example, questions about health or labour market status). Prior to the introduction of the questions on the APS in April 2011, ONS carried out cognitive testing of the placement of the personal well-being questions (see: Measuring Subjective Well-being (240.8 Kb Pdf)). This suggested that the questions should be asked early in the interview, immediately after the questions on household and individual demographics. This allows time for rapport to be built up between the interviewer and respondent but does not allow questions on other topics, such as health or employment, to influence responses to the personal well-being questions. ONS advise researchers to follow this approach whenever the questions are included on surveys in order to avoid potential bias from earlier questions.
Quantitative question testing found that the order in which the personal well-being questions are asked does not significantly affect responses (Summary of results from testing of experimental subjective well-being questions). Qualitative testing showed that respondents preferred the positive questions first as they were easier to answer. ONS always include the four questions in the same order on every survey to be sure that the findings are as consistent and comparable as possible. The recommended order is:
life satisfaction
worthwhile
happy yesterday
anxious yesterday
8.6.3 Response scales
For all APS personal well-being questions, an 11 point scale is used. This ranges from 0–10 where 0 is ‘not at all’ and 10 is ‘completely’. This means that the scales are consistent between the questions, which helps respondents to answer the questions more easily and also aids subsequent analysis. Additionally, 11 point scales are commonly used across other similar surveys, particularly internationally. The use of this type of scale will also aid comparisons with other survey findings.
Cognitive testing has suggested that people may misinterpret the scale for the anxiety question as this is the only question where a higher score suggests worse well-being. The use of show cards (which provide a visual aid of response options for respondents) has been tested on the OPN survey to see whether this helps to remind people of how the scale works for each question. The results of this work showed that while higher scores were given for the life satisfaction, happiness and anxiety questions when show cards were used, the differences were only significant for the life satisfaction and happiness questions. These results were not as expected but the sample used for this test was small. Further details are available in the paper: Summary of results from testing of experimental subjective well-being questions.
Show cards are not used on the APS and it is not feasible to use them due to interviews being conducted both face-to-face and by telephone. For this reason, we have not done any further testing of the effects of show cards on responses.
8.6.4 Question wording
ONS have used both cognitive testing techniques and split trial testing of data collected on the Opinions Survey to look at whether asking the questions in different ways may affect responses to the questions. For example, cognitive testing has suggested that the word ‘anxious’ may be interpreted by some people as representing severe mental distress, while ‘stress’ or ‘worry’ are more commonly used to describe daily emotions. These differences are also being tested using the OPN to see how people respond to each way of asking the question.
Nôl i'r tabl cynnwys9. The Measuring National Well-being programme

This bulletin is published as part of the ONS Measuring National Well-being programme.
The programme aims to produce accepted and trusted measures of the well-being of the nation - how the UK as a whole is doing. It is about looking at 'GDP and beyond' and includes:
greater analysis of the national economic accounts, especially to understand household income, expenditure and wealth
further accounts linked to the national accounts, including the UK Environmental Accounts and valuing household production and 'human capital'
quality of life measures, looking at different areas of national well-being such as health, relationships, job satisfaction, economic security, education environmental conditions
working with others to include the measurement of the well-being of children and young people as part of national well-being
measures of 'personal well-being' - individuals' assessment of their own well-being
headline indicators to summarise national well-being and the progress we are making as a society
The programme is underpinned by a communication and engagement workstream, providing links with Cabinet Office and policy departments, international developments, the public and other stakeholders. The programme is working closely with Defra on the measurement of 'sustainable development' to provide a complete picture of national well-being, progress and sustainable development.
ONS published the third ‘Life in the UK’ report in March 2015, giving the latest snapshot of the nation’s well-being. The next update of the National Well-being Measures data is released 29 September 2015. A summary of all the work completed during the first three years of the Measuring National Well-being Programme is available here. A full list of outputs from the Measuring National Well-being programme is available here.
Find out more on the Measuring National Well-being website pages.
Nôl i'r tabl cynnwys