Cynnwys
- Main points
- Things you need to know about this release
- Personal well-being
- Our relationships
- Health
- What we do
- Where we live
- Personal finance
- The economy
- Education and skills
- Governance
- The natural environment
- Conclusion
- Sources used in International comparisons, 2017
- OECD countries and member states of the EU
1. Main points
The UK is positioned around the middle of the distribution of countries for the majority of well-being measures. The countries that tend to appear in the top of the distribution include Denmark, Norway and Sweden, compared to Greece and Bulgaria who tend to appear at the bottom.
The harmonised unemployment rate for the UK was 5.3% in 2015. This compared to Greece which had the highest (25.0%) and Japan with the lowest (3.4%).
In 2015, 16% of UK households reported either difficulty or great difficulty in making ends meet, lower than the EU average of 26%. People in Greece (78%) were most likely to report difficulty while people in Sweden (5%) were least likely.
59% of people in the UK agreed or agreed strongly that they felt close to other people in the area where they lived, slightly higher than Germany (58%), the lowest-ranking country in 2012. The highest-ranked country was Cyprus (81%).
6% of the UK's total primary energy supply came from renewable sources in 2014. Iceland was the highest ranking country, where 89% of total primary energy supply was from renewable sources and Korea the lowest at 1%.
In 2014, 5% of people aged 15 and over in the UK reported feeling lonely most or almost all of the time. This compared with Poland which had the largest proportion (12%), and the Netherlands which had the lowest proportion (3%).
Asked to rate general satisfaction with life from 0 to 10, people in the UK gave 6.5 in 2015, the same as the Organisation for Economic Co-operation and Development (OECD) average. People in Norway and Switzerland were most satisfied (7.6) while people in Portugal were the least satisfied (5.1).
Nôl i'r tabl cynnwys2. Things you need to know about this release
This article explores how areas of well-being in the UK compares with the 35 member countries of the Organisation for Economic Co-operation and Development (OECD) using international well-being measures similar to those adopted as part of the UK’s Measuring National Well-being (MNW) programme. We publish measures of national well-being, covering areas including our health, natural environment, personal finances and crime.
Looking at the measures within these domains from an international perspective gives us a sense of whether quality of life in the UK is better or worse than in other countries. This article includes data for the UK or Great Britain as a whole. It is worth noting that different groups or different areas of the UK may feel very differently about their lives and have different experiences. We will be publishing an update to the UK Measuring National Well-being programme in April 2017, which will allow comparisons across groups and geographies in the UK.
If international data are not available then a comparison with countries in the European Union (EU) is included if available. The article uses the latest data available in the last 5 years from sources including the OECD, Eurobarometer, European Social Survey, European Quality of Life Survey, Eurostat, Gallup World Poll, the International Institute for Democracy and Electoral Assistance, the United Nations and the World Health Organisation. Data for sections 3 to 12 are for adults aged 16 and over (unless otherwise stated) and cover different survey dates which are defined in the text. A lot of the data comes from household surveys so people not living in households are not included in the data (for example people who live in communal establishments).
For more information on the data and sources used for this article, please see MNWB International Comparisons data.
Nôl i'r tabl cynnwys3. Personal well-being
“Being able to measure people’s quality of life is fundamental when assessing the progress of societies. There is now widespread acknowledgement that measuring subjective well-being is an essential part of measuring quality of life alongside other social and economic dimensions” (OECD, 2013).
Life satisfaction
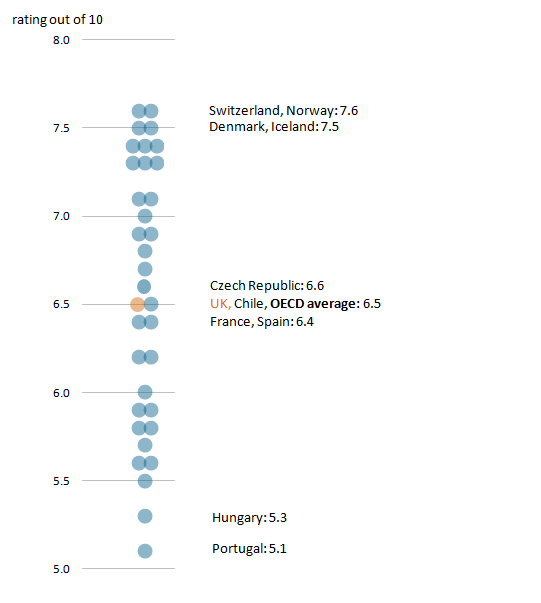
Life satisfaction measures how people evaluate their life as a whole rather than their current feelings. According to data from the Organisation for Economic Co-operation and Development (OECD) conducted by Gallup World Poll, the average (mean) rating of life satisfaction for people in the UK was 6.5 out of 10 in 2015 (Figure 1). This was the same rating as the OECD average and Chile and was similar to France and Spain (6.4 out of 10) and the Czech Republic (6.6 out of 10). The highest-ranked countries were Norway and Switzerland (7.6 out of 10), while Portugal was the lowest-ranked country (5.1 out of 10).
Figure 1: Average rating of life satisfaction, 2015
OECD countries
Source: Gallup World Poll
Notes:
- Respondents were asked to: “Imagine an eleven-rung ladder where the bottom (0) represents the worst possible life for you and the top (10) represents the best possible life for you. On which step of the ladder do you feel you personally stand at the present time?”
- Chart axis does not start at 0.
- The countries with the highest and lowest values along with the countries that have the same or similar values to the UK have been labelled in the chart. 2013 for Iceland.
Download this image Figure 1: Average rating of life satisfaction, 2015
.png (12.4 kB) .xls (1.8 MB)
Happiness
People aged 15 and over were asked on the 2014 European Social Survey, “Taking all things together, how happy would you say you are?” where 0 was extremely unhappy and 10 was extremely happy. In the UK a third of respondents (33%) reported a high rate of happiness (9 or 10 out of 10), the same proportion to Israel. Denmark had the largest proportion of people reporting a high rate of happiness (47%), while Lithuania had the lowest proportion (15%).
Worthwhile
According to the 2012 European Quality of Life Survey, over 8 in 10 people in the UK (82%) strongly agreed or agreed they generally felt that what they did in life was worthwhile. This was higher than the EU–28 average of 78%, the same as Spain (82%) and similar to France and Belgium (81%). The highest-ranking countries were Denmark and the Netherlands, where over 9 in 10 (92%) strongly agreed or agreed that they generally felt that what they did in life was worthwhile, while the lowest-ranking country was Greece (48%).
World Health Organisation (WHO) -5 mental well-being index
People thinking and feeling good about themselves and feeling able to cope with their problems can be described as having positive mental health. The WHO–5 mental wellbeing index comprises 5 positively worded items answered on a 6-point scale. Items included cheerfulness, calmness, activity, feeling rested and levels of interest. A higher score on this measure indicates better mental wellbeing. On the 2012 European Quality of Life Survey, people in the UK scored an average (mean) of 59 out of 100 on the WHO-5 mental wellbeing index. This was the same score as Slovakia and Poland and was lower than the EU–28 average of 63 out of 100. Denmark had the highest mean score (70 out of 100) and Latvia the lowest (56 out of 100).
Nôl i'r tabl cynnwys4. Our relationships
“Humans are social creatures. The frequency of their contacts with others and the quality of their personal relationships are crucial determinants of well-being” (OECD, 2011).
Satisfaction with personal relationships
Previous research has shown that the amount and quality of social connections with people around us are vitally important to an individual’s well-being and should be considered when making any assessment of national well-being. On a survey run by Eurostat in 2013, respondents were asked to rate their satisfaction with their personal relationships on a scale from 0 (not satisfied at all) to 10 (fully satisfied). The average (mean) rating in the UK was 8.3 out of 10, this was the same as Finland, Slovenia and Sweden and higher than the EU-28 average of 7.8 out of 10. Ireland had the highest rating of satisfaction with their personal relationships (8.6 out of 10) while Bulgaria had the lowest (5.7 out of 10).
Loneliness
Inadequate social connectedness or poor relationships may lead to people experiencing loneliness in life. However the feeling of loneliness is subjective and a person may experience this even when in the company of family and friends. Loneliness increases the likelihood of mortality (Holt-Lunstad, 2015) and puts individuals at greater risk of cognitive decline (James et al, 2011). In the UK, 5% of people aged 15 and over reported feeling lonely most or almost all of the time in the week prior to interview according to the 2014 European Social Survey. This was the same proportion as Sweden and Ireland. Poland had the largest proportion of people reporting loneliness most or almost all of the time (12%), while the Netherlands had the lowest proportion (3%).
Social network support
People were asked on the Gallup World Poll in 2015, if they had relatives or friends they could count on to help when needed if they were in trouble. Over 9 in 10 people in the UK (93%) reported that they could count on someone, which was higher than the OECD average of 88%. This was the same proportion as Austria, Luxembourg, Norway and Switzerland. The highest and lowest proportions were in New Zealand (99%) and Mexico (75%) respectively.
Nôl i'r tabl cynnwys5. Health
“The relationship between health and well-being is fundamental and reciprocal, and the well-being of populations has important implications for the health sector” (World Health Organisation, 2015).
Healthy life expectancy at birth
Healthy life years are the average number of years that a person can expect to live in "full health" by taking into account years lived in less than full health due to disease and (or) injury. According to data for the Organisation for Economic Co-operation and Development (OECD) countries from the World Health Organisation (WHO), males in the UK had an estimated 70.3 healthy life years at birth in 2015, the same number of years as Ireland. Females in the UK had an estimated 72.5 healthy life years at birth in 2015, similar to New Zealand (72.4). Japan was the highest-ranking country for both males and females (72.5 and 77.2 healthy life years respectively). Latvia was the lowest-ranking country for males (63.2 healthy life years), while Turkey was the lowest-ranking country for females (67.8 healthy life years).
Perceived health status
Our previous research has shown that how people view their health was the most important factor related to their overall personal well-being. Data from the OECD shows that 70% of adults aged 15 and over in the UK reported to be in good or better than good health in 2014, the same proportion as Austria. Over 9 in 10 (91%) people in New Zealand reported good or better than good health, compared to 33% in Korea. Please note that data from New Zealand are not directly comparable with those for other countries, due to methodological differences in the survey questionnaire.
Nôl i'r tabl cynnwys6. What we do
“Participation in both physical and non-physical leisure activities has been shown to reduce depression and anxiety, produce positive moods and enhance self-esteem and self-concept, facilitate social interaction, increase general psychological wellbeing and life satisfaction, and improve cognitive functioning” (John T. Haworth, 2010).
Cultural participation
Some research studies have found links between arts and culture and well-being, for instance that culture helps to strengthen social ties in the community which ultimately nurtures social well-being. A special Eurobarometer survey run from April to May 2013 looked at cultural access and participation. Just under 8 in 10 (79%) adults aged 15 and over in the UK had a combined score of either very high, high or medium cultural engagement. This was higher than the EU-27 average of 66% and similar to France and Luxembourg (both 81%) and Finland and Lithuania (both 77%). The country with the highest combined score of either very high, high or medium cultural engagement was Sweden (92%) while the lowest was Greece (37%).
Taking part in sports or physical exercise
A special Eurobarometer survey run from November to December 2013 looked at participation in some kind of sport or exercise regularly or with some regularity. In the UK, 46% of people aged 15 and over participated in some kind of sport or exercise regularly (at least 5 times a week) or with some regularity (1 to 4 times a week). This was a higher proportion than the EU–28 average of 41% and the same proportion as Spain. Sweden had the highest proportion of people participating in sport or exercise regularly or with some regularity (70%) while Bulgaria had the lowest participation (11%).
Unemployment
There is strong evidence showing that work is generally good for physical and mental health and well-being. Worklessness is associated with poorer physical and mental health and well-being (Waddell and Burton, 2006). In 2015, the harmonised unemployment rate for the UK was 5.3% according to data from the Organisation for Economic Co-operation and Development (OECD), lower than the OECD average of 6.8% (Figure 2). This was the same rate as the United States and a similar rate to New Zealand (5.4%) and Israel (5.2%). The countries with the highest harmonised unemployment rate were Greece (25.0%) and Spain (22.1%), while the countries with the lowest rate were Japan (3.4%) and Korea (3.6%).
Figure 2: Harmonised unemployment rates, 2015
OECD countries
Source: Organisation for Economic Co-operation and Development
Notes:
- Harmonised unemployment rates define the unemployed as people of working age who are without work, are available for work, and have taken specific steps to find work. The uniform application of this definition results in estimates of unemployment rates that are more internationally comparable than estimates based on national definitions of unemployment. This indicator is measured in numbers of unemployed people as a percentage of the labour force and it is seasonally adjusted. The labour force is defined as the total number of unemployed people plus those in civilian employment.
- Chart shows the countries with the highest and lowest values along with the countries that have the same or similar values to the UK.
Download this chart Figure 2: Harmonised unemployment rates, 2015
Image .csv .xlsJob satisfaction
Work is an important part of most people’s lives, it can provide structure and routine and a sense of self-worth which is essential for our well-being. There is evidence that happy and satisfied workers are more productive at work. It is also fair to say that the type of work, and job quality can have an impact on an employees’ overall satisfaction with their job. On a survey run by Eurostat in 2013, respondents were asked to rate their satisfaction with their job on a scale from 0 (not at all satisfied) to 10 (fully satisfied). Fewer than 3 in 10 (28%) people in the UK reported a high satisfaction rating of rating 9 or 10 out of 10 with their job according to data from Eurostat, the same proportion as Malta and higher than the EU–28 average of 25%. Denmark had the highest proportion of people who had a high satisfaction with their job (44%), while the lowest proportion was in Greece (14%).
Volunteering
Volunteering may have benefits for both health and well-being and can make a difference to the lives of other people, the community or the environment. According to data from OECD conducted by Gallup World Poll in 2014, just under a third (32%) of people in Great Britain reported that they had volunteered some of their time during the 12 months prior to interview. This was higher than the OECD average of 26% and the same proportion as Austria, Germany and Norway. New Zealand had the highest proportion of people who reported that they had volunteered some of their time (45%), compared to just 7% in Greece.
Nôl i'r tabl cynnwys7. Where we live
“Where people live matters for their well-being and improving people’s lives requires making where they live a better place” (OECD, 2014).
Feeling safe walking alone at night in the city or area where living
Personal security and safety is important to a person’s sense of well-being and attitude to the area in which they live. According to the 2014 World Gallup Poll, over three-quarters of people in Great Britain (79%) felt safe walking alone at night in the city or area where they lived (Figure 3). This was higher than the Organisation for Economic Co-operation and Development (OECD) average of 69% and similar to Canada, Denmark and Germany (80%) and Iceland (78%). People in Norway felt the safest (86%), while people in Hungary felt the least safe (47%).
Figure 3: Proportion of people who feel safe walking alone at night in the city or area where living, 2014
OECD countries
Source: Gallup World Poll
Notes:
- Chart shows the countries with the highest and lowest values along with the countries that have the same or similar values to Great Britain.
Download this chart Figure 3: Proportion of people who feel safe walking alone at night in the city or area where living, 2014
Image .csv .xlsSatisfaction with recreational and green areas
To have access to green and recreational areas plays an important role from the point of view of human well-being and health. On a survey run by Eurostat in 2013, respondents were asked to rate their satisfaction of recreational and green areas on a scale from 0 (not satisfied at all) to 10 (fully satisfied). In the UK, over a third (37%) rated their satisfaction as high (9 or 10 out of 10); this rating was similar to the Czech Republic (36%) and higher than the EU–28 average of 29%. Austria had the highest proportion of people rating their satisfaction with recreational and green areas as high (56%), while just 10% reported a high rating in Bulgaria.
Feeling close to people in the local area
Looking at whether people feel close to other people in the area where they live can give a sense of whether they feel a sense of belonging to their neighbourhood. According to the European Quality of Life Survey in 2012, 59% of people aged 16 and over in the UK reported that they agreed or agreed strongly with the statement that they felt close to other people in the area where they lived. This was lower than the EU–28 average of 67% and was similar to Germany (58%) which was the lowest-ranking country. The highest-ranked country was Cyprus (81%).
Satisfaction with accommodation
Satisfaction with accommodation is an important aspect of quality of life. Poor conditions such as overcrowding, damp, indoor pollutants and cold have all been shown to be associated with physical illnesses. They can also impact on mental health as people try to cope with the stress of living in cold, damp conditions.
On a survey run by Eurostat in 2013, respondents were asked to rate their satisfaction of their accommodation on a scale from 0 (not satisfied at all) to 10 (fully satisfied). In the UK, 44% rated their satisfaction as high (9 or 10 out of 10), higher than the EU–28 average of 33%. Finland had the highest proportion of people rating their satisfaction with their accommodation as high (54%), compared to just 17% in Latvia.
Nôl i'r tabl cynnwys8. Personal finance
“Household income and wealth are essential components of individual well-being. The ability to command resources allows people to satisfy basic needs and pursue many other goals that they deem important to their lives” (OECD, 2011).
At-risk-of-poverty rate
The well-being of people who are at-risk-of-poverty may be low as they may lack sufficient resources, be at risk of being in debt, suffer poor health, experience educational disadvantage and live in inadequate housing and environment. An individual is considered to be in poverty if they live in a household with an equivalised disposable income below 60% of the national median. Equivalisation adjusts the income to take into account the size and composition of the household. This type of relative indicator does not measure absolute wealth or poverty, but low income in comparison to other residents in that country, which does not necessarily imply a low standard of living. In 2015, 17% of the population of the UK were at-risk-of-poverty according to data from Eurostat, the same as the EU–28 average. The highest proportion of people at risk of poverty was in Romania (25%), while the lowest proportion of people was in the Czech Republic (10%).
Median net wealth per household
Financial wealth makes up an important part of a household’s economic resources, and can protect from economic hardship and vulnerability. According to data from the Organisation for Economic Co-operation and Development (OECD), median net wealth per household1 in Great Britain in 2012 was $187,380. This was higher than the OECD average (18 countries) of $132,615 and similar to Belgium ($188,149 in 2010). The country with the highest median net wealth per household was Luxembourg ($360,251 in 2010), while the Netherlands had the lowest median net wealth per household ($34,194 in 2010).
Median equivalised net income
Disposable income is the amount of money that households have available for spending and saving after direct taxes (such as income tax and council tax) have been accounted for, but before housing costs. It includes earnings from employment, private pensions and investments as well as cash benefits provided by the state. Data from Eurostat shows that in 2015 the median equivalised household disposable income (expressed in Purchasing Power Standard2) for the UK was €17,712, similar to Ireland (€17,704). Luxembourg had the highest median equivalised income (€29,285) while the lowest median equivalised income was in Romania (€4,357).
Satisfaction with financial situation
On a survey run by Eurostat in 2013, respondents were asked to rate their satisfaction of their financial situation on a scale from 0 (not satisfied at all) to 10 (fully satisfied). In the UK, 19% rated their financial satisfaction as high (9 or 10 out of 10); this rating was the same as Germany and higher than the EU–28 average of 13%. Denmark had the highest proportion of people rating their satisfaction with their financial situation as high (38%), while just 3% reported a high rating in Bulgaria.
Inability to make ends meet
To have the financial means to comfortably attain a satisfied lifestyle can be an important factor to many people’s sense of well-being. According to data from Eurostat, 16% of all households in the UK reported great difficulty or difficulty in making ends meet in 2015 (Figure 4). This was lower than the estimated EU–28 average of 26%, and was the same as Estonia (16%). The countries with the highest proportion of households reporting great difficulty or difficulty in making ends meet were Greece (78%) and Bulgaria (64%), while the lowest proportion of households were in Sweden (5%) and Finland (7%).
Figure 4: Proportion of households making ends meet with difficulty or great difficulty, 2015
EU–28
Source: Eurostat
Notes:
- Chart shows the countries with the highest and lowest values along with the countries that have the same or similar values to the UK.
Download this chart Figure 4: Proportion of households making ends meet with difficulty or great difficulty, 2015
Image .csv .xlsNotes for “Personal finance”
- Wealth values are expressed in 2005 USD by, first, expressing values in prices of the same year (2005) through consumer price indexes and, second, by converting national values into a common currency through the use of purchasing power parities for household consumption. The median net wealth refers to the median wealth owned by households excluding pension schemes related to employment.
- The purchasing power standard, abbreviated as PPS, is an artificial currency unit. Theoretically, one PPS can buy the same amount of goods and services in each country. However, price differences across borders mean that different amounts of national currency units are needed for the same goods and services depending on the country.
9. The economy
“The economy makes an important contribution to national well-being. Financial stability and low inflation are important for economic growth. Without financial stability, banks are more reluctant to finance profitable projects which in turn affect jobs and wages” (ONS, 2016).
Net national income per capita
In 2014, ranking countries by net national income (NNI)1 per capita, 16 Organisation for Economic Co-operation and Development (OECD) member countries were above or the same as the OECD average (100%), and 18 were below. The UK was just above the OECD average at 103%, and similar to Ireland (106%) and Finland (100%). The 4 highest-ranked countries were Norway (169%), Luxembourg (157%), Switzerland (145%) and the United States (140%). The lowest-ranked countries were Mexico (46%) and Latvia (54%).
Government consolidated gross debt
According to data from the OECD, the UK general government total gross2 debt was 96% of gross domestic product (GDP) at current prices in July to September 2016. The highest rate of general government total gross debt as a percentage of GDP was in Japan (237%), while the lowest rate was in Estonia (13%).
Inflation rate
According to data from the OECD, the UK had a rate of inflation (Consumer Price Indices) in December 2016 of 1.6% which was the same as Spain and lower than the OECD average of 1.8%. Turkey had the highest inflation rate (8.5%), while Israel was the only OECD country that experienced falling prices in December 2016 (negative 0.2%).
Notes for “The economy”
- Net national income (NNI) is equal to gross national income (GNI) net of depreciation. Gross National Income is defined as GDP plus net receipts from abroad of wages and salaries and of property income plus net taxes and subsidies receivable from abroad.
- The definition and more information about general government debt is available
10. Education and skills
“Education plays a key role in providing individuals with the knowledge, skills and competences needed to participate effectively in society and in the economy. In addition, education may improve people's lives in such areas as health, civic participation, political interest and happiness” (OECD, 2015)
Not in employment, education or training (NEET)
Helping young people to develop the drive, capacity and skills to enter employment is critical for the sustainability of societies. A young person identified as NEET is either unemployed or economically inactive and is either looking for work or is inactive for reasons other than being a student, an apprentice or a carer at home. In 2015, 16% of those aged 20 to 241 in the UK were NEET, lower than the Organisation for Economic Co-operation and Development (OECD) average (17%) and similar to Belgium and the United States (16%) (Figure 5). Italy and Turkey had the highest proportion of NEETS (34% and 33% respectively), while Iceland had the lowest proportion (7%).
Figure 5: Proportion of NEETs among those aged 20 to 24, 2015
OECD countries
Source: Organisation for Economic Co-operation and Development
Notes:
- NEET refers to young people that are not employed, in education or training.
- Chart shows the countries with the highest and lowest values along with the countries that have the same or similar values to the UK.
Download this chart Figure 5: Proportion of NEETs among those aged 20 to 24, 2015
Image .csv .xlsEducational attainments below upper secondary education
Educational attainment can be a predictor of economic well-being. For example, people who have completed higher levels of education are more likely to achieve economic success than those who have not. According to data from the OECD, just over a fifth (21%) of people aged 25 to 64 in the UK had not completed upper secondary education in 2015. This included those who had pre-primary and primary education and lower secondary education only. This was slightly lower than the OECD average of 23% and the same proportion as Australia. Mexico had the highest proportion of people who had educational attainments below upper secondary education (65%), while the Czech Republic had the lowest proportion (7%).
Notes for “Education and skills”.
- OECD focuses mainly on 20- to 24-year-olds, as cross-country differences in the duration of compulsory education do not affect international comparisons of the transition from school to work at this age.
11. Governance
“Civic engagement allows people to express their voice and to contribute to the political functioning of their society. In turn, in well-functioning democracies, civic engagement shapes the institutions that govern people’s lives” (OECD, 2011).
Voter turnout
Voting is the most prominent form of political participation and, for many people, it is the only engagement with politics that they have. Political engagement and voicing political opinions matters to national well-being as it helps shape government activities, which in turn help build strong and resilient communities. According to data from the International Institute for Democracy and Electoral Assistance, two-thirds (66%) of registered voters in the UK voted in the parliamentary election in 2015. This was a similar proportion to Ireland in 2016 (65%) and Finland (67%) in 2015. Unsurprisingly, among the OECD countries, Luxembourg in 2013 and Australia in 2016 (where there is compulsory voting in both countries) had the highest proportion of registered voters who actually voted (91%). Of the countries with no compulsory voting, Denmark and Sweden in 2015 and 2014 respectively, had the highest proportion of voters (both 86%). Mexico in 2015 had the lowest proportion of voters (48%).
Confidence in national government
Trust in government is essential for social cohesion and well-being. It represents the confidence of citizens and businesses in the actions of the government. Just over 4 in 10 of people aged 15 and over in Great Britain (42%) reported having confidence in the national government in 2014 according to data from the Gallup World Poll (Figure 6). This was the same as the Organisation for Economic Co-operation and Development (OECD) average and similar to Estonia and Austria (41%). Switzerland had the highest proportion of people reporting confidence in their national government (75%), while Slovenia had the lowest proportion (18%).
Figure 6: Confidence in national government, 2014
OECD countries
Source: Gallup World Poll
Notes:
- Data refer to the percentage who answered "yes" to the question: ‘‘Do you have confidence in national government?’’
- Chart shows the countries with the highest and lowest values along with the countries that have the same or similar values to Great Britain.
Download this chart Figure 6: Confidence in national government, 2014
Image .csv .xls12. The natural environment
“Well-being is determined by physical and non-physical factors. The ability of a society to produce and consume goods and services determines its standard of living, but in the long-run even more critical is its ability to build and maintain the natural environment that meets basic needs like food, water, clean air and ensure the same for future generations” (ONS, 2012).
Greenhouse gas emissions
To mitigate climate change, countries around the world are developing policies to enhance environmental sustainability in areas such as transportation, housing and energy use, to reduce greenhouse gas emissions. In addition to their effects on greenhouse gas emissions, these policies are likely to have consequences for the well-being of their populations. Environmental statistics from the Organisation for Economic Co-operation and Development (OECD) show that the UK’s greenhouse gas emissions1 stood at 527.2 million tonnes of Carbon Dioxide equivalent (Mt of CO2e) in 2014. This figure was the fifth-highest among OECD countries and was similar to Australia (522.4 Mt of CO2e). The United States (6,870.5 Mt of CO2e) and Japan (1,363.9 Mt of CO2e) had the highest total emissions, while Iceland (4.6 Mt of Mt of CO2e) and Luxembourg (10.8 Mt of Mt of CO2e) had the lowest.
Protected Areas
Conservation policies usually involve protecting areas of land from human activity to preserve habitats and prevent species extinction. This in turn may have both a negative and positive effect on well-being for those who live near these areas, for example, loss of land can lead to loss of jobs while increased tourism can lead to the creation of jobs. According to data from the United Nations Statistical Division (Millennium Development Goals Database), 14% of marine and terrestrial areas were classed as protected2 in the UK in 2014. This was the same as Finland. Slovenia had the highest proportion of protected marine and terrestrial areas (54%) and Turkey had the least (0%).
Energy from renewable sources
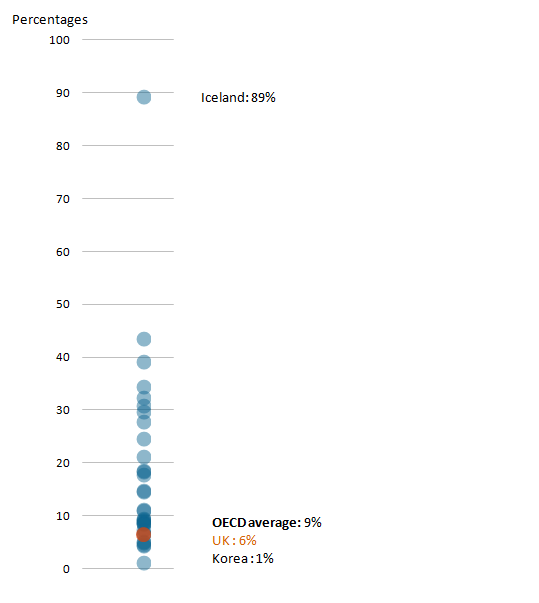
Using renewable sources3 for supplying energy may enhance human welfare in terms of health and environmental improvements, and contribute to a climate safe future. In 2014, renewables accounted for 6% of the UK’s total primary energy supply according to data from OECD. This was lower than the OECD average of 9% and similar to the United States, Australia and Belgium (7%) (Figure 7). The highest shares of renewable energy as a percentage of primary energy supply in 2014 were found in Iceland (89%) and Norway (43%). The lowest percentage shares were in Korea (1%) and Luxembourg (4%).
Figure 7: Contribution of renewables to primary energy supply, 2014
OECD countries
Source: Organisation for Economic Co-operation and Development
Notes:
- Renewable energy is defined as the contribution of renewables to total primary energy supply (TPES). Renewables include the primary energy equivalent of hydro (excluding pumped storage), geothermal, solar, wind, tide and wave sources. Energy derived from solid biofuels, biogasoline, biodiesels, other liquid biofuels, biogases and the renewable fraction of municipal waste are also included.
- The countries with the highest and lowest values along with the countries that have the same or similar values to the UK have been labelled in the chart.
Download this image Figure 7: Contribution of renewables to primary energy supply, 2014
.png (10.0 kB) .xls (1.8 MB)
Recycling rate of municipal waste
According to data from OECD, 44% of the UK’s municipal waste was recycled or composted4 in 2014, the same proportion as Denmark. This was above the OECD average of 34%. The country with the highest proportion of recycled or composted municipal waste was Germany (64%). The countries with the lowest proportions were Turkey (0%) and Mexico (5% in 2012).
Notes for “The natural environment”
- Data refer to total emissions of CO2 (emissions from energy use and industrial processes, for example, cement production), CH4 (methane emissions from solid waste, livestock, mining of hard coal and lignite, rice paddies, agriculture and leaks from natural gas pipelines), nitrous oxide (N2O), hydrofluorocarbons (HFCs), perfluorocarbons (PFCs), sulphur hexafluoride (SF6) and nitrogen trifluoride (NF3). Data exclude indirect CO2.
- The units of measure in this indicator are terrestrial protected areas as well as marine protected areas in territorial waters (up to 12 nautical miles from the coast). The International Union for Conservation of Nature (IUCN) defines a protected area as “a clearly defined geographical space, recognized, dedicated and managed, through legal or other effective means, to achieve the long-term conservation of nature with associated ecosystem services and cultural values” (Dudley, 2008). For more information see Millennium Development Goals Indicators.
- Renewable energy is defined as the contribution of renewables to total primary energy supply (TPES). Renewables include the primary energy equivalent of hydro (excluding pumped storage), geothermal, solar, wind, tide and wave sources. Energy derived from solid biofuels, biogasoline, biodiesels, other liquid biofuels, biogases and the renewable fraction of municipal waste are also included. Read more on renewable energy.
- When interpreting these data, it should be noted that definitions and measurement methods vary among countries, and that inter-country comparisons require careful interpretation. For more information on each country’s treatment and disposal method used see ‘Municipal Waste Countries’ Metadata’.
13. Conclusion
This article has presented evidence of cross-country differences across 34 measures of well-being which are similar to those adopted as part of the UK’s Measuring National Well-being programme. Among the Organisation for Economic Co-operation and Development (OECD) and European Union (EU) countries, quality of life varies widely according to these measures. The UK tends to rank at or near the OECD or EU average for each indicator and rarely appears at either the top or bottom of the rankings. This suggests that while the UK has strength on which to build, there is also room for improve in delivering a high quality of life for its citizens.
Nôl i'r tabl cynnwys14. Sources used in International comparisons, 2017
European Quality of Life Survey
International Institute for Democracy and Electoral Assistance
Organisation for Economic Co-operation and Development
United Nations Statistics Division
Nôl i'r tabl cynnwys15. OECD countries and member states of the EU
The Organisation for Economic Co-operation and Development (OECD)
The OECD is an international economic organisation of 35 countries, founded in 1961 to stimulate economic progress and world trade. It is a forum of countries describing themselves as committed to democracy and the market economy, providing a platform to compare policy experiences, seeking answers to common problems, identify good practices and coordinate domestic and international policies of its members.
OECD member countries are: Australia, Austria, Belgium, Canada, Chile, Czech Republic, Denmark, Estonia, Finland, France, Germany, Greece, Hungary, Iceland, Ireland, Israel, Italy, Japan, Korea (South Korea), Latvia, Luxemburg, Mexico, Netherlands, New Zealand, Norway, Poland, Portugal, Slovakia, Slovenia, Spain, Sweden, Switzerland, Turkey, the UK and the United States.
The European Union
The EU was created on 1 November 1993, when the Maastricht Treaty came into force. It encompasses the old European Community (EC) together with 2 intergovernmental “pillars” for dealing with foreign affairs and with immigration and justice. The European Union consists of 28 member states (EU–28), where the EU–27 is referred to in this article, Croatia is not included.
The 28 member states are as follows: Austria, Belgium, Bulgaria, Croatia, Cyprus, Czech Republic, Denmark, Estonia, Finland, France, Germany, Greece, Hungary, Ireland, Italy, Latvia, Lithuania, Luxembourg, Malta, Netherlands, Poland, Portugal, Romania, Slovakia, Slovenia, Spain, Sweden, and the UK.
Nôl i'r tabl cynnwys