Cynnwys
- Introduction
- Improved migration statistics
- Migration statistics
- International student migration
- Using administrative data sources to improve migration stocks statistics
- Estimates of the very old
- National life tables
- City Group on Ageing
- Sexual identity in the UK, 2016
- Overview of the UK population release
- Living abroad series
- Longitudinal study
- Update on research into improving population statistics
- Back-series coming for mid-year population and small area population estimates
- Coming soon
- Subscribe for updates
1. Introduction
Welcome to the autumn edition of the Population statistics newsletter.
Migration statistics make up a large proportion of this edition with the Migration Statistics Quarterly Report (MSQR) estimating net migration was down 81,000 in the year ending March 2017 compared with the year ending March 2016. More than half of this change can be accounted for by a decrease in net migration of EU citizens (down 51,000). There are two interactive migration tools to explore as well as an article on the latest research update on international student migration.
Estimates of the very old and the latest National life tables, which showed that the rate of increase in life expectancy in the UK has slowed in recent years, have been released. Also of interest is the Sexual identity release, which showed an increase in the proportion of respondents who identified as lesbian, gay or bisexual (LGB) between 2015 and 2016.
We have also published six reports in a ‘Living abroad’ series looking at UK citizens living elsewhere in the European Union in comparison with each country's citizens living in the UK.
Our demographic analysis team have also hosted an international seminar to help lay the groundwork for the creation of a Titchfield City Group on Ageing and Age-disaggregated Data.
We are currently assessing the user need for estimates of the population who are in a marriage between same-sex couples, specifically whether separate estimates from the total married population are required for analysis. If you have a user need for these data, please let us know by completing our online survey by 24 October 2017.
Nôl i'r tabl cynnwys2. Improved migration statistics
In September 2017 we held a Population and Public Policy Forum with a focus on the need for improved migration statistics. More than 60 stakeholders attended; experts from government departments, academia and think tanks.
A presentation from Jonathon Portes from Kings College London gave the clear message that Office for National Statistics (ONS) must use new data to create clear stories that inform the debates that matter to people; not just create more statistics. This set the tone for other presentations and the questions and answers session.
After the forum Iain Bell, the Deputy National Statistician, concluded, “We are aware of the need to change the way in which we publish our outputs, open and receptive to challenge and offers of collaboration. The strong sense of willingness among attendees was striking and we are confident that ONS can move forward within this community to make improvements.” The full blog post is available.
Nôl i'r tabl cynnwys3. Migration statistics
On 24 August 2017, we published the latest Migration Statistics Quarterly Report (MSQR). The Statistician’s comment from the releases was as follows:
“Net migration in the year to March 2017 was +246,000, a decrease of 81,000 compared with the previous year, two-thirds of this was due to EU net migration and mainly EU8. The net migration change was driven by an increase in emigration, mainly for EU citizens and in particular EU8 citizens, and a decrease in immigration across all groups.
“International migration for work remains the most common reason for migration with people becoming increasingly more likely to move to the UK or overseas only with a definite job than to move looking for work.
“These results are similar to 2016 estimates (published in May 2017) and indicate that the EU referendum result may be influencing people’s decision to migrate into and out of the UK, particularly EU and EU8 citizens. It is too early to tell if this is an indication of a long-term trend.”
Table 1: Latest changes in migration, UK, year ending March 2016 and year ending March 2017
| thousands | ||||||||||||||||
| YE Mar 2016 | 95 % CI | YE Mar 2017 | 95% CI | Difference | ||||||||||||
|---|---|---|---|---|---|---|---|---|---|---|---|---|---|---|---|---|
| Net migration | 327 | +/-39 | 246 | +/-42 | - 81* | |||||||||||
| Immigration | 638 | +/-33 | 588 | +/-35 | -50* | |||||||||||
| Emigration | 311 | +/-21 | 342 | +/-23 | 31* | |||||||||||
| Source: Office for National Statistics, Long-Term International Migration | ||||||||||||||||
| Notes: | ||||||||||||||||
| 1. The estimates given are the sum of the EU, non-EU and British citizenship groupings. | ||||||||||||||||
| 2. 2016 and 2017 estimates are provisional. | ||||||||||||||||
| 3. Figures are rounded to the nearest thousand. Figures may not sum due to rounding. | ||||||||||||||||
| 4. CI is Confidence Interval. Further information on confidence intervals can be found in the MSQR Information for Users. | ||||||||||||||||
| 5. YE is year ending. | ||||||||||||||||
| 6. Statistically significant change at the 5% level is indicated by an asterisk. | ||||||||||||||||
Download this table Table 1: Latest changes in migration, UK, year ending March 2016 and year ending March 2017
.xls (29.2 kB)UK population by country of birth and nationality
Of the usually resident population in the UK, around 1 in 7 were born abroad and 1 in 11 had non-British nationality in 2016. Poland is the most common non-UK country of birth and Polish the most common non-British nationality of UK residents.
Embed code
Try our quiz.
Embed code
Notes:
It is important to understand that these data sources measure different things; some measure flows and some measure stocks. There are definitional and coverage differences between the data sources and as such they are not directly comparable. More information is provided in the Comparing sources of international migration statistics note.
Net migration is the balance between immigration (those entering the UK for a year or more) and emigration (those leaving the UK for a year or more).
The Short-Term International Migration (STIM) data in this release is based on the United Nations (UN) definition of a short-term migrant – “a person who moves to a country other than that of his or her usual residence for a period of at least 3 months but less than a year (12 months), except in cases where the movement to that country is for purposes of recreation, holiday, visits to friends or relatives, business, medical treatment or religious pilgrimage”.
GP registration data excludes those migrants who move to a different local authority and register with a GP there, as they will only be registered as a migrant upon initial arrival to the UK, not when they subsequently move within the UK.
We have also published a further visual migration tool entitled How much does the non-British population vary across the UK?
Nôl i'r tabl cynnwys4. International student migration
On 24 August 2017, the Migration Analysis and Development of Sources team published the latest research update on international student migration. This includes a summary note that aims to explain to users of our published migration statistics what we have learned from our work on international student migration since our last research update. A technical paper accompanies that summary, and sets out important findings from our analysis. For this research, we have been working closely with other government departments on new analysis based on administrative data sources, as well as collaborating with the Centre for Population Change and Universities UK on a new Survey of Graduating International Students.
Figure 1 was published as part of our technical paper. This summarises our analysis of Home Office Exit Check data and shows the outcomes for a cohort of non-EU international students who held a Tier 4 study visa that expired in 2015 to 2016. We looked at whether this cohort had departed the UK and by linking a further 12 months of travel event data we could also see the number that subsequently returned to the UK. From this we were able to identify those who emigrated (did not return to the UK within 12 months), those who returned within 12 months, and those with no initially identified departure.
Figure 1: Outcomes for non-EU students with a visa expiry date between 8 April 2015 and 7 April 2016, UK

Source: Office for National Statistics Analysis of Exit Checks Data
Download this image Figure 1: Outcomes for non-EU students with a visa expiry date between 8 April 2015 and 7 April 2016, UK
.PNG (128.6 kB)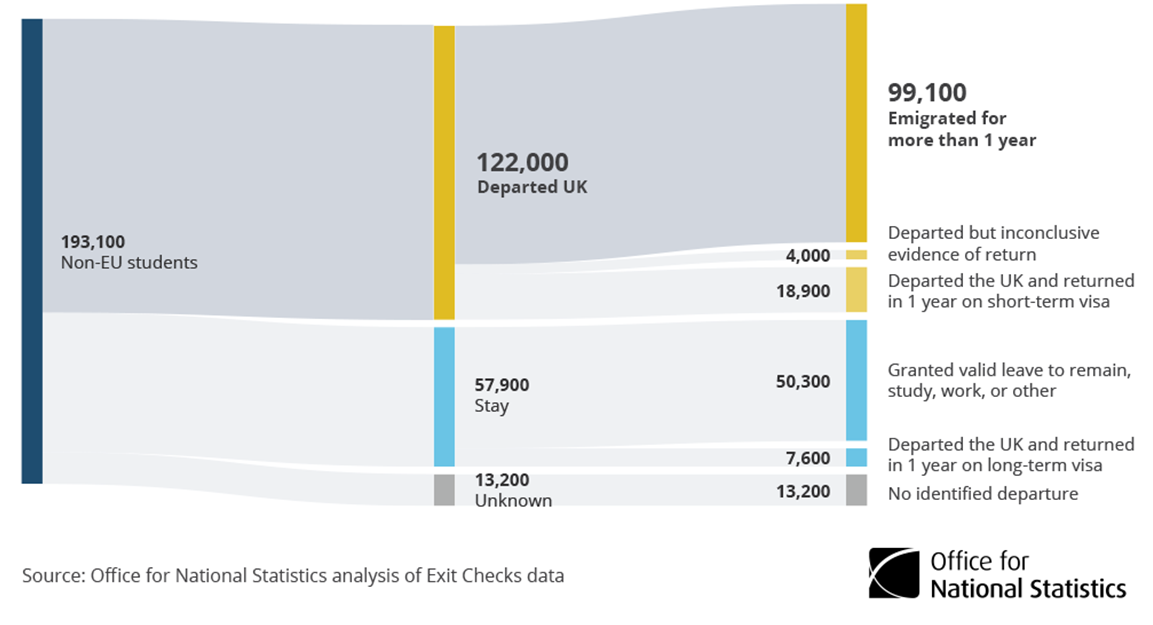
The main findings from our research include:
- it remains legitimate to look at immigration by reason for those migrating to the UK, and emigration by original reason for immigration, but the data on those leaving is based on asking people to recall their original reason for arriving and is often asked when their intentions to return are uncertain; users should therefore take caution in over-interpreting emigration by reason for originally coming to the UK
- the work concludes that looking at net migration without full consideration of the challenges of measuring emigration by original reason could be misleading – using current methods, net migration by reason for arrival is not a robust statistic; we would caution users from subtracting emigration after study numbers from immigration to study numbers without full consideration of the issues set out here
- we will work with statisticians across government to continue to improve migration statistics, and in particular to develop a robust approach to measuring net migration by reason, but in the meantime we should no longer publish breakdowns of net migration by reason as these do not reflect the complexities of people’s lives
5. Using administrative data sources to improve migration stocks statistics
The February 2017 release, International migration data and analysis: improving the evidence, outlined the need to use admin data sources to understand migrant stocks and activity on a local authority level, as well as the need for understanding the impact international migration, from both within and outside the European Economic Area (EEA), has on the UK economy. The Migration Analysis and Development of Sources (MADS) team are currently undertaking research to deliver better migration statistics using linked admin data sources.
On 21 September 2017, a public policy forum was held by Deputy National Statistician, Iain Bell, who outlined his vision for improving migration statistics using both the Digital Economy Act (DEA) 2017 and linked administrative data sources. The forum was followed by two blog posts from Iain (please see Bringing ‘Better Statistics, Better Decisions’ to life in Population and Public Policy Statistics and ONS forum signals new era for migration statistics). The slideshow presented at the public policy forum was made available in those blogs and contained a proposed timeline for the data linkage work, up until the end of 2019 (see Table 2).
Table 2: Timeline for data linkage work up until the end of 2019, UK
| Date | Topic | Additional Admin Sources |
|---|---|---|
| Late 2017 | Work & Family visa analysis providing better evidence on travel and migration patterns of non-EU nationals | Exit Check Data |
| 2018 | EU Nationals travel and migration patterns - How do EU citizens interact with administrative systems in the UK and what can we learn about their movements, to supplement existing analysis? | HMRC Real Time Information, DWP benefits data, Home Office Borders data |
| Mid 2018 | How different groups of international migrants impact the economy, building on available evidence | Migrant Workers Scan, Benefits and Income Data |
| Autumn 2018 | Experimental migration statistics using admin data as the core | All available sources, particularly Patient Registers and Customer Information System |
| Autumn 2018 | Consultation with migration statistics users on the shape that a new administrative based system would take | |
| Late 2018 | International migrant use of Health Services, and labour supply in the Health Sector - building on information already available across the public sector | NHS data on GP registrations, and hospital interactions, in addition to the HMRC sources above, augmented with data for devolved administrations where available |
| Late 2018/early 2019 | International migrant use of Education Sector, and labour supply in the Education Sector - building on information already available across the public sector | DfE School Census, Longitudinal education outcomes, in addition to the HMRC sources above, augmented with data for devolved administrations where available. |
| 2019 | Administrative Sources as core to Migration Statistics | Linked data system based on all available sources. |
| Source: Office for National Statistics | ||
Download this table Table 2: Timeline for data linkage work up until the end of 2019, UK
.xls (29.2 kB)6. Estimates of the very old
On 27 September 2017 we published Estimates of the very old (including centenarians) for 2002 to 2016. These are estimates of the population aged 90 and over by single year of age up to the age of 105 and over, available for the UK, England and for Wales. The National Records of Scotland (NRS) and the Northern Ireland Statistics and Research Agency (NISRA) publish equivalent estimates for Scotland and Northern Ireland respectively.
The main points were:
- the population aged 90 and over has grown more rapidly than most younger ages in recent years but it remains a small part of the total UK population at around 1%
- historical birth patterns that resulted in rapid ageing and growth of the 90 and over population in recent years have now largely played out and ageing and growth have returned to a longer-term average
- the proportion of men in the UK population aged 90 and over continues to rise
- an estimated 14,910 people were aged 100 or over (centenarians) in the UK in 2016, or 2 for every 10,000 people; this is a rise from 14,520 in 2015
7. National life tables
On the 27 September 2017 we also published our latest National life tables (2014 to 2016). These showed that the rate of increase in life expectancy in the UK has slowed in recent years. In 2014 to 2016, improvements in life expectancy were higher than in 2013 to 2015 although they remained small with life expectancy at birth increasing by 0.1 years for both sexes to 79.2 years for males and 82.9 years for females. A male born in 2014 to 2016 had a 21% chance, and a female a 32% chance, of surviving to at least the age of 90 years.
Nôl i'r tabl cynnwys8. City Group on Ageing
At the end of August 2017, we hosted an international seminar to help lay the groundwork for the creation of a Titchfield City Group on Ageing and Age-disaggregated Data. City Groups are informal groups of experts, primarily from national statistical agencies, established through the United Nations Statistical Commission to tackle statistical methodological issues. The global pledge to “leave no-one behind” of the Sustainable Development Goals 2030 Agenda has highlighted the importance of obtaining accurate statistics relating to older people throughout the world.
The event brought together relevant experts and officials from national statistical offices, UN Agencies, government ministries, civil society, academia and the private sector. This provided a hugely successful platform for discussion and sharing of best practices in the field of age-disaggregated data and statistics on ageing.
A series of presentations from international leaders in the field of age-related data served as a springboard for discussion, as we explored the challenges of population-ageing and related policy issues all over the world. This included how ageing impacts on men and women differently. We examined information requirements, data sources, gaps and innovation.
An important theme to emerge was that older people are not homogenous, but grouping those in the older ages together (for example, those aged 70 and over) inherently assumes that those people are similar. This is misleading because people age in different ways, and ageing presents different challenges and health needs at different (older) ages and in different countries and cultures. It's a problem because without sufficient disaggregated data on older people, older people's needs are invisible.
We are now drawing on recommendations from the seminar to prepare documentation to present to the UN Statistical Commission in March 2018. We hope to have news of their endorsement and the formal establishment of the Titchfield City Group on Ageing and Age-disaggregated Data early in 2018.
Nôl i'r tabl cynnwys9. Sexual identity in the UK, 2016
On 4 October 2017 we published Sexual identity in the UK, 2016. Sexual identity statistics are broken down by age, sex, marital status, ethnicity and National Statistics Socio-economic Classification (NS-SEC). The proportion of people who identified as lesbian, gay or bisexual (LGB) saw a statistically significant increase from 1.7% in 2015 to 2.0% in 2016.
Other main points were:
- the population aged 16 to 24 years were the age group most likely to identify as LGB in 2016 (4.1%)
- more males (2.3%) than females (1.6%) identified themselves as LGB in 2016
- the population who identified as LGB in 2016 were most likely to be single, never married or civil partnered, at 70.7%
10. Overview of the UK population release
The latest edition of the Overview of the UK population was published on 21 July 2017. It focused on the ageing population in the UK and included interactive maps for a number of measures. It also compared the position in the UK with other countries from the EU and European Free Trade Association.
Nôl i'r tabl cynnwys11. Living abroad series
We have published six reports in a series looking at UK citizens living elsewhere in the EU in comparison to each country's citizens living in the UK. We are currently working on a final summary report, which will be published later this year. The series “Living abroad: migration between Britain and...” has so far featured:
- Spain, published on 29 June 2017
- the EU8, published on 10 July 2017 – the “EU8” are the Czech Republic, Estonia, Hungary, Latvia, Lithuania, Poland, Slovakia and Slovenia
- France, published on 8 August 2017
- Ireland, published on 21 September 2017
- Germany, published on 3 October 2017
- the EU2, published on 11 October 2017 – the “EU2” are Bulgaria and Romania
12. Longitudinal study
The latest version of the Longitudinal Study (LS) Research Database was made available to researchers on 1 August 2017. The database now includes birth, death and cancer events up to the end of 2015, and NHS registration events up to March 2017.
For more information:
- UK-based researchers from the academic, public and voluntary sectors should contact the Centre for Longitudinal Study Information and User Support (CeLSIUS)
- all other researchers should contact ONS via the LS Development Team at LongitudinalStudy@ons.gov.uk
13. Update on research into improving population statistics
On 25 August 2017 we published a research paper on Population estimates by characteristics, describing a simple method for producing population estimates by country of birth, nationality and ethnic group. An update on our research into improving our standard population statistics was published on 11 October 2017.
Nôl i'r tabl cynnwys14. Back-series coming for mid-year population and small area population estimates
We will be revising the methodology behind the annual mid-year population estimates in spring 2018. A revised back-series incorporating the revised methods for mid-2012 to mid-2016 will be published.
The three main changes affect internal migration, the distribution of international emigration and the movement of dependants of foreign armed forces personnel. Details of these changes can be found in Appendix 2 of the Mid-year estimates 2016 methodology guide.
The following releases are planned to take account of these changes:
- mid-2012 to mid-2016 estimates and an explanation of the impact in spring 2018
- 2016-based sub-national population projections taking full account of the changes in the back-series in May 2018
- mid-2017 population estimates using the updated methods in June 2018
- mid-2017 small area population estimates and a back series covering 2012 to 2016 in autumn 2018
Please contact pop.info@ons.gov.uk if you wish to receive additional updates before the publication of the back-series, or with any additional queries.
Nôl i'r tabl cynnwys15. Coming soon
26 October 2017 – Small area population estimates: 2016
26 October 2017 – 2016-based national population projections for UK and constituent countries broken down by sex and single year of age
8 November 2017 – Families and households: 2017
24 November 2017 – Childbearing for women born in different years: 2016
30 November 2017 – Migration Statistics Quarterly Report
Other planned releases for the coming months include a summary paper for the “Living abroad” series and a further update on gender identity, with final publishing dates released a few weeks in advance.
Nôl i'r tabl cynnwys16. Subscribe for updates
Please follow our Population Statistics Division statistician on our new Twitter account @RichardPereira_ONS for the latest in population statistics news and updates. We now have a new Twitter account for migration @JayLindop_ONS.
Subscribe to the population statistics newsletter:
- to subscribe to our newsletter please send an email to pop.info@ons.gov.uk with the subject title: “Subscribe to ONS population statistics newsletter”
- to unsubscribe, send an email to pop.info@ons.gov.uk with the subject title: “Unsubscribe from ONS population statistics newsletter”