Cynnwys
- Main Points
- Statistician’s comment
- Things you need to know about this release
- Married people are the largest group in the population aged 16 and over
- Living in a couple is the most popular living arrangement for those aged 16 and over
- The percentage of the population who are married has declined while the percentage who are single has increased
- The population who are single, never married or civil partnered are increasingly cohabiting
- A larger percentage of the population in England are married compared with Wales
- Under 30s more likely to be “not living in a couple” than over 30s
- Links to related statistics
- What has changed within this publication?
- Quality and methodology
1. Main Points
There were 24.1 million people in England and Wales who were married in 2016; this was 50.9% of the population aged 16 and over.
In 2016, around 0.2% of the married population were in a marriage between same-sex couples; a larger proportion of this population were male (57.7%) compared with female (42.3%).
A larger percentage of the population in England (51.1%) were married in 2016 compared with Wales (50.1%).
The majority (61.0%) of the population aged 16 and over in England and Wales were living in a couple in 2016.
2. Statistician’s comment
“In England and Wales, being married continues to be the most common marital status for those age 16 and over in 2016. This is despite the proportion of the population who are married decreasing by 3.9 percentage points since 2002 and the proportion of the population who are single increasing. The population who are in a marriage between same-sex couples has more than doubled since 2015.”
Emily Knipe, Population Statistics Division, Office for National Statistics.
Follow Population Statistics Division on Twitter @PaulVickers_ONS.
Nôl i'r tabl cynnwys3. Things you need to know about this release
Marital status indicates whether a person is legally married or not. This publication uses five categories of legal marital status:
single, never married or civil partnered
married, including separated (this category includes those in both opposite-sex and same-sex marriages)
civil partnered, including separated
divorced, including legally dissolved civil partners
widowed, including surviving civil partners
Living arrangements indicate whether people are living with a partner or not, irrespective of their legal marital status.
Those aged under 16 are all considered to be single in line with the legal age of marriage in England and Wales.
This bulletin focuses on the population aged 16 and over.
This publication does not include estimates of couples who are living apart together (LAT). The Quality and Methodology Information report provides further detail.
The estimates presented within the dataset are provided with confidence intervals (around the survey component of the estimate) and also an indication of the size of the coefficient of variation (for the survey component of the estimate). These quality measures summarise the levels of uncertainty associated with survey estimates. You are advised to consult the quality measures when interpreting the estimates.
Nôl i'r tabl cynnwys4. Married people are the largest group in the population aged 16 and over
The majority (50.9%) of the population aged 16 and over in 2016 were married. The next largest group within the population were single, never married or civil partnered (34.6%). The population who were divorced or widowed made up a smaller proportion of the total population at 8.0% and 6.4% respectively. The smallest group within the population were those who were civil partnered, making up 0.2% of the population aged 16 and over in 2016.
Table 1: Marital status (ages 16 and over), 2016, England and Wales
| England and Wales | |||||
| Single1 | Married | Civil partnered | Divorced | Widowed | |
|---|---|---|---|---|---|
| Total number | 16,348,397 | 24,063,468 | 88,566 | 3,769,205 | 3,025,402 |
| Percentage of population aged 16 and over | 34.6% | 50.9% | 0.2% | 8.0% | 6.4% |
| Source: Office for National Statistics | |||||
| Notes: | |||||
| 1. See the 'Things you need to know' section for details about each marital status category. | |||||
Download this table Table 1: Marital status (ages 16 and over), 2016, England and Wales
.xls (26.1 kB)The population in a marriage between same sex couples accounted for 0.2% of the total married population of England and Wales, up from 0.1% in 2015. In 2016 the number of people aged 16 and over in a same sex marriage was 60,081 in England and Wales, more than double the 2015 estimate of 26,087 people. In 2016, males accounted for 57.7% (34,647) of the population in a marriage between same sex couples and females the remaining 42.3% (25,434), a shift from 2015 where 50.4% of the population in a marriage between same sex couples were male and 49.6% were female.
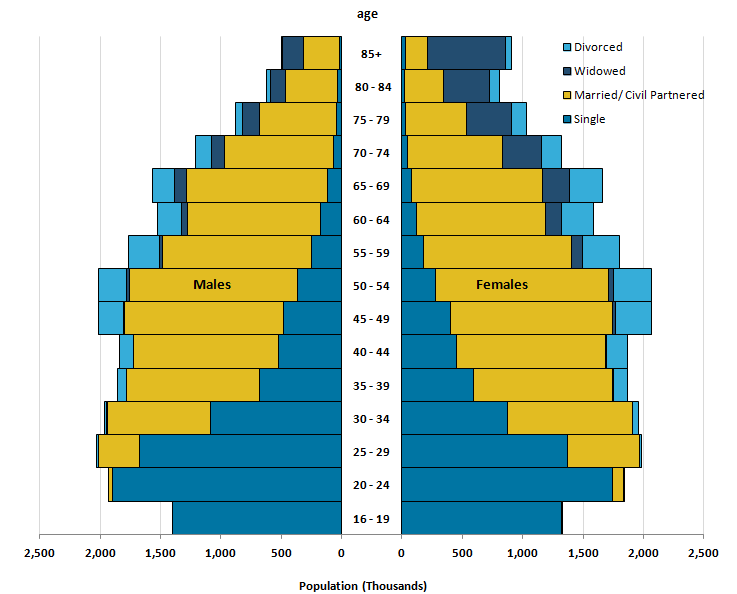
Figure 1: Population estimates (aged 16 and over) by marital status, age group and sex, 2016
England and Wales
Source: Office for National Statistics
Notes:
- See the "Things you need to know" section for details about each marital status category.
- Married and civil partnered are combined in this chart due to the small numbers of civil partners.
Download this image Figure 1: Population estimates (aged 16 and over) by marital status, age group and sex, 2016
.png (17.6 kB) .xls (20.5 kB)
In 2016, the female population who were divorced remained larger than the male divorced population. This could be associated with the remarriage rates (number marrying per 1,000 widowed or divorced population) seen for males and females. In 2014, the remarriage rate was 26.2 per 1,000 for men and 12.8 per 1,000 for women, suggesting more men tend to re-marry compared with women. Women may choose to remain without a partner or cohabit rather than remarry.
The difference in the number of widowed males and females, especially at older ages, in 2016 could be explained by women having higher life expectancy than men, and women traditionally marrying an older spouse.
In England and Wales, 51.9% of men and 49.9% of women aged 16 and over were married in 2016. Being married was the most common marital status for women aged between 30 to 34 and 80 to 84 in 2016. For men, being married was the most common marital status after the age group 30 to 34. A marital status of single, never married was most common for those aged under 30.
Nôl i'r tabl cynnwys5. Living in a couple is the most popular living arrangement for those aged 16 and over
The majority (61.0%) of the population aged 16 and over were living in a couple in 2016. Those who were living in a couple were most likely to be married or civil partnered.
The remainder of the population aged 16 and over in 2016 were not living in a couple (39.0%). Those who were not living in a couple were most likely to be single, never married or civil partnered.
Table 2: Living Arrangements (ages 16 and over), 2016
| England and Wales | ||||||
| Living in a couple | Not living in a couple | |||||
|---|---|---|---|---|---|---|
| Married or civil partnered | Cohabiting - never married or civil partnered | Cohabiting- previously married or civil partnered | Never married or civil partnered | Previously married or civil partnered1 | ||
| Total number | 22,933,388 | 4,613,434 | 1,304,308 | 11,727,501 | 6,716,407 | |
| Percentage of population aged 16 and over | 48.5% | 9.8% | 2.8% | 24.8% | 14.2% | |
| Source: Office for National Statistics | ||||||
| Notes: | ||||||
| 1. People who are married or civil partnered but whose partner is away from the household because they live away for work, are in prison or in a care home, will appear in this category. | ||||||
Download this table Table 2: Living Arrangements (ages 16 and over), 2016
.xls (26.6 kB)
Figure 2: Population estimates (aged 16 and over) by living arrangements, age group and sex, 2016
England and Wales

Source: Office for National Statistics
Notes:
- People who are married or civil partnered but whose partner is away from the household because they live away for work, are in prison or in a care home, will appear in the "not living in a couple: previously married or civil partnered" category.
Download this image Figure 2: Population estimates (aged 16 and over) by living arrangements, age group and sex, 2016
.png (17.2 kB) .xls (29.2 kB)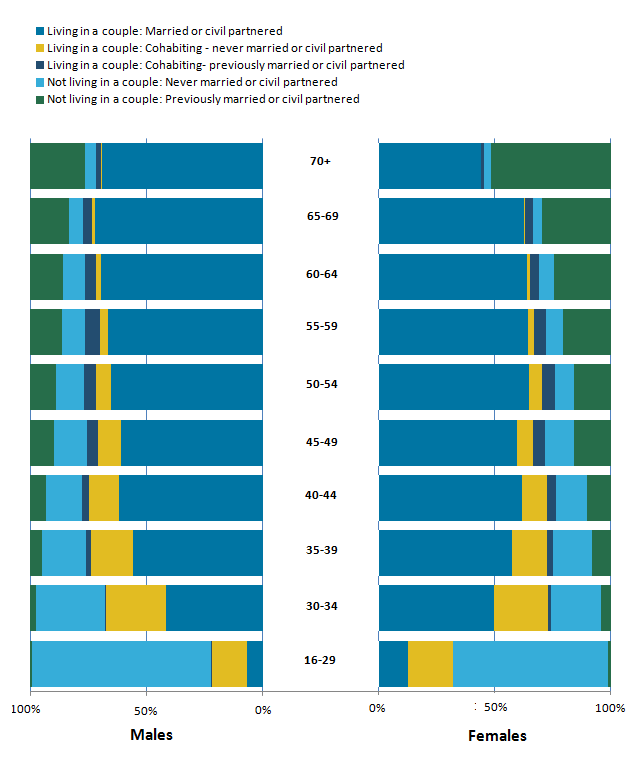
At ages 16 to 29 the majority of males and females were “not living in a couple: never married or civil partnered”, at 77.4% and 66.9% respectively. They were likely to be living with their parents but could have been in relationships outside of the household. In 2016, there was a difference between males (15.2%) and females (19.3%) aged 16 to 29 who were “living in a couple: cohabiting – never married or civil partnered”. This could be associated with women choosing to live with partners older than themselves.
In 2016, the biggest difference between males and females could be seen in the “not living in a couple” category, where a larger percentage of women, especially at the oldest ages, were “not living in a couple: previously married or civil partnered”. This is likely to be due to the larger number of women who were divorced or widowed compared with men.
Nôl i'r tabl cynnwys6. The percentage of the population who are married has declined while the percentage who are single has increased
Figure 3: Percentages of people (aged 16 and over) by selected marital status, 2002 to 2016
England and Wales
Source: Office for National Statistics
Notes:
- Data in figures 3 and 4 have been plotted separately so that trends in the Data can be clearly seen.
Download this chart Figure 3: Percentages of people (aged 16 and over) by selected marital status, 2002 to 2016
Image .csv .xlsFigure 3 shows that the percentage of people aged 16 and over who are married has decreased over time from 54.8% in 2002 to 50.9% in 2016, up from 50.6% in 2015. The small increase in 2016 could be associated with an increase in the number of people in marriages between same-sex couples.
The percentage of people aged 16 and over who are single has increased over time from 29.6% in 2002 to 34.6% in 2016. This coincides with an increase in people cohabiting who are never married or civil partnered (Figure 5) as cohabitation has become more common as an alternative to marriage, especially at younger ages. The rise in single population also reflects more people in middle age groups remaining unmarried.
Figure 4: Percentages of people (aged 16 and over) by selected marital status, 2002 to 2016
England and Wales
Source: Office for National Statistics
Notes:
- Data in figures 3 and 4 have been plotted separately so that trends in the Data can be clearly seen.
Download this chart Figure 4: Percentages of people (aged 16 and over) by selected marital status, 2002 to 2016
Image .csv .xlsThe percentage of the population aged 16 and over who were divorced has increased steadily over time; this could be associated with the decrease in re-marriages over time. In 2016, the percentage of the population aged 16 and over who were widowed was 6.4%; this fell from 8.1% in 2002 (Figure 4). The fall could be associated with continuing increases in life expectancy, particularly for men, meaning fewer women are widowed at older ages. In addition, if the married population are living longer than before, they may divorce rather than become widowed.
Nôl i'r tabl cynnwys7. The population who are single, never married or civil partnered are increasingly cohabiting
In 2002, people who were “cohabiting – never married or civil partnered” represented 6.8% of the population; this had increased to 9.8% by 2016 (Figure 5). This may be explained by an increasing trend to cohabit instead of marry, or to cohabit before marriage, particularly at younger ages. Cohabiting couple families are the fastest growing family type in the UK (2004 to 2016).
Figure 5: Percentages of people (aged 16 and over) by living arrangements (excluding ‘living in a couple: married or civil partnered’), 2002 to 2016
England and Wales
Source: Office for National Statistics
Notes:
- People who are "living in a couple: married or civil partnered’" have not been included in the graph for presentation reasons, so that trends in the smaller categories can be seen more clearly.
- People who are married or civil partnered but whose partner is away from the household because they live away for work, are in prison or in a care home, will appear in the "not living in a couple: previously married or civil partnered" category.
Download this chart Figure 5: Percentages of people (aged 16 and over) by living arrangements (excluding ‘living in a couple: married or civil partnered’), 2002 to 2016
Image .csv .xlsIn 2002, people who were “not cohabiting – never married or civil partnered” represented 22.9% of the population. By 2015 this had increased to around one-quarter of the population at 25.0% and in 2016, this figure was at 24.8%. This could be explained by younger people delaying entering cohabiting relationships or delaying leaving the family home.
Nôl i'r tabl cynnwys8. A larger percentage of the population in England are married compared with Wales
In 2016 in England, 34.7% of the population had a marital status of single, never married or civil partnered; this was the second-largest marital status behind married.
Table 3: Marital status (ages 16 and over), 2016, England
| Table 3: Marital status (ages 16 and over), 2016, England | |||||
| Single1 | Married | Civil partnered | Divorced | Widowed | |
|---|---|---|---|---|---|
| Total number | 15,503,903 | 22,851,332 | 87,039 | 3,557,401 | 2,739,292 |
| Percentage of population aged 16 and over | 34.7% | 51.1% | 0.2% | 8.0% | 6.1% |
| Source: Office for National Statistics | |||||
| Notes: | |||||
| 1. See the 'Things you need to know' section for details about each marital status category. | |||||
Download this table Table 3: Marital status (ages 16 and over), 2016, England
.xls (17.9 kB)A larger proportion of males in England had a marital status of single, never married or civil partnered at 38.1% compared with just 31.4% of females in 2016.
Figure 6: Percentages of males and females (aged 16 and over) by selected marital status, 2002 to 2016
England
Source: Office for National Statistics
Notes:
- See the "Things you need to know" section for details about each marital status category.
Download this chart Figure 6: Percentages of males and females (aged 16 and over) by selected marital status, 2002 to 2016
Image .csv .xlsIn 2016, marriage remained the largest marital status in England for the population aged 16 and over for both males and females, with 51.9% of males and 50.3% of females currently married. The percentage of the population who are married has decreased over the last 14 years and reflects the same trend that England and Wales have shown over this period (Figure 6).
A larger percentage of the population in England (51.1%) were married in 2016 compared with Wales (50.1%). In Wales, just over half (50.1%) of the population aged 16 and over were married in 2016. For males, 51.9% were married; this compared with 48.4% of females.
Table 4: Marital Status proportions by sex (aged 16 and over), 2016
| Wales | |||||
| Single1 | Married | Civil partnered | Divorced | Widowed | |
|---|---|---|---|---|---|
| All persons | 33.4% | 50.1% | 0.1% | 8.9% | 7.5% |
| Males | 37.1% | 51.9% | 0.1% | 7.7% | 3.2% |
| Females | 29.9% | 48.4% | 0.0% | 10.1% | 11.6% |
| Source: Office for National Statistics | |||||
| Notes: | |||||
| 1. See the ‘Things you need to know’ section for details about each marital status category. | |||||
Download this table Table 4: Marital Status proportions by sex (aged 16 and over), 2016
.xls (26.1 kB)
Figure 7: Percentages of people (aged 16 and over) by marital status, 2002 to 2016
Wales
Source: Office for National Statistics
Notes:
- See the "Things you need to know" section for details about each marital status category.
- Married and civil partnered are combined in this chart due to the small numbers of civil partners.
Download this chart Figure 7: Percentages of people (aged 16 and over) by marital status, 2002 to 2016
Image .csv .xlsBetween 2002 and 2016, the proportion of the population who are single in Wales has increased from 28.0% in 2002 to a high of 34.3% in 2015, whilst the proportion of people with a marital status of ‘married or Civil Partnered’ over the period has decreased from a high of 56.0% in 2003 to a low of 49.5% in 2015. Both these statuses have shown small changes in 2016; the proportion single decreased to 33.4% whilst the proportion married or Civil Partnered rose to 50.1%.
Nôl i'r tabl cynnwys9. Under 30s more likely to be “not living in a couple” than over 30s
In 2016 in England, 48.6% of the population were “living in a couple – married or civil partnered”. More males (49.7%) were “living in a couple – married or civil partnered” than females (47.5%).
Further differences between males and females in England were seen in 2016 in the “not cohabiting – previously married or civil partnered” category; 9.5% of males aged 16 and over fell into this category, whereas females were nearly double, at 18.4%. This could reflect the higher divorce rate amongst females (9.3%) compared with males (6.5%), resulting in larger numbers of divorced women.
The percentage of the population in the “not cohabiting – previously married or civil partnered” category increased with each consecutive age group, from 0.8% for 16 to 29 year olds to 30.8% for those aged 60 and over.
Figure 8: Percentages of people (aged 16 and over) by living arrangements, 2002 to 2016
England
Source: Office for National Statistics
Notes:
- People who are married or civil partnered but whose partner is away from the household because they live away for work, are in prison or in a care home, will appear in the "not living in a couple: previously married or civil partnered" category.
Download this chart Figure 8: Percentages of people (aged 16 and over) by living arrangements, 2002 to 2016
Image .csv .xlsFigure 8 shows that the largest increase was for the “cohabiting – never married or civil partnered” living arrangement. Since 2002, the proportion has increased from 6.8% in 2002 to 9.8% in 2016, rising more steadily since 2014. For both sexes, this living arrangement has become increasingly more common since 2002. For males, this has risen from 7.2% in 2002 to 10.2% in 2016 and for females, this has risen from 6.5% to 9.4% over the same time period.
In Wales in 2016, the picture was very similar to England. The majority (48.0%) of the population aged 16 and over were “living in a couple – married or civil partnered” with a higher percentage of males in this category compared with females.
Figure 9 shows that in Wales, the largest increase was for the “cohabiting – never married or civil partnered” living arrangement. Since 2002, the proportion has increased from 5.2% in 2002 to 9.2% in 2016. For both sexes, this living arrangement has become increasingly more common since 2002. For males, this has risen from 5.4% in 2002 to 9.2% in 2016 and for females, this has risen from 5.1% to 9.2% over the same time period.
Figure 9: Percentages of people (aged 16 and over) by living arrangements, 2002 to 2016
Wales
Source: Office for National Statistics
Notes:
- People who are married or civil partnered but whose partner is away from the household because they live away for work, are in prison or in a care home, will appear in the "not living in a couple: previously married or civil partnered" category.
Download this chart Figure 9: Percentages of people (aged 16 and over) by living arrangements, 2002 to 2016
Image .csv .xlsFigure 10 shows grouped living arrangement categories by age for England. These charts clearly show that in 2016, people in the older age groups (aged 30 and over) were more likely to be living in a couple, whereas in the younger age groups (aged under 30), the population were more likely to be not living in a couple. The distributions are very similar for England and for Wales.
Figure 10: Percentages of people (aged 16 and over) by grouped living arrangements, 2016
England
Source: Office for National Statistics
Notes:
- "Living in a couple" includes: married or civil partnered, cohabiting never married or civil partnered and cohabiting previously married or civil partnered.
- "Not living in a couple" includes: Not cohabiting, never married or civil partnered and not cohabiting, previously married or civil partnered.
Download this chart Figure 10: Percentages of people (aged 16 and over) by grouped living arrangements, 2016
Image .csv .xls11. What has changed within this publication?
The estimates referring to the years 2013 to 2015 have been revised following the reweighting of the Labour Force Survey (LFS) in 2016. The changes to the estimates have been minimal with the largest change of 3.74% for males aged 75 to 79 who were single in 2013.
In 2017, for the first time we have published estimates and quality measures for England and for Wales separately. A time series is available back to 2002 for the two countries. Due to small sample sizes in the survey data, the age bands presented for England and for Wales separately are wider than those presented for England and Wales combined. The age bands have been designed so that data for England and Wales can be collapsed to provide equivalent estimates.
Nôl i'r tabl cynnwys12. Quality and methodology
We have previously published population estimates by marital status only for 1971 to 2010 using a different methodology. Following a consultation in 2014 the methodology was updated. The differences in the data produced by the two methodologies are explained within the Population estimates by marital status and living arrangements: England and Wales, 2002 to 2014 statistical bulletin and within a dataset alongside the release.
The Population estimates by marital status and living arrangements Quality and Methodology Information report contains important information on:
the strengths and limitations of the data and how it compares with related data
uses and users of the data
how the output was created
the quality of the output: including the accuracy of the data
The Quality and Methodology Information report (QMI) and the Details and results of the internal review leading to changes in the methodology of Population Estimates by Marital Status report provide more detail on the new methodology.
These estimates are only available for England and Wales.
National Records of Scotland (NRS) has published equivalent estimates for Scotland up to and including estimates for mid-2008, which are produced using similar methods to the old methodology used for England and Wales. However, following a user consultation, publication of population estimates by marital status for Scotland was suspended and demand for these estimates is currently being reviewed by NRS. Further information can be found on the NRS webpage for marital status population estimates.
Population estimates by marital status for Northern Ireland are not produced, as the Northern Ireland Statistics and Research Agency (NISRA) has not identified a current user requirement for such estimates.
Population estimates by marital status and living arrangements refer to the mid-year (30 June). This is because the population estimates by marital status and living arrangements are based on the April to June quarter (Quarter 2) of the Labour Force Survey (LFS), which includes the mid-year point, and they are constrained to the mid-year population estimates.
The Marriage (Same Sex Couples) Act 2013 made provision for the marriage of same-sex couples in England and Wales from 29 March 2014 onwards. This publication provides an estimate of the number of people in a same-sex marriage by sex. Until sample sizes become large enough to produce robust estimates, data are unlikely to be available by age group. This will be reviewed annually.
Research into producing confidence intervals around population estimates is continuing; should these become available in the future, users would be able to gain an understanding of the overall accuracy of the population estimates by marital status and living arrangements rather than only the survey component.
The population estimates by marital status and living arrangements can be used in the production of marriage and divorce rates and also in the estimation of pension liabilities by insurance and pension firms.
The revisions policy for population statistics is available.
Nôl i'r tabl cynnwys