1. Key points
- National Parks in England and Wales had an average population of approximately 31,000 in mid-2012. However, populations ranged from 2,000 in Northumberland to 113,200 in the South Downs.
- The total National Park population of England and Wales increased by 2.4% over the decade to mid-2012. This compares to an increase of 7.5% for the total population of the country.
- National Parks are less densely populated than other areas of the country. The least densely populated National Park is Northumberland with 2 persons per square kilometre.
- The population of National Parks have an older age structure than England and Wales as a whole. More than 40% of the population of Exmoor and The Broads are aged 60 years or over.
- This release includes new estimates for mid-2011 and mid-2012 alongside revised estimates for mid-2002 to mid-2010.
- National Park population estimates are of particular interest to local government organisations and National Park Authorities.
2. Summary
This bulletin presents mid-year population estimates for National Parks in England and Wales. It includes estimates for mid-2011 and mid-2012, which are consistent with the results of the 2011 Census, and revised estimates for the period from mid-2002 to mid-2010. These revisions have been made to ensure the availability of a consistent time series and are consistent with the revisions made to the wider suite of small area population estimates, which were published in November 2013.
In general, small area population estimates are used by both central government departments and local authorities for a range of purposes including planning and monitoring of services; as denominators for the calculation of various rates and indicators and as a base for population projections and forecasts. Additionally, National Park population estimates are of particular interest to local government organisations and the various National Park Authorities.
Nôl i'r tabl cynnwys3. Small area population estimates
Mid-year population estimates for National Parks form part of the suite of small area population estimates for England and Wales, which are produced annually, usually approximately three to four months after the publication of the national, regional and local authority level estimates. The later timetable for the publication of these National Park estimates for mid-2002 to mid-2012 reflects the need to incorporate the results of both the 2011 Census and the revised small area estimates published in November 2013.
There are two main types of small area population estimates:
- Super Output Area (SOA) estimates – National Statistics including estimates for middle and lower layer SOAs. Mid-2012 estimates for SOAs were published on 17 October 2013.
- Estimates for other geographies – Experimental Statistics including estimates for National Parks, parliamentary constituencies and wards. Mid-2012 estimates for wards and parliamentary constituencies were published on 26 November 2013.
The National Park population estimates referred to in this bulletin reflect the results of the 2011 Census. Estimates for mid-2011 and mid-2012 are based on the census estimates and updated to reflect subsequent population change over time. The revised estimates for mid-2002 to mid-2010 have been rebased using information from the 2011 Census to identify and correct for any error that may have developed in the series over time.
The estimates are provided for the exact boundaries of the National Parks.
Nôl i'r tabl cynnwys4. Methodological information
The standard methodology for producing small area population estimates for geographies other than SOAs is based on an Output Area (OA) ‘best-fit’ approach. This means that the population of each small area is the sum of the population of the OAs which provide the best fit to the actual geographic boundaries of the area. This approach is in accordance with the Geography Policy for National Statistics published in July 2010.
However, the OA best-fit approach tends to produce poor estimates for National Parks due to their unique geography and sparse populations. Therefore these mid-year population estimates for National Parks have been produced using an alternative method which estimates the populations within the exact boundaries of the parks. This aims to provide the best information possible for use by the National Park Authorities in carrying out their responsibilities.
The population estimates for National Parks are calculated by measuring the annual change in the population of each National Park’s wider surrounding area (all OAs that fall either partially or wholly within the National Park boundaries) and using this information to estimate the annual change in the population resident within the National Park. The 2011 Census estimates of National Park populations are used as the base for these calculations.
A full description of the methods used to calculate small area population estimates, including those for National Parks, can be downloaded from the ONS website.
For further information on the quality and use of these statistics, please see the Quality and Methodology Information for Small Area Population Estimates.
Nôl i'r tabl cynnwys5. National Parks
National Parks are designated areas of protected countryside aimed at conserving the natural beauty, wildlife and cultural heritage of the area. Each National Park has a National Park Authority (NPA) responsible for conservation, planning, recreation management and fostering the social and economic wellbeing of local communities.
The Broads does not have a National Park designation but is included in this set of statistics as they are part of the National Parks family. The Broads has similar responsibilities to NPAs but with additional powers relating to navigation.
Map 1: National Parks in England and Wales

Download this image Map 1: National Parks in England and Wales
.png (194.0 kB)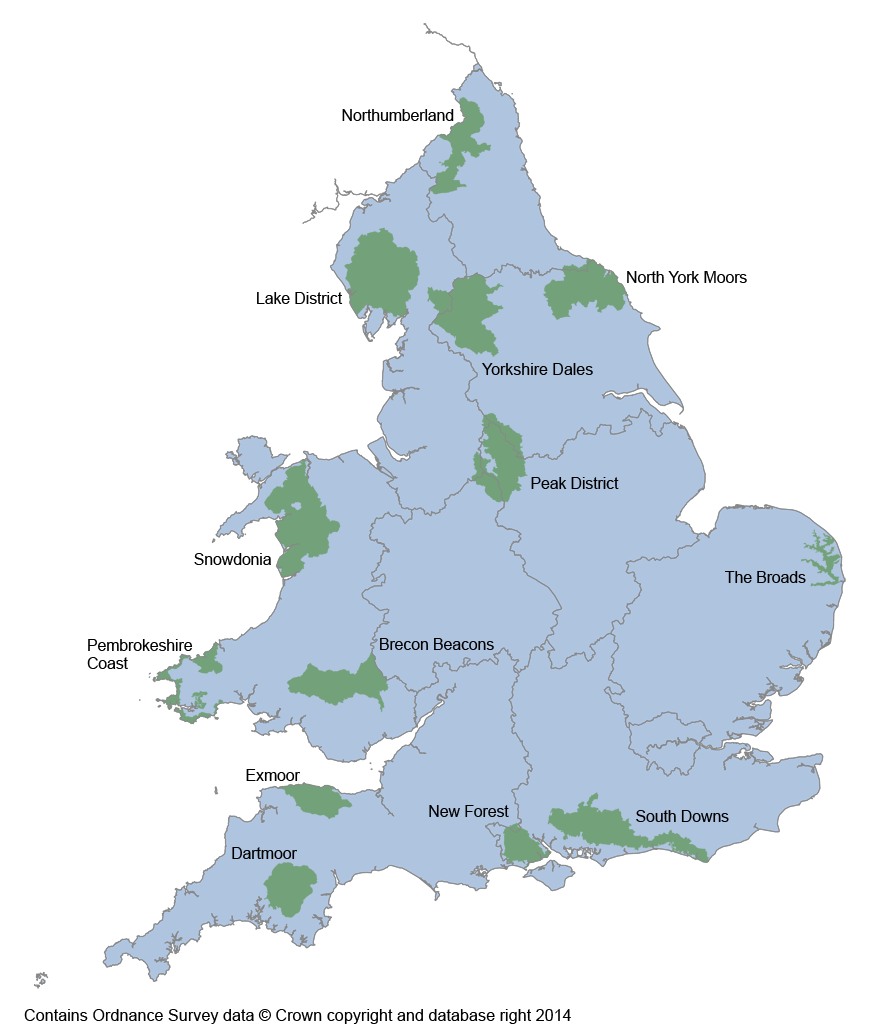
There are 13 National Parks in England and Wales (including The Broads). Two National Parks have been designated since 2002, the New Forest in 2005 and the South Downs in 2010.
Nôl i'r tabl cynnwys6. Population estimates
In mid-2012 the mean population size of National Parks in England and Wales was approximately 31,000. However, National Park population totals vary greatly, as shown in figure 1 below. The most populous National Park, the South Downs, has 113,200 people compared to only 2,000 in Northumberland National Park.
Figure 1: National Park population estimates, mid-2012
Source: Office for National Statistics
Download this chart Figure 1: National Park population estimates, mid-2012
Image .csv .xlsTable 1 below shows the population of each National Park in mid-2012 and the percentage change in population seen over the ten year period from mid-2002 to mid-2012.
Table 1: National Park population and percentage population change, mid-2002 to mid-2012
| National Park | Population (thousands) | Percentage Change | |
| Mid-2012 | Mid-2002 | Mid-2002 to Mid-2012 | |
| Pembrokeshire Coast | 22.9 | 21.4 | 7.1 |
| The Broads | 6.2 | 5.8 | 6.9 |
| South Downs | 113.2 | 106.8 | 6 |
| Brecon Beacons | 33.4 | 32.5 | 2.8 |
| Snowdonia | 25.6 | 24.9 | 2.8 |
| New Forest | 35.1 | 34.3 | 2.3 |
| Northumberland | 2 | 2 | 1.6 |
| Yorkshire Dales | 19.6 | 19.5 | 0.7 |
| Dartmoor | 33.9 | 33.8 | 0.3 |
| Peak District | 37.8 | 37.7 | 0.2 |
| Lake District | 40.4 | 41.2 | -1.9 |
| North York Moors | 23.2 | 23.9 | -2.6 |
| Exmoor | 10.2 | 10.7 | -4 |
| Source: Office for National Statistics | |||
| Notes: | |||
| 1. The New Forest and South Downs National Parks were not designated until 2005 and 2010 respectively, however estimates for mid-2002 have been produced for these areas and they are included in this analysis. | |||
Download this table Table 1: National Park population and percentage population change, mid-2002 to mid-2012
.xls (22.5 kB)Pembrokeshire Coast National Park and The Broads had the greatest percentage increases in their population over the decade to mid-2012 of 7.1% and 6.9% respectively. The Broads in particular is a sparsely populated area with a population of only 6,200 at mid-2012. By contrast the South Downs National Park, which had the third largest population increase of 6.0%, contains a number of urban areas such as Lewes, the county town of East Sussex, and the market towns of Petersfield and Midhurst.
The population of three National Parks (Exmoor, the North York Moors and the Lake District) decreased between mid-2002 and mid-2012. Exmoor had the largest percentage decrease in its population (4.0%) while the largest absolute decrease of 800 people was in the Lake District.
The total National Park population of England and Wales increased by 2.4% over the decade, compared to a 7.5% increase in the overall population of the country.
Nôl i'r tabl cynnwys7. Population density
National Parks cover 11% of the total land area of England and Wales (9% of England and 20% of Wales) but contain only 0.7% of the total population (0.6% for England and 2.7% for Wales). In mid-2012 the population density of England and Wales was 375 persons per square kilometre (411 in England and 148 in Wales). All National Parks have considerably lower population density than the average figure for the country as a whole.
The two National Parks with the highest population densities are both located in the south of England. The South Downs has the highest population density at 69 persons per square kilometre with the New Forest having a population density of 63 persons per square kilometre.
Table 2: Population Density of National Parks, mid-2012
| National Park | Mid-2012 Population (thousands) | Area (sq. km.) | Population Density (persons per sq. km.) |
| South Downs | 113.2 | 1,650 | 69 |
| New Forest | 35.1 | 560 | 63 |
| Pembrokeshire Coast | 22.9 | 590 | 39 |
| Dartmoor | 33.9 | 960 | 35 |
| Peak District | 37.8 | 1,440 | 26 |
| Brecon Beacons | 33.4 | 1,350 | 25 |
| The Broads | 6.2 | 290 | 22 |
| Lake District | 40.4 | 2,220 | 18 |
| North York Moors | 23.2 | 1,440 | 16 |
| Exmoor | 10.2 | 690 | 15 |
| Snowdonia | 25.6 | 2,110 | 12 |
| Yorkshire Dales | 19.6 | 1,770 | 11 |
| Northumberland | 2 | 1,050 | 2 |
| Source: Office for National Statistics | |||
Download this table Table 2: Population Density of National Parks, mid-2012
.xls (28.2 kB)Northumberland National Park has the lowest population density at 2 persons per square kilometre. This reflects the fact that large areas of this National Park are unpopulated hills, moorland and forest, with the largest settlement being the village of Elsdon with a population of 240 (2011 Census estimate). The other National Parks have population densities ranging between 11 and 39 persons per square kilometre.
Nôl i'r tabl cynnwys8. Age distribution
National Parks have an older age structure than the wider population of England and Wales. Figure 2 below shows that National Parks (taken together as a whole) have higher percentages of population aged 45 and over than seen in the national population and, correspondingly, have lower proportions of children and younger adults. Approximately 12% of the National Park population is aged 75 and over, compared to only 8% of the total population of England and Wales.
Figure 2: Population age structure, mid-2012
Source: Office for National Statistics
Download this chart Figure 2: Population age structure, mid-2012
Image .csv .xlsThe age structure varies between different National Parks. As shown in figure 3 below, all 13 have a higher proportion of population aged 60 and over than for the country as a whole. In mid-2012, 23% of the population of England and Wales was aged 60 and over, compared to 30% in Northumberland and the South Downs National Parks and over 40% in Exmoor and The Broads.
Figure 3: Percentage of population aged 60 and over, mid-2012
Source: Office for National Statistics
Download this chart Figure 3: Percentage of population aged 60 and over, mid-2012
Image .csv .xls9. Comparison with 2001 Census based series
Mid-year population estimates are based on the results of the national decennial census and updated each year to account for annual population change. At the end of each decade the results are rebased using the latest census figures and revised estimates for the previous decade are produced.
The revised figures are designed to correct for the inevitable statistical errors that accumulate in the estimates over time. However, in some cases the original estimates (particularly for those years close to the 2001 Census baseline) may be more accurate because the revised figures have been produced using information on rates of population change in the wider area surrounding each National Park rather than for the exact boundaries of the National Parks themselves. The revised figures are likely to be more accurate for the period at the end of the decade and have the additional advantage of being part of a longer consistent time series.
The National Park population estimates for mid-2002 to mid-2010 included in this release are revised figures which have been updated to take into account the results of the 2011 Census. Table 3 below sets out the scale of the revisions made at National Park level for both mid-2002 and mid-2010.
Table 3: Comparison between original and revised National Park population estimates, mid-2002 and mid-2010
| National Park | Mid-2002 Population (thousands) | Mid-2010 Population (thousands) | ||||
| Original | Revised | % Difference | Original | Revised | % Difference | |
| All National Parks | 396.6 | 394.3 | -0.6 | 403.8 | 404.2 | 0.1 |
| Dartmoor | 33.6 | 33.8 | 0.7 | 34.7 | 34.2 | -1.3 |
| Exmoor | 10.9 | 10.7 | -2.1 | 10.7 | 10.5 | -2.2 |
| Lake District | 41.7 | 41.2 | -1.1 | 41.7 | 41.1 | -1.3 |
| Northumberland | 2 | 2 | -0.3 | 2 | 2 | 2.7 |
| North York Moors | 24.1 | 23.9 | -0.8 | 23.8 | 23.4 | -1.6 |
| Peak District | 37.8 | 37.7 | -0.2 | 38.2 | 38 | -0.4 |
| The Broads | 6 | 5.8 | -2.8 | 6.5 | 6.2 | -4.4 |
| Yorkshire Dales | 19.5 | 19.5 | -0.2 | 20.3 | 20 | -1.7 |
| New Forest | 34.2 | 34.3 | 0.3 | 35.2 | 35.1 | -0.3 |
| South Downs | 107.3 | 106.8 | -0.5 | 110.9 | 112 | 1 |
| Brecon Beacons | 32.2 | 32.5 | 1 | 32.4 | 33.3 | 2.9 |
| Pembrokeshire Coast | 22.4 | 21.4 | -4.5 | 21.8 | 22.6 | 3.8 |
| Snowdonia | 25.2 | 24.9 | -1.2 | 25.6 | 25.7 | 0.6 |
| Source: Office for National Statistics | ||||||
| Notes: | ||||||
| 1. The New Forest and South Downs National Parks were not designated until 2005 and 2010 respectively, however estimates for mid-2002 have been produced for these areas and they are included in this analysis. | ||||||
Download this table Table 3: Comparison between original and revised National Park population estimates, mid-2002 and mid-2010
.xls (30.2 kB)For mid-2002, the revisions process decreased the overall National Park population of England and Wales by approximately 0.6%, although the percentage change ranged from -4.5% in Pembrokeshire Coast to +1.0% in the Brecon Beacons. The revisions process increased the mid-2002 population of a total of three National Parks (Brecon Beacons, Dartmoor and the New Forest). Due to the relatively small populations of National Park areas, the largest absolute change was of 1,000 persons in Pembrokeshire Coast.
In mid-2010, the overall National Park population was increased by 0.1% as a result of the revisions. The changes at National Park level ranged from -4.4% in The Broads to +3.8% in Pembrokeshire Coast. The largest absolute change was of 1,070 persons in the South Downs National Park.
Nôl i'r tabl cynnwys10. Small Area Population Estimates for other UK Countries
Small Area Population estimates for Scotland and Northern Ireland are produced by National Records of Scotland (NRS) and the Northern Ireland Statistics and Research Agency (NISRA) respectively. A paper, Small Area Population Estimates across the UK which provides a broad description of the different methodologies used to produce the wider set of small area population estimates in each constituent country of the UK, is available on the NISRA website.
Population estimates and projections for the two National Parks in Scotland (Cairngorms and Loch Lomond and The Trossachs) are available from the NRS website. These are calculated using small area population estimates for Scottish data zones. The latest figures are 2010-based and do not reflect the results of the 2011 Census.
There are no National Parks in Northern Ireland.
Nôl i'r tabl cynnwys