1. Main points

Short-term migration to the UK largely accounts for the recent differences between the number of long-term migrants (as estimated by the International Passenger Survey (IPS)) and the number of National Insurance number (NINo) registrations for EU citizens.

IPS continues to be the best source of information for measuring long-term international migration (LTIM).

Definitional differences between these data are fundamental and it is not possible to provide an accounting type reconciliation that simply ‘adds’ and ‘subtracts’ different elements of the NINo registrations to match the LTIM definitions.

NINo registrations data are not a good measure of LTIM, but they do provide a valuable source of information to highlight emerging changes in patterns of migration.

Work on NINo interactions data supports these conclusions, but this is complex work and will need further consideration. We intend to continue to work on these data sources and hope to be able to publish further analysis in due course.

Nôl i'r tabl cynnwys

2. Introduction

2.1 On 7 March ONS published an information note explaining the reasons why long-term international immigration figures from the IPS could differ from the number of NINo registrations. It noted that the two series are likely to differ because of short-term immigration and timing differences between arriving in the UK and registering for a NINo. This note presents an initial analysis that has been undertaken by experts across government to help understand why the two series are diverging, with a focus on EU migration particularly from the EU8 and EU2, where the recent differences between the two series have been most pronounced.

2.2 The analysis uses a range of administrative and survey data sources and requires looking at Government databases from a new perspective. This is complex work and will take time to complete. Given the considerable interest in this subject, ONS has decided to publish a note of our analysis now.

2.3 This paper concludes that, on the basis of the available evidence, the divergence between the NINo registrations and the Long-Term Immigration series from the IPS is likely to be largely due to short-term immigration and that estimates derived from the IPS remain the most appropriate for measuring long-term immigration.

Nôl i'r tabl cynnwys

3. Data sources and analysis

3.1 The data sources we have looked at are:

a) Short-term International Migration (STIM) data. The IPS can identify short-term migrants who arrive for employment, study or work (other) purposes for between 1 to 12 months. Up until 2014 it can identify the actual number of short-term migrants in England and Wales by analysing information from those leaving the country. An ad hoc analysis has also been run to estimate the number of short-term migrants in 2015 using ‘intentions’ data which are only available for the UK as a whole. The inclusion of short-term intentions data for mid-2015 provides a good indication of whether the recent sharp rise in NINo registrations could be related to short-term immigration, which you would not expect to see reflected in Long-Term International Migration (LTIM) figures (12 months or more) and therefore the headline net migration figure. Since people's intentions can change, these data will not be directly comparable with the mid-2015 estimates of 'actual' short-term migration, which will be published in May 2017. However, the short-term intentions data do represent a recent flow of people arriving in the UK who may apply for a NINo. Two estimates of the STIM 2015 figures have been included in this paper to reflect the uncertainty and the fact that they can be estimated in a number of different ways. The charts presented below include actual STIM estimates up until 2014 and use two short-term intentions estimates for 2015. The assumptions used to create the STIM intentions estimates in this paper are given in Annex 1.

b) ‘Interactions data’ – The analysis of these data for this purpose is relatively new and has not yet been fully explored. However, focusing on the trends and proportions the data are showing is still helpful and can be set alongside the IPS data for comparison. It should be noted that these represent three distinct pieces of analysis. Getting a coherent picture from all three is complex given that they use a combination of survey data and administrative data that cover both stocks and flows. Nevertheless, some general conclusions can be drawn and these are presented throughout this paper. The sources we are utilising are:

  1. L2 – Department for Work and Pensions (DWP) analysis using the Lifetime Labour Market Database (L2), which is based on a 1% sample of NINos and collates data from National Insurance, PAYE, DWP Benefit and Local Authority benefit systems. The L2 holds individual interactions with these systems up to end March 2015.

  2. SPI - HMRC analysis of those subject to income tax (PAYE or Self-Assessment) or National Insurance Contributions (NICs) or receiving Tax Credits or Child Benefit or any combination of these, from the Survey of Personal Incomes (SPI) and HMRC’s administrative data on tax credit and child benefit recipients, which are available up to end March 2013.

  3. RTI/SA - HMRC analysis of employers’ payments for their employees’ income tax PAYE or occupational pensions in 2014-15 by submission to HMRC’s Real Time Information (RTI) system, supplemented by Self-Assessment (SA) data on the number of individuals who have filed a 2014-15 SA return who did not report employment, pension or taxable benefit income on their SA return.

More details on how the analysis has been carried out and the limitations of each source are included in Annexes 2 and 3 for information.

Nôl i'r tabl cynnwys

4. EU Overview

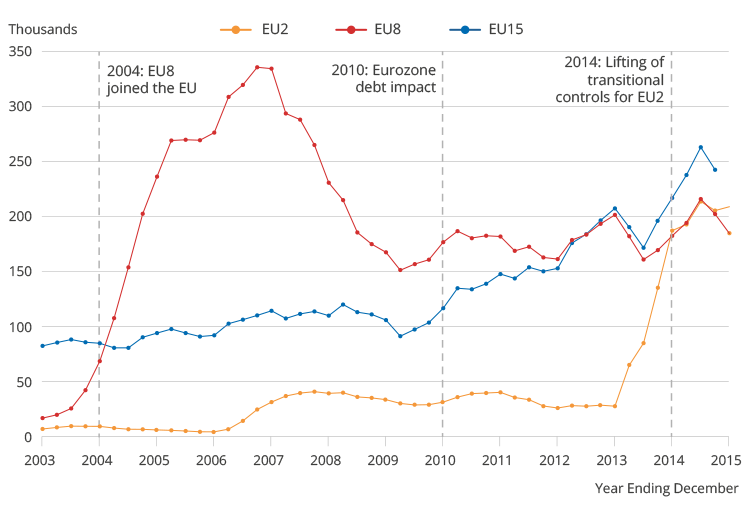
4.1 The sharp increase in NINo registrations is not a new phenomenon. Figure 1 above shows there have been sharp increases and decreases over the last 12 years which appear to have been driven by changes to the rights to access the labour market or economic factors. In particular, there was a sharp increase in the number of NINos allocated to EU8 citizens after their accession to the EU in 2004 followed later by a decrease. This appears to be mirrored by the marked increase in EU NINo registrations, largely driven by the number of EU2 citizens registering following their accession in 2014, though this has been partially reversed recently due to slight falls in EU8 and EU15 registrations.

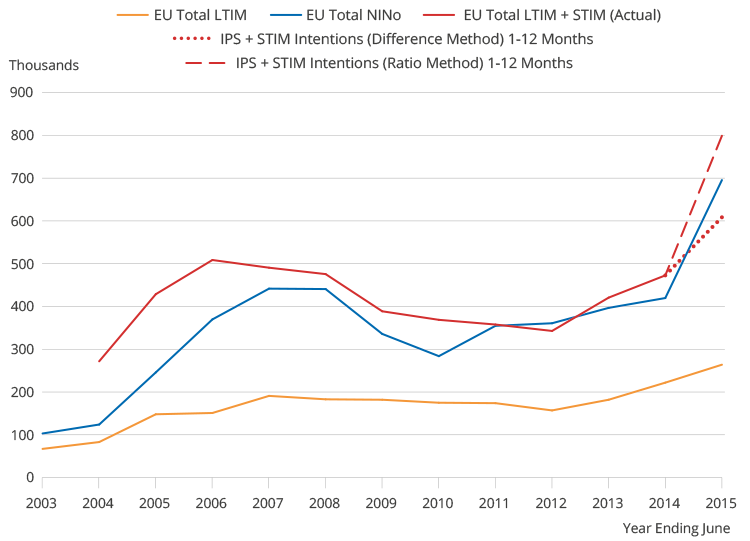
4.2 As the March report set out, one of the main reasons for the divergence between LTIM and NINos is likely to be that LTIM does not (and is not intended to) pick up short-term migration. Consequently, when we add STIM data to LTIM data1 we can see that there is a much closer parallel between measured immigration and the numbers of NINo registrations, which is shown in figure 2 above.

4.3 Any remaining gap between LTIM + STIM and the NINo registrations data could potentially be explained by looking at the number of visitors that come to the UK for work or business for less than one month. In 2015 there were almost 5.9 million visitors that came to the UK for work or business. These visitors could be eligible to apply for a NINo and although the great majority will not, a small number are likely to need or use the opportunity to apply for one.

Notes for EU Overview

  1. Please note that the addition of LTIM and STIM do not provide a simple and accurate measure of all immigration to the UK within a specific time period. Please see Annex 1 for more information.
Nôl i'r tabl cynnwys

5. EU15 (excludes British citizens)

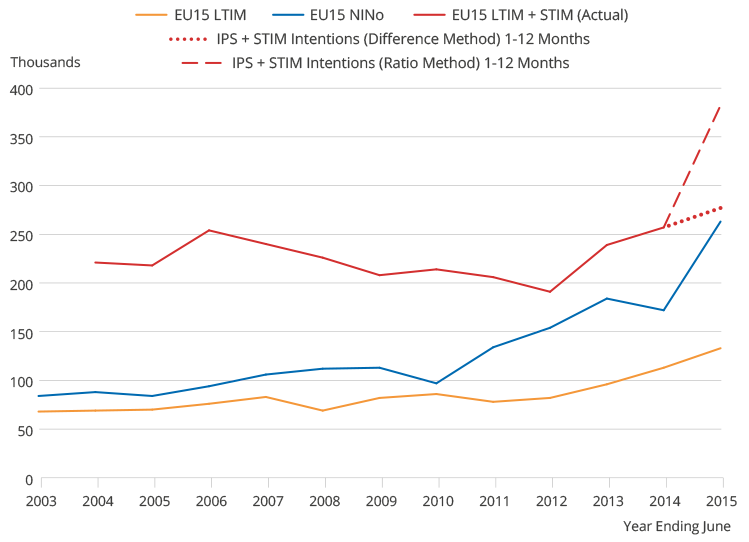
5.1 Figure 3 above shows that when STIM data are added to LTIM data the level of international immigration is above the number of NINo registrations for EU15 citizens. This may reflect that citizens in these countries are used to having freedom of movement and many of those arriving will be repeat visitors and therefore already have a NINo.

Nôl i'r tabl cynnwys

6. EU8

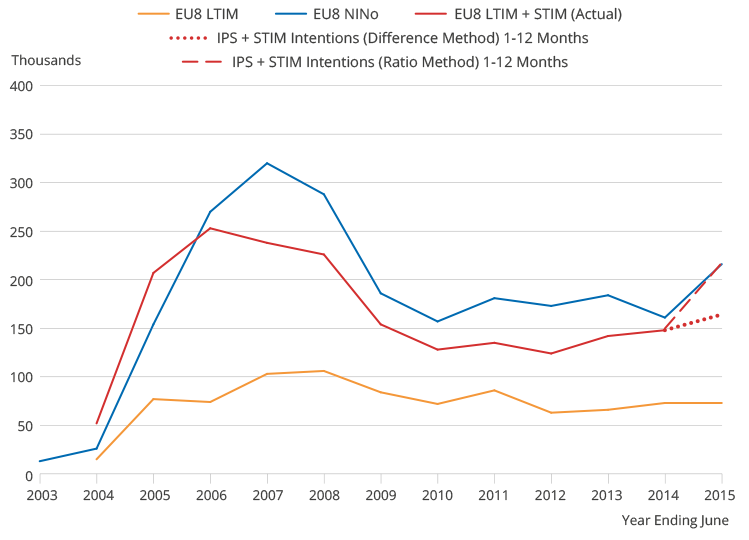
6.1 EU8 countries gained the right to free movement in 2004, which accounts for the large rise in LTIM + STIM and NINos for that year and beyond. Whilst the rapid changes in patterns of migration in 2004 revealed some shortcomings in the IPS, which have since been addressed, the large number of NINo registrations from the EU8 have not been indicative of further large increases in the long-term migration numbers, which subsided after the initial rapid growth and appears relatively stable now.

6.2 As figure 4 shows LTIM + STIM have consistently been below the number of NINo registrations since 2006, although the pattern both data sources have followed is similar. This difference is likely to reflect visitors who may be in the country for less than one month who may need a NINo to work or use the opportunity to apply for one. It may also reflect those short-term migrants that come to accompany and join relatives and friends but are not included in the short-term estimates in this paper. They may, however, apply for NINo.

6.3 Much of the gap between LTIM and NINo registrations is likely to be driven by short-term immigration and this is supported by the NINo interactions analysis:

  • The NINo data from the L2 sample dataset suggest that, for the period 2010 to 2013, on average 32% of EU8 NINo registrations have interactions that are under 52 weeks, suggesting that they only stay in the United Kingdom for a short period. A further 18% of registrations state that they arrived in earlier years to the year in which they registered and therefore should not be counted as an inflow in the registration year. Although their interactions suggest visits of a short-term nature, some of these people appear to have been in the country for longer than 12 months and so a proportion may be long-term migrants.

  • The SPI data show, that of those EU8 nationals who registered for a NINo between 2011/12 and 2013/14, 29% had no interaction at all with the tax, national insurance or tax credits system in 2013/14 . Conversely, 71% of EU8 nationals were known to the HMRC during those tax years.

  • The RTI/SA data show that for those EU8 nationals registering for a NINo who arrived in 2014/15 and had interacted with RTI/SA in 2014/15, around half showed interaction with RTI for 12 months or more and 44% for less than 12 months. A further 6% showed interaction with SA. Those who had not interacted with RTI or SA records on RTI during 2014/15 could be claiming benefits, not working, or have left the country.

6.4 The analysis of NINo activity shows that a substantial proportion (up to 50%), of EU8 citizens have short-term activity of less than 12 months. This supports the evidence from the IPS that the gap between NINo activity and the LTIM series is likely to largely be accounted for by short-term migration.

Nôl i'r tabl cynnwys

7. EU2

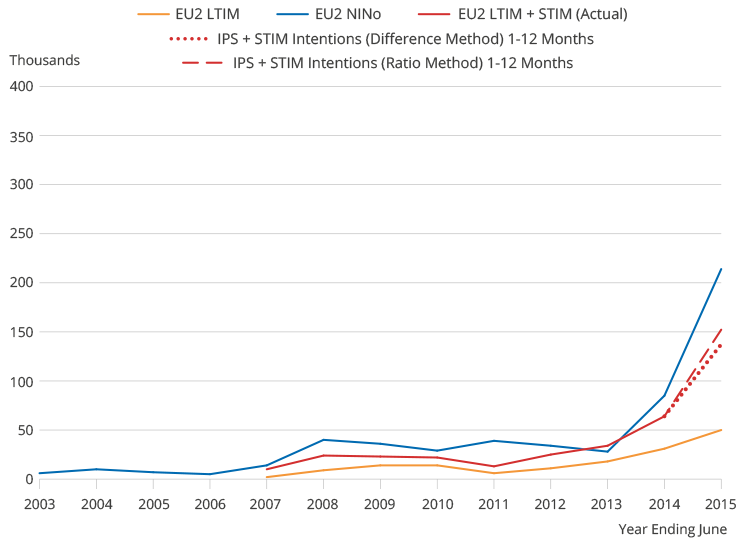
7.1 It is the EU2 data where we see the most marked increase in NINo registrations following the lifting of employment restrictions at the start of 2014. There were similar increases in registrations for the EU8 following those countries' entry into the EU in 2004.

7.2 It is reasonable to expect that we might see some replication of this pattern for the EU2, however there are less data available as yet to help us understand whether the rise in NINo registrations is being driven by short-term migration.

7.3 We know that some of the increase in registrations will be NINos issued to people who had already arrived in the UK in previous years, for example students already in the country. DWP data show us that in 2014/15, when NINo registrations began to rise, 62% of EU2 migrants registering for a NINo had arrived in the UK more than 3 months before registering and 31% arrived more than 6 months before. This time lag effect is particularly apparent for EU2 because of the work restrictions they faced until January 2014. A proportion of those registering for a NINo in 2014 would therefore not be included in the 2014/15 LTIM figures, which is supported by the fact the LTIM / STIM data for 2013 are higher than NINo registrations for the first time. Likewise, there will be some EU2 migrants who arrived in 2014 who will be recorded in the 2015 NINo registration data. Like EU8 citizens, some of the gap seen in 2014 and 2015 is likely to reflect visitors who may be in the country for less than one month who may need a NINo to work or use the opportunity to apply for one. It may also reflect those short-term migrants that come to accompany and join relatives and friends. They are not included in the short-term estimates in this paper but may, nevertheless, apply for a NINo.

7.4 Similar to EU8 nationals, much of the gap between LTIM and NINo registrations is likely being driven by short-term immigration and this is supported by the NINo interactions analysis:

  • The NINo data from the L2 sample dataset suggest that, for the period 2010 to 2013, on average 23% of NINo registrations have interactions that are under 52 weeks, suggesting that they only stay in the United Kingdom for a short period. A further 38% of registrations state that they arrived in earlier years to the year in which they register and had interactions of less than 52 weeks and therefore should not be counted as an inflow in the registration year. Although their interactions suggest visits of a short-term nature, some of these people appear to have been in the country for longer than 12 months and so a proportion may be long-term migrants.

  • The SPI data show that, of those who registered between 2011/12 and 2013/14, over 40% of EU2 nationals had no interaction with the HMRC tax, national insurance or tax credit system in 2013/14.

  • The RTI/SA data tell us that for those registering for a NINo who arrived in 2014/15 and had interacted with RTI/SA, 41% showed long-term interaction with RTI, 40% short-term and 19% had interacted with SA during 2014/15. Those who had not interacted with RTI/SA could be claiming benefits, not working, or have left the country. For EU2 it is particularly difficult to unpick the latter category at this time, since many may have only applied for their NINo after January 2014 and not yet had a chance to interact with the system on a long-term basis. However the low proportion showing long-term interactions in 2014/15, once restrictions had been lifted, still indicate that a large number of new EU2 migrants have come in as short-term migrants.

7.5 The analysis of NINo activity shows that a substantial proportion (of up to 61%) for EU2 citizens have short-term activity of less than 12 months. This supports the evidence from the IPS that the gap between NINo activity and the LTIM series is likely to largely be accounted for by short-term migration.

Nôl i'r tabl cynnwys

8. Next steps

8.1 The analysis we have done to date and presented above indicates that the reason the LTIM estimates and the NINo figures have been diverging is likely to be largely due to short-term immigration. However the work that we have started is not complete, particularly around the interactions data. We will be undertaking further work to understand these data and hope to be able to publish further analysis in due course.

8.2 Furthermore, over the next two years, more analysis will take place to better understand what administrative sources tell us about migration patterns, particularly migrants who may enter and leave the UK several times within a year. This work should help to better understand the measurement of international migration into and out of the UK, particularly for those who are uncertain of their migration intentions and may stay for a shorter or longer time than originally stated on their arrival in the IPS. Such work will also include ONS’s ongoing investigation into how the IPS identifies particular groups of migrants, focusing on sampling, the practical operation of the survey and the methodology to produce migration estimates.

Nôl i'r tabl cynnwys

.Annex 1 – International Passenger Survey - Long-Term and Short-Term International Immigration Assumptions

Long-term international migration

Definitions

The long-term international migration data used in this note are the “LTIM” estimates derived from the International Passenger Survey (IPS).

These estimates are based on the UN definition of a long-term international migrant, that is:

For more information on the IPS and LTIM estimates, please see the MSQR Information for Users, and our Background Notes and FAQs.

Data provided for comparison against short-term migrants are shown at the mid-year (year ending June) point.

The LTIM figures shown in comparison with National Insurance Number registrations data pertain to the number of immigrants to the country. Although net migration represents the main measure of international migration to and from the UK, immigration is a better comparison to the NINo registration data because the NINo data do not account for those leaving the UK.

Uncertainty in Survey-based Estimates

The LTIM data are estimates based on a sample survey and as such there will be a level of uncertainty within the data. To illustrate this uncertainty, 95% confidence intervals are derived and accompany published data. These confidence intervals have not been shown within this note as the methods and assumptions used in the discussion do not allow for the correct confidence intervals to be applied. However, confidence intervals for LTIM and STIM (short-term) data can be obtained from the published tables.

Included Migrant Categories

ALL categories of LTIM migrants have been included in the analysis. It is likely that a very large proportion of long-term migrants would register for a National Insurance Number (NINo), especially given the general characteristics of long-term migrants, especially those coming for work, business, study or to accompany or join others. However, it is recognised that not all migrants would register for a National Insurance Number (NINo), such as children or asylum seekers. These migrants have been included for the sake of completeness as it could be the case that they would register for a NINo at some point, and are a valid element of the population over a long period of time (i.e. 12 months or more). Slightly different assumptions have been made for short-term international migrants (STIM).

Switchers

As noted above, LTIM data account for “switchers”. People who enter or leave the UK intending to be a visitor, that is staying or being away for less than 12 months, may actually migrate for more than a year. These people are, in effect, visitors who subsequently become migrants, and are referred to as “visitor switchers”. These migrants must therefore be added to the estimate of migration to make it comprehensive. Alternatively, some people who enter or leave the UK intending to migrate (for 12 months or more), may actually stay in or leave for less than a year. These people are known as “migrant switchers” as they intended to be migrants, but were actually visitors.

Because the analysis of long-term and short-term migrants is important within this note, LTIM estimates are the best source to use as switchers are taken into consideration in this way. The switcher adjustments calculate a measure of a person’s probability to switch their intentions based on their nationality and the average number of people who have switched their migration intentions in the previous three years. Future analysis comparing intended and actual lengths of stay, in addition to exploring administrative sources, should identify the impact of changing migration patterns on these adjustments.

More information on the methodology of the IPS is available on our website.

Short-term international migration

Definitions

Short-term international migration (STIM) is also based on IPS data. These data consider international migrants who are immigrating or emigrating for 1 to 12 months. Data are also available for 3 to 12 months, but the 1 to 12 month data allow for a more complete coverage. To be included as a short-term international immigrant to England and Wales under any of these definitions, a person arriving must have been living outside the UK for 12 months or more (and hence will not include “circular migrants”). For the purposes of this analysis we have only included those that arrive for employment, study and work (other) reasons. This is a relatively small proportion of the total number of short-term immigrants who came for between 1 to 12 months, which in the year to mid-2013 stood at 1.0 million. However, this was substantially lower than the number of short-term emigrants which stood at 2.4 million. The chart below shows how this has changed over time.

Timeliness

Short-term international migrants are interviewed as they leave the UK, and thus it takes two years of International Passenger Survey (IPS) data to capture all migrants who have arrived in the reference year (as migrants could stay for up to 12 months). This information note includes early release of the mid-2014 provisional short-term international migration estimates (Table 1). The full mid-2014 release will be published on 26 May 2016.

Geographical Coverage

It is important to note that the STIM data used cover only England and Wales, and therefore exclude some people migrating to Scotland and Northern Ireland who would be covered by the LTIM data. However, these two countries account for only a small percentage of STIM, as the majority of migrants immigrate to or emigrate from England.

Included Migrant Categories

The categories of migrants included in the STIM data are those immigrating for employment, for study, or for “work – other” reasons which is a proxy for “business” reasons. These categories are perhaps those most likely to contain migrants who might register for a NINo, although it is acknowledged that not all of these migrants would.

There will also be those who are included in the category “Other” who may register for a NINo. This category is not included in the analyses within this paper. One group of migrants that may be of interest are those who are accompanying or joining others. These migrants are included within the “Other” category, and cannot be separated out. The “Other” category has been excluded because it is a large group, and including them would not help show clearly how short-term migrants may account for some of the gap between NINos and IPS data, especially as possibly the majority of that category would not apply for a NINo.

STIM “Intentions” and “Actuals” Data

It should be noted that the STIM data are based on “actual” flows of migrants, meaning they have actually come to and subsequently left the UK (or vice-versa) rather than simply intending to do so. It is for this reason that the STIM data lag behind LTIM data, as more data are required to determine who is an “actual” short-term migrant, compared to those merely intending to be.

Estimates of actual short-term migration flows are not yet available for mid-2015, but the IPS does collect information on intended length of stay. Therefore some of the charts in this report include mid-2015 estimates of people who stated an intention to stay in the UK between 1 and 12 months for the purposes of employment, other work or study. They may then leave within 1 month, stay for 1 to 12 months (and will eventually be included in the actual short-term figures) or they may remain in the UK longer than 12 months (thereby becoming a ‘visitor switcher’). These figures are provided to give an indication of short-term migration for mid-2015 and cannot be directly compared to actual short-term migration data as there are a number of different scenarios that could occur including:

  • those intending to stay short-term, who do only stay short-term

  • those intending to stay short-term who change their intentions and stay long-term but then leave

  • those intending to stay short-term, but who never leave

  • those intending to stay for a number of months, but who leave within one month

More research would be required to understand how these different scenarios operate in the data.

Unlike actual STIM, figures on intended short-term length of stay are only available for 3 to 12 months. However, it is possible that people intending to be in the UK between 1 and 3 months may apply for a NINo. Therefore, the mid-2015 intended short-term migration figures for 1 to 12 months have been estimated. There are several ways that this estimation can be carried out so we have included two estimates to show the uncertainty. One of these estimates are based on the average ratio (for the last three years) of intended vs actual short-term migration and the other is based on the difference between 1-12 and 3-12 months actual figure. It is possible that these figures contain more than one intended short-term journey within a year for one person, but they will be allocated just one NINo. However, there will also be short-term migrants arriving for reasons other than work or study who will have applied for a NINo and these are not included in the short-term figures.

Adding LTIM to STIM

Adding together LTIM and STIM does not provide a simple measure of all immigration to the UK within a specific time period. The charts presented in this paper show the addition of the two series as an illustration of the scale of the two flows of people immigrating to the UK who may acquire a NINo. There are reasons why the two cannot be added together to produce a single, accurate measure. Short-term immigration flows are based on journeys, not people. Therefore it is possible for the same person to experience more than one short-term migration within a 12 month period. Additionally, one person may be both a short-term immigrant and a long-term immigrant within the same 12 month period, for example if they lived in the UK between January and May, then returned in September intending to stay more than 12 months. These numbers are expected to be small relative to the total LTIM and STIM flows, so are unlikely to affect the patterns shown in the charts.

Adjustments are made in the LTIM figures for people who change their intentions. Where mid-2015 short-term intentions are added to the mid-2015 long-term estimate, there is a risk of double counting the number of people who switch their intentions from short to long-term. Therefore mid-2015 figures are the sum of short-term intended migration (1 to 12 months) and long-term migration (12 months or more), as recorded in the IPS.

IPS Visitors for less than one month

The following table provides ad-hoc estimates of visitors to the UK for less than one month based on IPS data. This is presented here for completeness, though recent analyses have suggested that such a small proportion of these people would apply for a NINo that these data may not contribute to the difference between IPS estimates and NINos.

Definitions

Data have been provided of those who came to the UK and subsequently left the UK having stayed for one month or less. In this case, one month has been taken to mean a stay in the UK of 30 nights or fewer. This allows for coverage of those staying for less than one month, those staying for 1 to 12 months, and those staying long-term.

These data are not routinely published; they have been produced as an ad-hoc query of the data for the purposes of this product. They are therefore only experimental statistics used for illustration, and may not accord with officially published estimates of travel and tourism data.

IPS data for those staying less than one month are based on “actual” flows, as these people have already left the country. They are counted in the year in which they left the UK, having stayed for 30 nights or fewer, so a small proportion of these may have arrived in the previous year. Again, these data are presented based on mid-years to be consistent with STIM data.

Included Migrant Categories

For this note, only those travelling to the UK for less than one month for work (or some business) purposes have been included, as it is likely to be only these people who may require a NINo. This excludes those travelling for conferences or trade fairs but unfortunately, there is one category within the data which is a catch-all category of ‘Work/business’, wherein those coming for business cannot be separated from those coming for work. This category has been included but is by far the largest of all of the categories. Other reasons included in the data are:

  • definite job to go to

  • international commuter

  • looking for work

  • au pair

  • working holiday

These categories could include those travelling repeatedly, such as circular migrants, who would only need to register for a NINo once, but similarly there would be several who would be registering for the first time, if indeed they were to register. It is not possible to determine which passengers would or would not need a NINo.

The numbers of those coming to the UK for less than one month are very large compared with STIM and LTIM data. It is acknowledged that only a tiny percentage of these people would require a NINo, but even a small percentage could account for a large number. However, it is not possible to quantify how many of these people would actually register for a NINo, so the figures are provided for contextual or illustrative purposes only.

Impact of Flight Times

The IPS is a sample survey designed to be representative of all passengers. The survey results are grossed up to total passenger numbers to provide estimates of migration flows into and out of the UK. It is generally carried out between 6am and 10pm and experiences very low refusals (less than 3%). The sample is periodically reviewed to ensure that it remains representative, but it is possible that flight patterns may change between these review periods or that the types of passengers arriving or departing overnight are different from those arriving between 6am and 10pm. This was last reviewed in a 2014 pilot exercise for EU2 arrivals, which found no evidence at that time to suggest that migrants who arrived overnight were being misrepresented. ONS is currently reviewing latest flight patterns and initial findings have shown that the proportions of migrants from individual EU2 and EU8 countries included in the IPS sample are in line with the proportions of total flights from these countries to the UK. Work on reviewing coverage of the IPS will continue during 2016.

Nôl i'r tabl cynnwys

.Annex 2 - National Insurance registrations to adult overseas nationals

The NINo registration data contain all non-British adults who come to the United Kingdom from overseas and who register because they need a NINo for various legitimate purposes. Although the data do not support residency or duration of stay directly, analysis from HMRC, DWP and Local Authority interactions has been used to make a judgement about the length of stay after first arrival and registration.

While we believe this methodology can be applied to the registration data between 2010 and 2013 the same principle cannot be applied to the 2014 registration data with any certainty. This is due to the lifting of migration restrictions for the EU2, which has altered behaviours and the pattern of interactions and flows.

In order to make a robust estimate for 2014 it is necessary to have more complete information for recent tax years. This should be available early in 2017.

For people arriving from the EU between 2010 to 2013 analysis suggests that between 30% and 37% have interactions that are under 52 weeks, suggesting that they only stay in the United Kingdom for a short period. These people are defined as ‘Short-Durations’ in the table below.

A further 17% to 25% of EU registrations state that they arrived in earlier years to the year in which they register and had interactions of less than 52 weeks and therefore should not be counted as an inflow in the registration year. The period between the self -reported arrival date and the registration date suggests that they would be classified as ‘Long-Term’. However the lack of supporting interaction data from the sources we cover in this analysis suggests there is an element of uncertainty about whether the duration is continuous. This group could include people who are studying and those who accompany or join family members but do not need to register for a NINo immediately and legitimately have limited interactions. These people are defined as ‘indeterminate durations’ in the table below.

We estimate that between 43% and 52% of all EU registrations had at least one interaction of 52 weeks or more in either the year of arrival or year of registration. These people are defined as ‘Longer-Durations’ in the table below.

Notes and methodology

  1. Analysis based on United Kingdom.

  2. Analyses based on linking the NINo Registration data (Migrant Worker Scan) to the Lifetime Labour Market Database (L2 1%) to assess activities and interactions with HMRC, DWP and Local Authorities.

  3. L2 Interactions include:

    a. Personal details, including dates of birth, origin and address in each tax year

    b. Employment periods

    c. Self-Employment

    d. Tax Credits

    e. Child Benefit

    f. DWP Benefits (including credit only cases)

    g. Housing Benefit

    h. Receipt of occupational or survivor pensions paid via PAYE

  4. Longer/Shorter Duration assumption:

    a. That an interaction denotes activity and residency in the year (as long as no abroad address or liability is held)

    b. That once 52 weeks interactions in either the year of arrival and year of arrival+1 or year of registration and year of registration+1 has reached, or where there are interactions in more than 2 consecutive years the person is classed as ‘Longer Duration’

    c. That were the period between arrival and registration exceeds 52 weeks the person is classed as ‘Longer duration’. However, for this analysis these people are categorised separately, and have been classified as ‘Indeterminate Duration’ as long as the 52 week interaction measure is not met.

    d. In the latest tax year the proportion of Short Duration is wholly estimated and is based on the proportion of short durations in the previous 2 tax years, therefore the figures for the latest tax year should be treated as provisional and used with some caution.

  5. Circular migrants. The methodology could potentially misclassify someone with interactions in every year as ‘Longer Duration’ where there are shorter duration spells in each year after arrival. However, whilst this is a limitation of the methodology, analysis of the detailed interaction data suggests that the number of people potentially being misclassified is not significant. Furthermore any misclassification could only affect people who undertake circular migration patterns for 3 years or more, as anyone with short duration interactions for less than 3 years would be classified as Short Duration anyway.

  6. Analysis reflects nationality at registration, does not account for any changes in citizenship post registration.

Nôl i'r tabl cynnwys

.Annex 3 - Non-UK nationals’ interaction with HM Revenue and Customs compared to National Insurance Number registrations and Long-Term International Migration

  1. Summary

    As noted above, the International Passenger Survey (IPS) is still perceived to provide the best estimate of Long-Term International Migration (LTIM). Analysis of HMRC data has been undertaken to help provide independent reassurance.

    The statistics in this annex present analysis of EU nationals who either arrived in the UK or registered for a National Insurance number (NINo) in a tax year, and who had an interaction with HM Revenue and Customs (HMRC) in that same tax year. This complex analysis brings together data from several HMRC systems, including PAYE, Self-Assessment (SA), National Insurance, tax credits and Child Benefit, to provide proxy indicators for non-UK nationals’ presence in the UK during the tax years 2011-12 to 2014-15.

    In order to show the most up-to-date picture possible, different data are being used for different tax years:

    • The proxy for presence in the UK during tax years 2011-12 to 2013-14 is being subject to income tax (annualised PAYE via the National Insurance and PAYE Service (NPS) or Self-Assessment) or National Insurance Contributions (NICs) or receiving Tax Credits or Child Benefit or any combination of these. These statistics do not account for how long individuals had been in the UK; they include EU nationals who were only present in the UK for short periods of time as well as EU nationals who had been continuously present over the year – These data are not yet available for 2014-15.
    • The proxy for presence in the UK during 2014-15 is employers’ payments for their employees’ income tax PAYE or occupational pensions by submission to HMRC’s Real Time Information (RTI) system. These statistics do account for how long an individual was present in the UK. These statistics have been supplemented by Self-Assessment (SA) data on the number of individuals who have filed a 2014-15 SA return who did not report employment, pension or taxable benefit income on their SA return (typically the self employed) and are therefore not likely to be on RTI. These statistics do not account for how long an individual was present in the UK, but they do contain the number of pay periods.
  2. Main findings

    We looked at cohorts of EU nationals by year of registration to measure their interactions with HMRC systems. We found that the proportion of EU nationals who had “used their NINo” with respect to interacting with HMRC was 68.5% in 2011-12, 67.3% in 2012-13, 64.4% in 2013-14 and 52.9% in 2014-15.

    Figure 1 shows that for the EU as a whole, HMRC interactions data are broadly between the ONS LTIM inflows figures and NINo registrations, though the pattern/growth is closer to LTIM especially in 2014-15. HMRC interactions data were on average 38% higher than LTIM figures across the four years. The pattern between the three data sources was broadly consistent across the four years. HMRC interactions data were most similar to LTIM in 2014/15, although it should be noted that of those interacting in this year, 50% interacted with RTI on a long-term basis, 40% interacted on a short-term basis and 2% for one month. A further 8% were identified as having interacted with SA. These findings suggest that not all those who register for a NINo interact with HMRC in the year in which they arrive.

    Figure 2 is roughly mid-way between the two sources, though doesn’t show the uplift in 2014-15 which the other two show.

    In Figure 3 again shows the HMRC data are between the other two sources but this shows the considerable increase in NINo allocations to EU2 nationals between 2013-14 and 2014-15. Transitional labour market controls for nationals of these countries ended on 1st January 2014, which allowed EU2 nationals to fully participate in the UK labour market. LTIM and HMRC interactions data have also increased over this period, although not to the same extent. HMRC data for 2014-15 showed that 90,152 individuals who had arrived in this period had interacted with HMRC; this represents 46.7% of those who had registered in 2014-15. HMRC interactions data are closer to the LTIM figures than they are for overall NINo registrations, although there is a larger difference between LTIM and HMRC in 2014-15. HMRC data also show that a larger proportion of EU2 nationals had interacted with SA in 2014-15 compared to other EU nationality groupings; 19% of EU2 nationals known to HMRC in 2014-15 were interacting with SA. A further 41% had interacted with HMRC on a long-term basis, 37% on a short-term basis and 2% for one month.

    Summary of main findings

    HMRC data supports the view that the IPS are a good estimator of LTIM. HMRC interactions data are generally closer to levels in the LTIM figures, although this varies by nationality group, with the figures being closer for the EU as a whole than for EU8 nationals, for example. RTI data for 2014-15 indicate a considerable proportion of short-term interactions with RTI, and while this is consistent with a picture of short-term and circular migration caution should be exercised in interpreting these figures given the assumptions underpinning them.

  3. Data and Methodology

    The analysis provides an estimate of the number of non-UK Nationals who had registered for a NINo and had an interaction with HMRC.

    In order to be transparent this part of the annex goes into detail about the methods and assumptions used alongside a list of caveats.

    To produce the statistics in this annex, a data extract comprising NINo, nationality at NINo registration, UK arrival date and NINo registration date was matched by NINo to:

    1. HMRC’s Survey of Personal Incomes (SPI), which is a stratified sample of individuals who could be liable to income tax (both PAYE and Self Assessment), NICs, tax credit and child benefit recipients in 2011-12, 2012-13 and 2013-14;
    2. HMRC’s PAYE Real Time Information (RTI), including records for employers’ payments for their employees’ income tax PAYE or occupational pensions in 2014-151

    Individuals were then grouped by nationality at the point of NINo registration and cohort of arrival in the UK. At NINo registration, both arrival date in the UK and registration date are recorded; this analysis uses the earlier of these two dates to group individuals into cohorts.

    Data on nationality

    Information on nationality is not routinely held on HMRC’s SPI sample data, administrative tax credits, Child Benefit or RTI systems because nationality is not a factor determining liability or entitlement. The Department for Work and Pensions (DWP) operate the NINo Allocation Service which collects evidence of identity and has allocated NINos since 1975. This information is lodged with HMRC’s National Insurance and PAYE Service.

    Individuals were allocated to non-UK country groupings based on their nationality when they registered as adults for a NINo in the UK. Statistics show nationality at point of registration, but do not show:

    • Current nationality
    • Nationality when subject to tax/NICs, or receiving tax credits/Child Benefit
    • Changes in nationality since registration
    • Individuals who were granted a NINo through the juvenile registration process
    • Other taxes or benefits such as DWP administered in-work benefits

    This approach is consistent with the established approach to identify the nationality of benefit claimants in existing Official Statistics series2. This does not recognise that an adult who was a non-UK national at the point of NINo registration may have subsequently become a UK national. Subsequently, children of the adult registrant may be allocated a NINo through the juvenile NINo allocation process when they approach the age of 16. HMRC does not hold information about the nationality of individuals allocated a NINo through the juvenile registration process.

HMRC data for 2011-12 to 2013-14 statistics - HMRC(1) see figures above

Identifying individuals subject to Income Tax and Class 1 or Class 4 National Insurance: A stratified sample of over 700,000 individuals subject to income tax or NICs for each tax year is drawn for the Survey of Personal Incomes (SPI) for 2011-12, 2012-13 and 2013-14. These are the same data used for Income Tax National Statistics3.

The SPI is based on a sample of cases drawn from each of the following three operational computer systems:

a. The National Insurance and PAYE Service (NPS) system covers all employees and occupational pension recipients with a Pay As You Earn (PAYE) record.

b. The Computerised Environment for Self-Assessment (CESA) system covers people with self-employment, rental or untaxed investment income. It also covers those with higher incomes and other people with complex tax affairs.

c. The Claims system covers people without NPS or CESA records who have had too much tax deducted at source and claim a repayment.

The samples are joined and the overlap removed. Statistics include all individuals who have a record in the PAYE system within the tax year, or require a Self-Assessment return in the tax year. Individuals subject to income tax or NICs are those for whom the calculated income tax liability is greater than zero and who have a non-zero calculated liability to either Class 1 or Class 4 NICs.

Identifying tax credits recipients: Families in receipt of tax credits are identified using HMRC’s administrative tax credits data for 2011-12, 2012-13 and 2013-14. These are the same data that were used to produce the National Statistics Publications Child and Working Tax Credits Statistics: Finalised annual awards 2011-12, 2012-13 and 2013-14 by HMRC. HMRC’s data identify the NINos of all adults in tax credit recipient families.

Identifying Child Benefit recipients: Individuals in receipt of Child Benefit are identified using HMRC administrative Child Benefit data for 2012, 2013 and 2014. These are the same data that were used to produce the National Statistics Publications Child Benefit Statistics Geographical Analysis August 2012, August 2013 and August 2014. HMRC data only identify the NINos of the main-claimant adults in Child Benefit recipient families. HMRC data for 2014-15 statistics

Identifying individuals receiving income tax PAYE or occupational pensions through RTI: only includes those who are in employment or in receipt of an occupational pension.

Payment records for which there was at least one populated “payment” type variable were included in the analysis. Using the payment date for each payment record for each employment for each individual, a picture of when individuals were interacting with, or “known to” the RTI system was developed. An individual was considered as “known to” RTI if they had at least one payment record fitting the above criteria with a payment date during a tax month. The individuals were then grouped in to four different categories according to their information on RTI, as shown in Table 1.

Category of being "known to" RTIDefinition
Long-termHad at least one RTI payment record with a payment date in 12 consecutive tax months, where at least one of these months was during the 2014/15 tax year.
Short-termHad at least one RTI payment record with a payment date for between 2 and 11 tax months (not necessarily consecutive) during the 2014/15 tax year.
One monthHad at least one RTI payment record with a payment date in one tax month of the 2014/15 tax year.
Not "known to RTI"Had no RTI payment records with payment dates during the 2014/15 tax year. These individuals could have had RTI payment records with payment dates in other tax years, or not have linked to any information on RTI.

RTI payment records were grouped in continuous spells, e.g. if an individual was active for April, May, July, August and September 2014, they would be considered to have two spells of two months and three months respectively, rather than one spell of six months, because there was a break in June.

The main focus of the analysis was the 2014/15 tax year. However, to determine whether a spell of being “known to” RTI was short-term or long-term, records for the 2013/14 tax year and 2015/16 tax years were also checked, to ensure that spells crossing tax year boundaries were considered. For example, an individual “known to” RTI from September 2013 to October 2014 could be considered as short-term if only the 2014/15 data were analysed. However, not all employers reported via RTI during 2013/14. Therefore, if the individual in this example worked for one of these employers, it is possible that they could be considered short-term rather than long-term. This is one of several important assumptions to consider in this analysis (see assumptions below).

In order to include those that are self-employed, data from the Self-Assessment administrative system, were added onto RTI.

Main assumptions:

  • Those not “known to RTI” could be any of self-employed, receiving benefits or tax credits (from either DWP or HMRC), receiving state or private pensions, a student not in employment, or no longer present in the UK. Additional analysis using SA data has been carried out to estimate what proportion of those not “known to RTI” are “known to SA”.

  • The method assumes that if an individual had a payment record with a payment date during a tax month that they were present in the UK for that whole month. Those who work irregular hours may continue to have payment records submitted for them by their employer even if they have not worked that month. Those with irregular payments have not necessarily left the country between payments.

  • The definition of “long-term” is strict in that one month without a payment record would divide a potential long-term spell into two short-term spells.

  • RTI data are complex and employers make full use of the options and flexibilities available to them when making their submissions. With the limited time available to complete this analysis, it has not been practicable to explore the full richness of RTI data. The current analytical method is likely to overestimate the number of migrants in the one-month and short-term categories and underestimate the long-term interactions. It is not possible to quantify this bias at this stage, but some of the reasons where the methodology currently "breaks" the continuity of a spell of interactions are, for example:

    • Someone paid quarterly will be categorised as interacting in the month they received their payment, even where the payments cover an unbroken three month spell of employment. They would not currently be categorised as receiving a payment in each of the three months.
    • Someone is paid monthly, and one of the payments made in July covers two months (for example, June and July). The employee has no submission of a payment made in June for this employment. This employment would not currently be categorised as receiving a payment in each of the two months, June and July.
  • As discussed above, not all employers reported payroll information to HMRC via RTI during 2013/14. Therefore, if the individual worked for one of these employers between 2013/14 and 2014/15, it is possible that they could be considered short-term rather than long-term.

Less significant assumptions/caveats:

  • It is possible to have regular payments on RTI and not be present in the UK. This is perhaps more likely for those receiving occupational pensions, who could have retired abroad. Given that 0.1% of EU nationals who arrived in the UK in 2014-15 and were allocated a NINo were aged 65 and over, this issue is unlikely to have a major impact on the figures presented.

  • An employer is exempt from operating PAYE if their employees are paid less than the Lower Earnings Limit (LEL) for National Insurance, do not get expenses and benefits, do not have another job, or do not get a pension. In 2014/15 the LEL was £111 per week. If an employer is exempt from PAYE, then they are not required to submit under RTI. Therefore employees working for these employers would not be “known to RTI”. However, the vast majority of employers do operate PAYE.

  • If an employer notices an error or omission in their submissions within the tax year, then this should be corrected by making another submission for that employment for the same payment date. These in-year corrections can be made at any time before the 19th April after the end of the tax year. If the employer notices an error or omission in their information submitted in the previous tax year, employers are required to submit an “Earlier Year Update” (EYU) to correct the information. EYUs have not been considered as part of this analysis; this is partly because it would not be possible to tell when payments reported in an EYU occurred and therefore, how these payments would contribute to spells of being known to RTI. The number of EYUs is very small compared to the overall number of payment records.

  • Some payment records are submitted to HMRC without NINos and, even after attempts to trace a NINo from the National Payments and PAYE System (NPS), cannot be linked to a valid NINo. These records have not been included in this analysis. Current practise is to not issue a NINo to persons who arrive in the UK who expect to stay for short periods, or have no intention to take up employment in the UK (for example: University Degree and Postgraduate Course examiners from EU countries).

Identifying individuals subject to Self-Assessment: Migrant worker registrations data were matched to SA data. From this exercise, the number of individuals with a filing record for at least one tax year between 2007-08 and 2015-16 was identified. This is the number of people who whom HMRC have issued a notice to file for at least one of these tax years. The analysis then identified how many of these individuals had submitted their return in each of the tax years. The data presented in this paper show the number of individuals for have submitted an SA return for the 2014-15 tax year. It is possible that late SA returns could still be received for this tax year.

Other HMRC data shared with ONS

HMRC also shared with us analysis of those who had arrived, or registered for a NINo in the 4 years, to 2013-14 and were subject to income tax NICs and/or received HMRC benefits at some point in 2013/14 – the latest year available. They found 1.0 million such individuals were from the EEA and 0.4 million were from non-EEA countries. We looked at this analysis to see whether it shed light on the divergence between the LTIM and NINo registrations, and while we felt it provided useful context, we think that as this data are a snapshot of activity for a particular cohort it does not add to the analysis already described within this section, which gives a better understanding of the patterns of migration of those registering for NINos. We don’t therefore believe this data change our conclusion that the IPS and LTIM continues to be the best source of information for measuring Long-Term International Migration.

Notes for Annex 3:

  1. RTI was rolled out from the 2012-13 tax year and the earliest complete year of data available for analysis is the 2014-15 tax year. Although data for 2013-14 and 2015-16 have been used to inform decisions about the duration of interactions in 2014-15, the main focus of the RTI analysis is the 2014-15 tax year.

  2. Nationality at point of NINo registration of DWP working age benefit recipients: data to February 2015.

  3. For more details on data sources, methodology and published National Statistics, see the linked statistical bulletin.

Nôl i'r tabl cynnwys

.Glossary

  Description
   
Administrative Data Administrative data refer to information collected primarily for administrative (not research) purposes. These types of data are collected by government departments and other organisations for the purposes of registration, transaction and record keeping, usually during the delivery of a service.
Citizenship This is the term used in the International Passenger Survey (IPS) to define the country for which a migrant is a passport holder. This refers specifically to the passport being used to enter or leave the UK at the time of interview. It does not refer to any other passport(s) which migrants of multiple nationalities may hold. More generally a British citizen as described in IPS statistics includes those with UK nationality usually through a connection with the UK: birth, adoption, descent, registration, or naturalisation. British nationals have the right of abode in the UK
EEA The EEA consists of the 28 countries of the EU, plus Iceland, Liechtenstein and Norway. Swiss nationals are treated as EEA nationals for immigration purposes; however for statistical purposes Switzerland is not included in EEA estimates by ONS.
EU The EU consists of 28 countries: Austria, Belgium, Bulgaria, Croatia, Cyprus, Czech Republic, Denmark, Estonia, Finland, France, Germany, Greece, Hungary, Italy, Latvia, Lithuania, Luxembourg, Malta, Netherlands, Poland, Portugal, Republic of Ireland, Romania, Slovakia, Slovenia, Spain, Sweden and the United Kingdom. Croatia joined the EU in July 2013 - data with a reference period after that date will include Croatia within the EU grouping. Estimates for the EU quoted in this note and accompanying tables exclude British citizens.
EU15 The EU15 consists of Austria, Belgium, Denmark, Finland, France, Germany, Greece, Italy, Luxembourg, Netherlands, Portugal, Republic of Ireland, Spain, Sweden and the United Kingdom. However, EU15 statistics exclude British citizens.
EU8 The EU8 (formerly known as the A8) are the 8 central and eastern European countries that joined the EU on 1 May 2004: Czech Republic, Estonia, Hungary, Latvia, Lithuania, Poland, Slovakia and Slovenia. The EU8 does not include the 2 other countries that joined on that date: Cyprus and Malta. EU8 nationals previously had restrictions on their rights to work and were required to register under the worker registration scheme, but these restrictions were lifted from 1 May 2011.
EU2 The EU2 (formerly known as the A2) are the 2 countries that joined the EU on 1 January 2007: Bulgaria and Romania. Between 2007 and 2013, EU2 nationals had certain restrictions placed on them; in the first 12 months of stay, working Bulgarian and Romanian nationals were generally required to hold an accession worker card or apply for 1 of 2 lower-skilled quota schemes. Other Bulgarian and Romanian nationals could apply for a registration certificate, giving proof of a right to live in the UK. These restrictions were lifted on 1 January 2014.
Interactions data The term used to describe whether an individual 'interacted' with HMRC or DWP systems. This may be for National Insurance, Income Tax or occupational pension purposes, or for claims for tax credits, Child Benefit or claims for other benefits administered by DWP.
International Passenger Survey (IPS) The International Passenger Survey (IPS) is a survey of a random sample of passengers entering and leaving the UK by air, sea or the Channel Tunnel. Between 700,000 and 800,000 people are interviewed on the IPS each year. Of those interviewed, approximately 4,000 people each year are identified as long-term international migrants.
IPS visitor data Data have been provided in this note for those who came to the UK and subsequently left the UK having stayed for one month or less. IPS data for those staying less than one month are based on "actual" flows, as these people have already left the country. They are counted in the year in which they left the UK, having stayed for 30 nights or fewer.
Known to RTI An individual is considered as "known to" RTI if they had at least one payment record fitting a set of criteria with a payment date during a tax month.
L2 Indeterminate Duration This is when a person registers for a NINo and arrives in a year prior to the registration year and who has an inferred stay of more than 52 weeks (evident by the gap between arrival and registration). They have limited interactions that confirm continuous residency.
L2 Longer Duration This is when a person registers for a NINo with interactions of more than 52 weeks at arrival or registration.
L2 Short Duration This is when a person has registered for a NINo with interactions of less than 52 weeks
Lifetime Labour Market Database (L2) The L2 database is a 1% sample of HMRC's National Insurance Recording System (NIRS2). The type of information which is held relates to annualised National Insurance Contributions and related data items such as personal characteristics, employer information, pay details and awards of National Insurance Credits. The data are longitudinal, relating to each year from 1975 to the previous tax year.
Long Term International Migration (LTIM) Long-Term International Migration (LTIM) estimates are produced by combining migration data from the IPS, Home Office data on asylum seekers (including non-asylum enforced removals adjustment), migration to and from Northern Ireland (from the Northern Ireland Statistics and Research Agency) and adjustments for visitor switchers and migrant switchers. These estimates are based on the UN definition of a long-term international migrant.
Long Term Migrant ONS use the UN definition of a long-term international migrant; that is:
  'A person who moves to a country other than that of his or her usual residence for a period of at least a year (12 months), so that the country of destination effectively becomes his or her new country of usual residence.'
Main reason for migration Definite job: Those migrating who have a definite job to go to, on 'business' (excludes diplomats, military personnel, merchant seamen and flight crews) and au pairs. This category was previously known as 'work related'.
   
  Looking for work: Those migrating for work reasons, but who do not have a definite job to go to. This was a new category in 2005 which was previously part of the 'Other' category.
   
  Work related: Those migrating who either have a definite job to go to or who are looking for work. Estimates for the above 2 categories are summed together to produce the estimates for this category.
   
  Formal study: Those whose main reason for migrating is to attend a formal study course in the UK. This category includes unaccompanied school children.
   
  Accompany/join: Those migrating to 'accompany/join' a partner/immediate family. This includes those migrating to get married and those who, on prompting, gave no further reason of their own for migrating.
   
  Other: This category includes working holidaymakers, asylum seekers, those visiting friends and family, anyone taking a long holiday as well as migrants who are travelling for religious reasons.
   
  Going home to live: Those migrants who were 'going/coming home to live' and would not give any other reason relating to work, study or accompany/join when prompted.
   
  No reason stated: Those migrants who were 'immigrating/emigrating' and would not give another reason when prompted.
Migrant Switchers People who enter or leave the UK intending to be a visitor, that is staying or being away for less than 12 months, may actually migrate for more than a year. These people are, in effect, visitors who subsequently become migrants, and are referred to as "visitor switchers". These migrants must therefore be added to the estimate of migration to make it comprehensive. Alternatively, some people who enter or leave the UK intending to migrate (for 12 months or more), may actually stay in or leave for less than a year. These people are known as "migrant and visitor switchers" as they intended to be migrants, but were actually visitors.
   
National Insurance Number (NINo) National Insurance numbers are issued to non-UK nationals immigrating for work. The number of NINos will include people who are coming to the UK for short periods or temporary purposes, as well as long-term migrants. The figures are based on the recorded registration date on the national insurance recording and pay as you earn system (NPS), i.e. after the NINo application process has been completed, and so are not a direct measure of when a person migrated to the UK.
Nationality Nationality is often used interchangeably with citizenship, and some datasets refer to "nationals" of a country rather than "citizens". Different datasets have different ways of establishing someone's nationality. The IPS, NINo and entry clearance visa data are based on people's passports.
Non-EU All other countries (excluding EU)
   
Not known to RTI Individuals who had no RTI payment records with payment dates during the 2014/15 tax year. These individuals could have had RTI payment records with payment dates in other tax years, or not have linked to any information on RTI.
Real time Information (RTI) System Employers are required to submit information on a Full Payment Submission (FPS) via the RTI system to HMRC on or before each day when their employees are paid, through the tax year. As it links to the PAYE system, RTI also includes records for individuals receiving occupational pensions via PAYE. RTI was rolled out from the 2012/13 tax year and the earliest complete year of RTI data available for analysis is for the 2014/15 tax year.
   
  RTI does not include any information about those who solely report their earnings information to HMRC via Self-Assessment (e.g. the self-employed), or those who only receive benefits and are not in employment or receiving an occupational pension. This includes benefits administered by both DWP and HMRC.
RTI Long term Individuals who had at least one RTI payment record with a payment date in 12 consecutive tax months, where at least one of these months was during the 2014/15 tax year.
RTI one month Individuals who had at least one RTI payment record with a payment date in one tax month of the 2014/15 tax year.
RTI short term Individuals had at least one RTI payment record with a payment date for between 2 and 11 tax months (not necessarily consecutive) during the 2014/15 tax year.
Short Term International Migration (STIM) Short-term international migration (STIM) is also based on IPS data. These data include international migrants who have immigrated or emigrated for 1 to 12 months.
   
  To be included as a short-term international immigrant to England and Wales under any of these definitions, a person arriving must have been living outside the UK for 12 months or more.
STIM 'intentions' data The IPS collects information on intended length of stay when people arrive into the UK. Unlike 'actual' STIM, IPS figures on intended short term length of stay are only available for 3 to 12 months.
STIM actual data STIM data are usually based on "actual" flows of migrants, meaning they have actually come to and subsequently left the UK (or vice-versa) rather than simply intending to do so.
Survey of Personal Incomes (SPI) The Survey of Personal Incomes (SPI) is a 10% sample compiled from information held by HMRC about individuals who may be liable to UK income tax. The SPI information comes from three different HMRC administrative sources: the National Insurance and Pay As You Earn (PAYE) Service (NPS) system; the Computerised Environment for Self Assessment system; and the Claims system for those who claimed a repayment after having too much tax deducted at source. Samples are drawn from each of these systems and then combined to create the SPI. The survey is carried out annually by HMRC and covers income assessable to tax for each tax year.
Visa Data These data are collected by the Home Office and include data on individuals subject to immigration controls, including granted entry clearance visas. For visa types see our user guide for immigration statistics.

Nôl i'r tabl cynnwys

Manylion cyswllt ar gyfer y Erthygl

Paul Vickers
migstatsunit@ons.gov.uk
Ffôn: +44 (0)1329 444097

Efallai y bydd hefyd gennych ddiddordeb yn: