Cynnwys
- Introduction
- Main points
- How many British citizens are there in Spain?
- Where are British citizens living in Spain?
- What are British citizens living in Spain doing?
- 1 to 12 month short-term migration to Spain, from England and Wales, for the year to June 2015
- British citizens travelling to Spain for less than 28 days
- How many Spanish citizens are there in the UK?
- What are Spanish citizens living in the UK doing?
- 1 to 12 month short-term migration from Spain to England and Wales
- Spanish citizens travelling to the UK for less than 28 days
- Next steps
- Appendix 1: More information on how the data were compiled
1. Introduction
This report is the first in a series being published to provide more information on British citizens living in the European Union (EU) and EU citizens living in the UK. This series has been created in response to an increased user need for data about the people who may be most likely to be affected by the UK's decision to leave the EU.
The Office for National Statistics (ONS) previously published How many British citizens live in Europe? on this topic. Now, more up-to-date data about British citizens living in the EU is available and more detailed analysis has been conducted using data from the 2011 round of European censuses. In addition, ONS has combined the Annual Population Survey into a 3-year-average dataset, allowing a robust analysis of European citizens living in the UK. Additional analyses of short-term migration and visits of less than 28 days are also included in this report. Together, these sources provide a more complete picture of how many UK and EU citizens are “living abroad”, how many are staying abroad for shorter periods of time and what they are doing while there.
There are three “types” of migrant discussed in this report:
Long-term resident
Those people who have lived abroad for 1 year or longer, or intend to live there for 1 year or longer. However, because this doesn’t include those spending part of the year abroad, two further “types” are considered.
Short-term migrant
Those spending 1 to 12 months living abroad. This can be for any reason and would include those who spend part of the year living abroad (for example, winter in Spain and summer in UK).
Visitor
Those spending up to 28 days abroad. This group is largely holidaymakers and will include those who repeatedly spend time in Spain.
This report has been produced in partnership with the Instituto Nacional de Estadistica (INE), the Spanish National Statistics institute. It includes data from INE as well as data from ONS.
All of the statistics in this report use a citizenship definition to identify migrants, as this is considered to be the most useful in identifying those who may be most likely to be affected by the UK's decision to leave the EU.
This is particularly the case when compared with the use of a “country of birth” definition of a migrant, which can miss some groups of citizens. Differences in the use of these two definitions are fully explained in the January 2017 report, What information is there on British migrants living in Europe?
Citizenship can change over time and multiple citizenships can be held. The way that multiple citizenships are dealt with is different between the different data sources in this report. For more information, please see Appendix 1.
Nôl i'r tabl cynnwys2. Main points
The population of British citizens resident in Spain was 296,600 in 2016.
- 121,000 (40%) British residents in Spain were aged 65 and over in 2016; this number has more than doubled since 2006.
In addition, there were 219,000 visits of between 1 and 12 months to Spain by British citizens in the year to June 2015; such visits are mainly for “other” purposes – that is, not for work or study.
There were more than 13.0 million visits of less than 28 days to Spain in 2016.
- The vast majority were holidays, but there are significant family or friend links to Spain; 643,000 visits were made to visit them and around 344,000 visits were for business.
- Spain is the third most popular destination in EU to visit family and friends.
There were 116,000 Spanish citizens resident in the UK in 2013 to 2015; around half of these were aged 20 to 39 years old.
78% of Spanish citizens working in the UK worked in three industrial sectors: public administration, education and health, banking and finance, and distribution, hotels and restaurants.
3. How many British citizens are there in Spain?
According to the Instituto Nacional de Estadistica (INE), the Spanish National Statistics Office, the total number of British citizens registered as living in Spain on 1 January 2016 (the latest data available) was 296,600.
This estimate is comparable to the 2011 Spanish Census data, which estimated 308,805 British residents living in Spain on 1 November 2011.
Changes since 2011 are notable in the age of British citizens living in Spain. Fewer are under 15 years of age. Those aged 65 and over accounted for 32% of British citizens living in Spain in 2011, compared with 40% in 2016 (Figure 1).
Figure 1: The number of British citizens resident in Spain for 1 year or more, by age, 2011 and 2016
Source: Instituto Nacional de Estadistica Population figures, Instituto Nacional de Estadistica 2011 Census
Download this chart Figure 1: The number of British citizens resident in Spain for 1 year or more, by age, 2011 and 2016
Image .csv .xlsFigure 2 shows how the older, 65 years and over, British resident population of Spain has more than doubled in the last 10 years. While the size of other age groups has declined since 2008, the number of those aged 65 and over in Spain continued to increase.
The number of older people moving to Spain has been stable since 2008, so the later part of the rise is most likely caused by the already resident population ageing.
Figure 2: The number of British citizens resident in Spain for 1 year or more, by age, from 2002 to 2016
Source: Instituto Nacional de Estadistica, Population figures
Download this chart Figure 2: The number of British citizens resident in Spain for 1 year or more, by age, from 2002 to 2016
Image .csv .xlsUK State Pensions claimed by those living in Spain can help to corroborate Spanish census data for the older, 65 years and over, age group. The Department for Work and Pensions (DWP) report (from administrative data1) showed that 108,433 recipients of the UK State Pension were resident in Spain at November 2016. These data, shown in Figure 3, also show there was a sharp growth in the number of people receiving a UK State Pension in Spain between 2002 and 2009. This growth slowed down and for each year since 2012 the number of recipients of the UK State Pension resident in Spain has been broadly similar. Anybody with qualifying National Insurance contributions or credits can receive the State Pension, so recipients are not necessarily British. Registering a Spanish address is not confirmation that the recipient is a long-term resident of Spain.
Figure 3: Recipients of the UK State Pension living in the European Union, not including the UK, from 2002 to 2016
Source: Department for Work and Pensions, State pensions claimed abroad caseload
Download this chart Figure 3: Recipients of the UK State Pension living in the European Union, not including the UK, from 2002 to 2016
Image .csv .xlsNotes for: How many British citizens are there in Spain?
DWP administrative data on State Pension recipients is available online.
Spanish census and population figures
Both the Spanish census and population figures are based on the municipal register of Spain. Registration is obligatory.
The population figures are an estimate, calculated by adding births and immigration (measured as registration on the municipal register) and removing deaths and emigration (measured as deregistration from the municipal register plus a statistical adjustment for lag in deregistration) from the census estimate.
The 2011 Census used the municipal register as the basis for the population, adjusting for under- and over-counting using data from a sample of 12% of the population of Spain.
Both the population figures and the census estimates those long-term migrants who have lived or intend to live in Spain for more than a year.
It doesn’t estimate those who live in Spain for shorter periods of time, or who split their time each year between Spain and the UK.
State Pension
These data on State Pension recipients include both British citizens and non-British citizens who qualify for a UK State Pension. The data are for people who have notified DWP that they are resident overseas. People are required to inform DWP about any change in their circumstances, including a change of address. DWP have data matching arrangements with Spain, which allows information to be shared about UK State Pension recipients resident in Spain, including notifications of death.
Those living between Spain and the UK might register to live in Spain and thus be counted in the Spanish population estimates, but register their pension to a home they maintain in the UK.
4. Where are British citizens living in Spain?
The coastal regions of southern Spain (Figure 4) are the most common places for British residents in Spain to live.
Figure 4: British citizens resident in Spain, 2011, by province, as a percentage of the total of British citizens resident in Spain
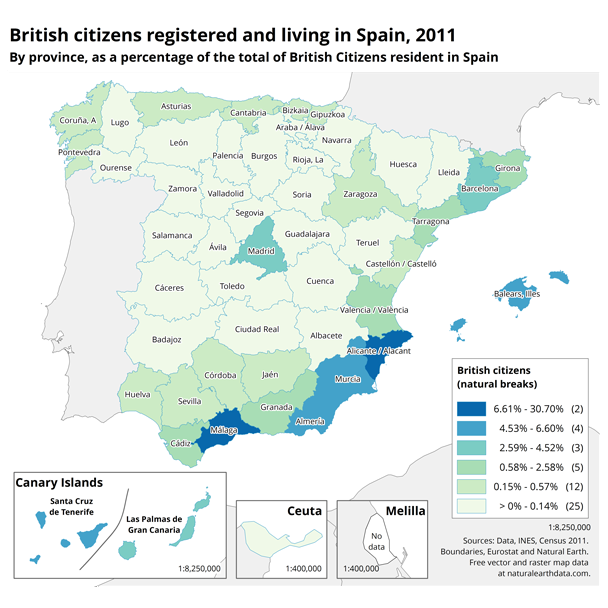
Source: Instituto Nacional de Estadistica, 2011 Census
Download this image Figure 4: British citizens resident in Spain, 2011, by province, as a percentage of the total of British citizens resident in Spain
.png (218.6 kB) .xlsx (12.1 kB)
5. What are British citizens living in Spain doing?
The most recent data available that gives information on the jobs that British citizens are doing in Spain is from the Spanish Census 2011 data, provided by the Instituto Nacional de Estadistica (INE).
Of the 308,805 British citizens living in Spain at the time of the 2011 Census, 69,305 were working (22%), 148,625 were retired (48%) and 34,900 were unemployed (11%). Those too young to work, those who were economically inactive (for example, those staying at home with children) and students make up the remainder.
The most popular industry for those who were working was education, with 13,660, or 20% of all British workers in Spain. Accommodation and food service activities was second, employing 17% of British workers in Spain (Figure 5).
Figure 5: British citizens in employment in Spain by industry of employment, 2011
Source: Instituto Nacional de Estadistica, 2011 Census
Download this chart Figure 5: British citizens in employment in Spain by industry of employment, 2011
Image .csv .xlsGiven the changes we have seen in the age structure of the population of British citizens living in Spain between 2011 and 2016, we might expect the proportion of retirees to be higher in 2016 and the proportion of workers to be lower.
Nôl i'r tabl cynnwys6. 1 to 12 month short-term migration to Spain, from England and Wales, for the year to June 2015
There were 219,000 short-term visits (with a confidence interval of +/-36,000) to Spain by British citizens for between 1 and 12 months in the year to June 2015, the latest for which data are available. This data estimates the number of visits, rather than the number of people and will include some instances of individuals making multiple visits.
Short-term migration to Spain accounts for more than a third (35%) of the 621,000 visits (with a confidence interval of +/- 59,000) to the European Union for between 1 and 12 months in the year to June 2015.
Figure 6: Short-term migration by British citizens to Spain, 2003 to 2015
Source: Office for National Statistics International Passenger Survey, Short-Term International Migration Estimates
Notes:
- Data for mid 2014 to 2015 are provisional.
- . - No contact.
Download this chart Figure 6: Short-term migration by British citizens to Spain, 2003 to 2015
Image .csv .xlsIn these data, employment (migration to work, paid in the new country in which the migrant works) and work (other) (visiting on business for their existing employer and self-employment) are combined as “work”. Study includes all formal higher and further education but excludes evening and informal tuition. “Other” reasons include holidays and travelling; visiting or accompanying family and friends; working holidays; medical treatment and religious pilgrimage.
“Other” is by far the most common reason for short-term migration to Spain (Figure 6). This would include living in a second home (owned or rented) for part of the year, prolonged travelling (for example, in a campervan or caravan) as well as working holidays such as summer and ski seasons, where work facilitates an experience and is not the principal reason for visit.
Notes for: 1 to 12 month short-term migration to Spain, from England and Wales, for the year to June 2015
Short Term International Migration data
2015 are provisional data.
Short-Term International Migration estimates are derived from the International Passenger Survey (IPS), which is a sample survey and therefore subject to some uncertainty. When data are disaggregated to a country level confidence intervals will be larger, but the data are useful as a broad indication of trends.
These data only include those travelling to and from England and Wales.
This data source estimates the number of journeys, rather than the number of people visiting.
There is evidence to suggest that due to the sampling design and coverage of the International Passenger Survey (IPS) between 2004 and 2008, coverage of some routes may have caused some short-term migrants to be missed. For more information, please refer to our Quality of Long-Term International Migration estimates from 2001 to 2011 full report.
7. British citizens travelling to Spain for less than 28 days
British citizens made 13.0 million visits of less than 1 month to Spain in 2016, which were 32% of the 40.3 million visits made by British citizens to other European Union countries in 2016.
Spain is by far the most common EU holiday destination – more than 11.9 million visits by British citizens were for holidays, followed by France, with 4.9 million holidays (Figure 7).
Spain is not only popular as a tourist destination. It was the third most common destination in the EU for visits to friends and family, with 643,000 visits for this purpose by British citizens in 2016. It was also the fifth most visited country in the EU by British citizens for business, with 344,000 visits made for this reason in 2016.
Figure 7: British citizens' visits to EU, for less than 28 days, by reason for visit, 2016
Source: Office for National Statistics, International Passenger Survey
Notes:
- *Remainder includes (by number of visits, most to fewest): Denmark, Croatia, Czech Republic, Hungary, Sweden, Bulgaria, Finland, Romania, Latvia, Slovakia, Slovenia, Luxembourg, Lithuania, Estonia.
Download this chart Figure 7: British citizens' visits to EU, for less than 28 days, by reason for visit, 2016
Image .csv .xlsSpain has long been a popular holiday destination, as Figure 8 shows. Despite a large drop in visits from 2008 to 2009, probably as a result of the financial crisis, there has since been a steady recovery in the number of visits to Spain by British citizens.
Figure 8: Number of visits to Spain by British citizens, for less than 28 days, by reason for visit, 2002 to 2016
Source: Office for National Statistics, International Passenger Survey
Download this chart Figure 8: Number of visits to Spain by British citizens, for less than 28 days, by reason for visit, 2002 to 2016
Image .csv .xlsNotes for: British citizens travelling to Spain for less than 28 days
International Passenger Survey visitor data
This counts only the number of visits made – there may be multiple visits by one person.
These data include British citizens who are resident in the UK, but don’t include British citizens resident in other countries.
These data might also include (but not identify) those who travel to and from Spain regularly.
For the purposes of this report, data are provided for only those visits of 28 days or less, so that there is no overlap with short-term migration estimates. Regular Overseas Travel and Tourism reports do not make this distinction.
Further information on the quality of the International Passenger Survey is available.
8. How many Spanish citizens are there in the UK?
There were 132,000 Spanish citizens living in the UK in 2015, according to the Population by country of birth and nationality estimates, based on one year of data from the Annual Population Survey (APS).
For more detailed analysis it is necessary to use the 3-year pooled APS dataset, which provides a larger sample than annual data. It is an average for the years January 2013 to December 2015, and estimates 116,000 Spanish citizens were living in the UK.
Of all Spanish citizens resident in the UK 92% live in England and 6% in Scotland1.
Comparison of the resident population of Spanish citizens (116,000) in the UK and British citizens in Spain (296,600), (Figure 9), shows a large difference in the age profile, with many more aged 60 or over in the British population in Spain. Even though the Spanish population in the UK is about a third of the size of the British population in Spain, 20 to 39 year old Spanish citizens in the UK outnumber British citizens in Spain of the same age.
Figure 9: Population pyramid comparing British citizens living in Spain and Spanish citizens living in the UK, Annual Population Survey (2013 to 2015) and Spanish Population estimates (2016)
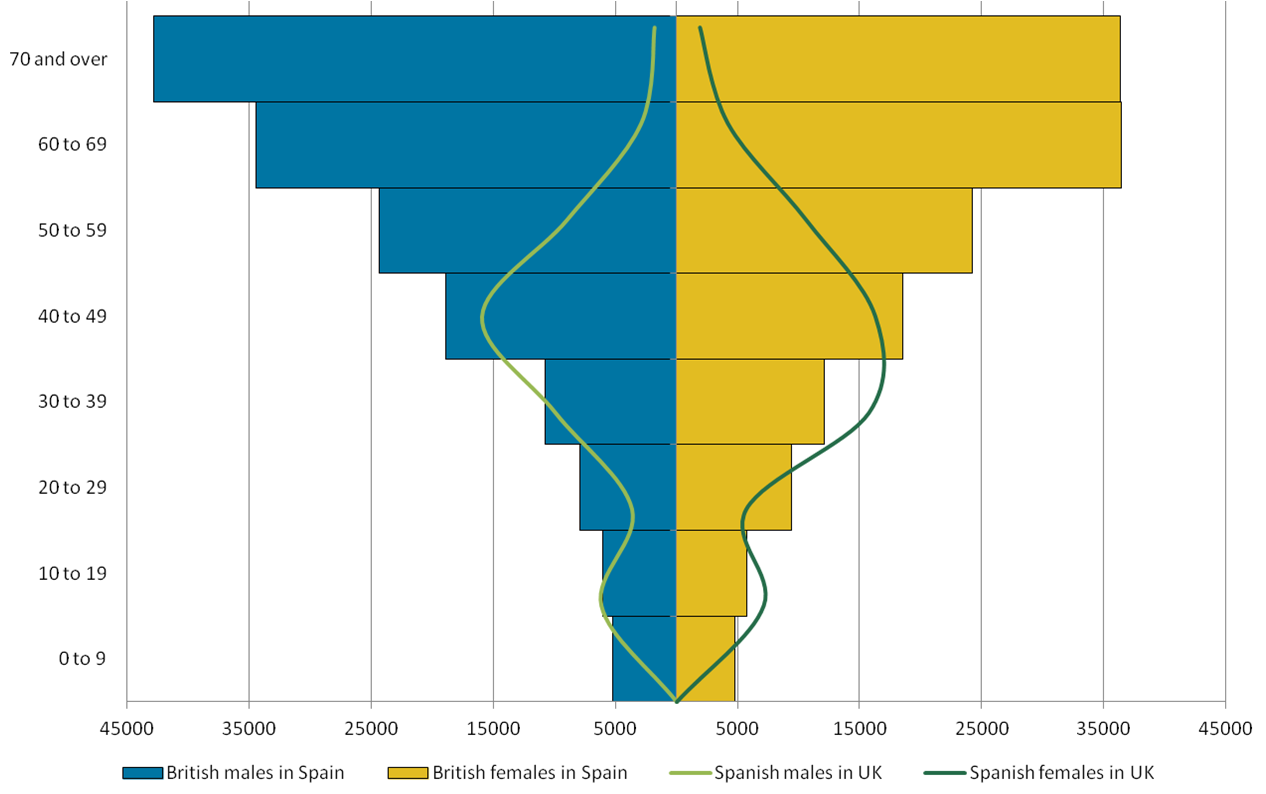
Source: Office for National Statistics, 3-year pooled Annual Population Survey, annual average from January 2013 to December 2015 and Instituto Nacional de Estadistica, Population Figures
Download this image Figure 9: Population pyramid comparing British citizens living in Spain and Spanish citizens living in the UK, Annual Population Survey (2013 to 2015) and Spanish Population estimates (2016)
.png (100.3 kB) .xlsx (12.1 kB)
Notes for: How many Spanish citizens are there in the UK?
Estimates for Northern Ireland and Wales are not available, due to disclosure control.
Annual Population Survey (APS)
Data are collected from individuals in households, but do not include most communal establishments (managed accommodation such as halls of residence, hostels and care homes); this means that students living in communal establishments will only be included in APS estimates if their parents (resident in a household) are sampled and include the absent student.
Students living in non-communal establishments will be captured in APS sampling.
The APS will include long-term migrants and some short-term migrants although it is unlikely to include short-term migrants living in the UK for very short periods of time.
The APS 3-year pooled dataset Jan 2013 to Dec 2015 is less sensitive to more volatile trends than 1-year datasets as this dataset encompasses 3 years.
Population by Country of Birth and Nationality is the latest annual data, for 2015.
Further information on the quality of the Annual Population Survey is available.
9. What are Spanish citizens living in the UK doing?
Of the 116,000 Spanish citizens living in the UK in 2013 to 2015, there were 25,400 under 16 or over 64 years old (22%), 68,200 were working (59%), and 5,500 were unemployed (5%). There were 6,100 students (5%) and 10,100 were otherwise economically inactive (9%), according to the 3 year pooled Annual Population Survey (APS) for 2013 to 2015 (note that totals may not sum due to rounding).
Note that in the APS, halls of residence are not sampled and so students may be underrepresented.
Of all Spanish citizens working in the UK 78% were working in three industrial sectors: public administration, education and health (19,400 – more than half in the education sector), banking and finance (17,000) and distribution, hotels and restaurants (16,700) (Figure 10).
In the total workforce population of the UK, 65% of workers work in these industrial sectors.
Spanish citizens are more likely than the total population to work in banking and finance (25% of Spanish citizens versus 17% of the total workforce) and distribution, hotels and restaurants (25% versus 19%).
Figure 10: Spanish citizens in employment in the UK by industry of employment, 2013 to 2015
Source: Office for National Statistics, 3-year pooled Annual Population Survey, annual average from January 2013 to December 2015
Notes:
- Other includes Agriculture, forestry and fishing, Energy and water, Construction, Manufacturing and Other services. Estimates for these categories are not available due to disclosure control.
Download this chart Figure 10: Spanish citizens in employment in the UK by industry of employment, 2013 to 2015
Image .csv .xlsA breakdown of the public administration, education and health sector shows the majority of Spanish citizens are working in education (10,900).
Spanish migrants are working mostly in professional (17,900) or elementary (12,400) occupations in the UK (Figure 11). They are also more likely than the whole UK population to be working in these occupations.
(26% of Spanish citizens versus 20% of the total workforce work in professional occupations, whilst 18% of Spanish citizens versus 11% of the total workforce work in elementary occupations).
Professional occupations are those that require a degree or equivalent qualification, postgraduate qualifications and/or a formal period of experience-related training. Elementary occupations require a minimum general level of education (that is, that which is acquired by the end of the period of compulsory education).
Figure 11: Spanish citizens in employment in the UK by level of occupation, 2013 to 2015
Source: Office for National Statistics, 3-year pooled Annual Population Survey, annual average from January 2013 to December 2015
Notes:
- Other includes Process, Plant And Machine Operatives, Administrative And Secretarial Occupations, Skilled Trades Occupations and Sales And Customer Service Occupations. Estimates for these categories are not available due to disclosure control.
Download this chart Figure 11: Spanish citizens in employment in the UK by level of occupation, 2013 to 2015
Image .csv .xlsOther includes process, plant and machine operatives, administrative and secretarial occupations, skilled trades occupations and sales and customer service occupations. Estimates for these categories are not available due to disclosure control.
The Office for National Statistics report International Migration in the Labour Market provides information on the number and characteristics of migrants in the labour market.
Nôl i'r tabl cynnwys10. 1 to 12 month short-term migration from Spain to England and Wales
In the latest period, for the year ending June 2015, there were 48,000 short-term visits by Spanish citizens to England and Wales.
In these data, “employment” (migration to work, paid in the new country in which the migrant works) and “work (other)” (self-employment and visiting on business for their existing employer) are combined as “work”.
Study includes all formal higher and further education but excludes evening and informal tuition. “Other” reasons include holidays and travelling; visiting or accompanying family and friends; working holidays; medical treatment and religious pilgrimage.
As can be seen in Figure 12, the latest data for the year ending June 2015, there were 16,000 visits for work and 14,000 visits were for study. This compares with France, which for the same year has the highest number of short-term visits for work (20,000) and also study (20,000).
Figure 12: Short-term migration of Spanish citizens to England and Wales (2003 to 2015)
Source: Office for National Statistics International Passenger Survey, Short-Term International Migration Estimates
Notes:
- Data for mid 2014 to 2015 are provisional.
Download this chart Figure 12: Short-term migration of Spanish citizens to England and Wales (2003 to 2015)
Image .csv .xlsNotes for: 1 to 12 month short-term migration from Spain to England and Wales
Short-term International Migration data
2015 are provisional data.
Short-term international migration estimates are derived from the International Passenger Survey (IPS), which is a sample survey and therefore subject to some uncertainty. When data are disaggregated to a country level confidence intervals will be larger, but data are useful as a broad indication of trends.
These data only include those travelling to and from England and Wales.
This data source estimates the number of journeys, rather than the number of people visiting.
There is evidence to suggest that due to the sampling design and coverage of the International Passenger Survey (IPS) between 2004 and 2008, coverage of some routes may have caused some short-term migrants to be missed. For more information, please refer to our Quality of Long-Term International Migration estimates from 2001 to 2011 full report.
11. Spanish citizens travelling to the UK for less than 28 days
Far fewer Spanish citizens visit the UK than British citizens visit Spain. There were 1.8 million visits by Spanish citizens in 2016. Less than half were for holidays (849,000), while 27% of visits to the UK from Spanish citizens were to visit friends and family, and 22% were for business.
Figure 13 shows that the number of visits to the UK by Spanish citizens has increased since 2002, particularly for holidays. Holidays in the UK by Spanish citizens have increased fourfold since 2002.
Figure 13: Number of visits to the UK by Spanish citizens, for less than 28 days, by reason for visit, 2002 to 2016
Source: Office for National Statistics, International Passenger Survey
Download this chart Figure 13: Number of visits to the UK by Spanish citizens, for less than 28 days, by reason for visit, 2002 to 2016
Image .csv .xlsFigure 14 shows the number of visits to the UK by citizens of European countries, with visits from France the most common.
Business is the reason for 6,623,000 visits of less than a month to the UK by EU citizens. As Figure 14 shows, Polish citizens made the most visits for business reasons, with 879,000, followed by French citizens (762,000) and German citizens (759,000).
By comparison, British citizens1 (Figure 7) made 3,877,000 business visits to the EU in 2016. The most common countries to visit were France (678,000 visits) and Germany (668,000 visits).
Figure 14: Number of visits to the UK by citizens of European countries, for less than 28 days, by reason for visit, 2016
Source: Office for National Statistics, International Passenger Survey
Notes:
- *Remainder includes (by number of visits, most to fewest): Austria, Finland, Bulgaria, Greece, Lithuania, Slovakia, Latvia, Malta, Croatia, Cyprus, Luxembourg, Slovenia, Estonia).
Download this chart Figure 14: Number of visits to the UK by citizens of European countries, for less than 28 days, by reason for visit, 2016
Image .csv .xlsNotes for: Spanish citizens travelling to the UK for less than 28 days
Not including British citizens resident overseas.
International Passenger Survey Visitor data
This counts only the number of visits made – there may be multiple visits by one person. These data might also include (but not identify) those who travel to and from the UK regularly.
For the purposes of this report, data are provided for only those visits of 28 days or less, so that there is no overlap with short-term migration estimates. Regular Overseas Travel and Tourism reports do not make this distinction.
Further information on the quality of the Annual Population Survey is available.
12. Next steps
The Office for National Statistics (ONS) is in the process of Improving the evidence on migrants in the UK, aiming to make better use of data sources and offer more detail on migrants living in the UK. Improvements to international data sources on migration could add to the body of evidence on British citizens living in the EU, which will continue to be monitored by ONS. In addition, it is possible that access to data sources, such as the Department of Health European Health Insurance Card (EHIC), may contain useful detailed information.
Nôl i'r tabl cynnwys13. Appendix 1: More information on how the data were compiled
This report provides updated figures to those previously published in January 2017 in the report, What information is there on British migrants living in Europe:
The January 2017 report established the resident population of citizens as the most useful statistics for identifying who may be affected by the UK's decision to leave the EU. This is particularly the case when compared with the use of a “country of birth” definition of a migrant, which can miss some groups of citizens. It should be noted that people can change their citizenship and some people hold multiple citizenships.
This report uses a variety of additional data sources to provide more up-to-date data on the resident populations and the number of short-term migration events and visits by British citizens to the EU (and by EU citizens to the UK).
These data sources are not always comparable (see Table 1 for the differences between definitions used). For example, the sources used to identify British citizens in Spain are on a different basis to the sources used to identify Spanish citizens in the UK. However, they have been selected as the best available data to indicate the number of citizens in the UK and Spain.
Table 1: Comparison of definitions between the data sources used in this report
| Type of migrant | Source | Citizenship | Migrant definition | ||
| Long-term resident (to and from the UK) | British citizens in Spain | Census 2011, Instituto Nacional de Estadistica (INE) | Yes, estimates are by citizenship. Those with multiple citizenships have one citizenship selected for reporting. This is determined in the following order: Spanish, other EU citizenship, non-EU citizenship | Those who have lived abroad for 1 year or longer, or intend to live there for 1 year or longer. | |
| Population estimates, INE | Yes, estimates are by citizenship. Those with multiple citizenships have one citizenship selected for reporting. This is determined in the following order: Spanish, other EU citizenship, non-EU citizenship. | Those who have lived abroad for 1 year or longer, or intend to live there for 1 year or longer. | |||
| UK State Pensions claimed abroad, Department for Work and Pensions (DWP) | Does not provide estimates by citizenship. | No definition is applied, although it is assumed that those claiming pension in another country will be a long-term resident. | |||
| Spanish citizens in UK | Annual Population Survey, Office for National Statistics (ONS) | Yes, estimates are by citizenship. Citizenship is a response to “What nationality do you hold?” | The APS will include long-term migrants and some short-term migrants although it is unlikely to include short-term migrants living in the UK for very short periods of time. | ||
| Short-term migrants (to and from England and Wales) | British citizens in Spain | Short-Term International Migration estimates, ONS | Yes, estimates are by citizenship. | Those that migrate between 1 to 12 months for all reasons. | |
| Spanish citizens in UK | Citizenship is collected as “passport held” and migrant usually shows passport to the interviewer. | ||||
| Visitors (to and from the UK) | British citizens in Spain | Visitor estimates, ONS | Yes, estimates are by citizenship. | Visits abroad. For the purposes of this report, data is provided for only those visits of 28 days or less, so that there is no overlap with short-term migration estimates. | |
| Spanish citizens in UK | Citizenship is collected as “passport held” and migrant usually shows passport to the interviewer. | ||||