Cynnwys
- Main points
- Introduction
- International migration has contributed to population growth in England in recent years
- More recent migrants are more likely to privately rent than live in social housing or own their own home
- Changes in housing tenure for UK, EU and non-EU born residents
- Regional comparisons show different patterns
1. Main points
- Housing demand is influenced by a number of complex factors, including population size, household structure, age of residents and the condition of the economy, as this affects employment, interest rates and other market incentives.
- England’s resident population increased by 11% between 2001 and 2015, from 49.4 million to 54.8 million; the scale and nature of this growth has varied by region.
- Alongside an increase in population, there has also been a 2% increase in the number of households between 2011 and 2015, to 21.9 million households in England.
- Recent migrants to the UK are more likely to live in the private rented sector; 88% of EU born residents arriving between 2014 and 2016 privately rented, compared to 29% of those arriving between 1991 and 2000, although these trends are also influenced by age, as younger people are also more likely to privately rent.
- The pattern of change and growth has differed across the three main housing tenures, with the number of households in the private rented sector more than doubling between 2001 and the year ending March 2016, from 2.1 million to 4.5 million households; this is influenced by a number of factors.
2. Introduction
The impact of international migration1 on different sectors of the housing market has long been of public interest. Housing demand is influenced by a number of factors, including population size, household structure, age of residents and the condition of the economy, as this effects employment, interest rates and other market incentives. Housing needs are also influenced by overall population size and changes in the structure of the population caused by both migration and “natural change” (births minus deaths)2. This article provides information about international migration and population change; and latest data on changes in housing trends in England. Associations between population change and changes in housing tenure are complex and it is important to recognise there is not a direct relationship between population change as a result of international migration and housing demand.
Immigration to the UK and how it influences housing and local areas is a complex subject. The extent of this influence is dependent on how reactive housing supply is to changes in housing demand. For example, if more new migrants rent, this would bring into use properties that were not previously used or under-occupied. In addition, internal migration from one part of the UK to another (for example, to London or the South East) is likely to continue to generate demand and respond to changes in international migration. There are a range of further factors, mentioned in this section, which could also affect prices and rents. This means it is not possible to directly infer impact from the data we report on in this article.
Migrant characteristics will influence the demand for different types of housing; for example, how long they spend in the UK, their rights to access housing in the social rented sector, whether they are working or studying, and how much they earn. Their housing choices in terms of tenure will also have an effect and these choices are likely to change the longer they remain living in the UK3.
This article mostly considers international migrants from the perspective of their country of birth, because it allows us to look at the longer-term patterns of tenure, rather than focusing solely on current foreign nationals. However, it should be noted that some of those born abroad will have always been British citizens, have acquired British citizenship in the intervening years, or lived in the UK for the majority of their lives. Further information on the relationship between country of birth and nationality can be found in 2011 Census analysis: Social and Economic Characteristics by Length of Residence of Migrant Populations in England and Wales.
This article draws on data from the 2001 and 2011 Censuses, as well as calendar year data from the Annual Population Survey (APS) for 2011 to 2016. Housing data presented in this article are for England only, as housing is a devolved policy area in Wales, Scotland and Northern Ireland.
UK, EU and non-EU are the main country of birth groupings used in this article; Annex 1 shows which countries are included in these groupings across different data sources.
The Office for National Statistics is grateful to Government Statistical Service analysts in the Department for Communities and Local Government and the Home Office for their contributions to this article.
Notes for: Introduction
“International Migration” is used to describe the movement of people into and out of the UK, excluding visitors. References to “migration” throughout the rest of this article are to be interpreted as international migration.
Further information about the impact of population change was reported by the Office for National Statistics in February 2016 and updated in March 2017.
For example, please refer to Migration Observatory: Migrants and Housing in the UK – Experiences and Impacts.
3. International migration has contributed to population growth in England in recent years
One of the many factors likely to influence changes in housing demand in England is population growth. England’s resident population increased by 11% between 2001 (49.4 million) and 2015 (54.8 million)1. Population change varies between regions. The following interactive maps (Figure 1) show overall population change between mid-2011 and mid-2015 alongside each component of population change.
These maps show that local authorities in London have experienced some of the largest increases in population between mid-2011 and mid-2015; this growth has been driven by both international migration and natural change, which have been slightly offset by negative net internal migration.
Of the 10 local authorities with the largest increases in net international migration between mid-2011 and mid-2015, only two – Oxford (South East) and Coventry (West Midlands) – were outside London. In both cities, natural change also contributed to population growth, while net internal migration slightly offset population growth2.
Figure 1: Population change in England, 2011 to 2015 (mid years) by local authority
Embed code
Source: Office for National Statistics - Population Estimates for UK, England and Wales, Scotland and Northern Ireland: mid-2015
These data show how international migration has increased the population of England and is likely to have also increased the overall demand for housing. However, it should be stressed that this relationship is indirect, because population increases contribute to housing via household formation and household size. Migrants who live together, for example, in a house share, will create a lesser housing demand than those living separately.
There was a 2% increase in the number of households3 in England between 2011 and 2015, to 21.9 million households4. In 16% (3.4 million) of these households, the household reference person (HRP)5 was born outside of the UK (10% non-EU and 5% EU). The number of households where the HRP was EU born increased by 21% between 2011 and 2015 (from 978,000 to 1.2 million), whereas the number of households where the HRP was non-EU born increased by 6% over the same period (from 2.1 million to 2.2 million). For comparison, the number of households where the HRP was born in the UK increased by 1% between 2011 and 2015, from 18.3 million to 18.4 million. Household projections statistics for 2014 to 20396 show that the overall number of households in England is projected to increase from 22.7 million in 2014 to 28.0 million in 2039. Net migration (as assumed in the population projections) accounts for 37% of this projected household growth.
In terms of household size, it should be noted that international migrants tend to live in larger households. In 2015, the average household size in England where the HRP was born in the UK was 2.3 residents per household. The average household size where the HRP was born outside the EU was 3.0 residents per household, which is slightly higher than that for households where the HRP was EU born (2.6 residents).
Where the HRP was UK born, average household size has remained steady over the last 5 years, whereas the average household size has increased where the HRP is EU or non-EU born. Differences in household sizes may be further explained by the length of time a migrant has spent in England, their reason for migrating (study, work), cultural differences, household composition, or by tenure. For example, the UK born population is more likely to live in the owner-occupied sector, where household sizes are smaller, whereas the private rented sector is more likely to contain households where several adults share a home. UK born households will also include more older people, including households where a former partner has died. These factors can all influence average household sizes.
Average household sizes do not show whether a household is living in a dwelling with enough space for all household members. Occupancy ratings provide a measure of whether a household's accommodation is over or under-occupied and can be based on the number of rooms or bedrooms in a dwelling. Data from the 2011 Census7 show that households with EU and non-EU born HRPs are more likely to live in over-occupied accommodation than households with UK born HRPs and this varies by region. Tenure and age should be considered when analysing occupancy ratings by country of birth of HRP, since these are also likely to be related to occupancy.
Notes for: International migration has contributed to population growth in England in recent years
Based on mid-year population estimates.
Further analysis of population change by local authority in England is available in the ONS Population Estimates Analysis Tool.
A household is defined as one person living alone, or a group of people (not necessarily related) living at the same address who share cooking facilities and share a living room, sitting room or dining area.
These figures are taken from the Annual Population Survey (APS). The latest available January to December APS data for households is for 2015. On average, 2.5% of HRPs had a missing country of birth for each year 2011 to 2015. HRPs with a missing country of birth have been excluded from this analysis.
The household reference person (HRP) is:
- The member of the household in whose name the accommodation is owned or rented, or is otherwise responsible for the accommodation. In households with a sole householder that person is the HRP.
- In households with joint householders the person with the highest income is taken as the HRP.
- If both householders have exactly the same income, the older is taken as the HRP.
Based on analysis of the dataset CT0640_2011 Census - Age of Household Reference Person by occupancy rating (bedrooms) by sex of HRP by country of birth of HRP - Regions London Boroughs. Further information about occupancy ratings is available from 2011 Census occupancy rating (rooms) metadata.
4. More recent migrants are more likely to privately rent than live in social housing or own their own home
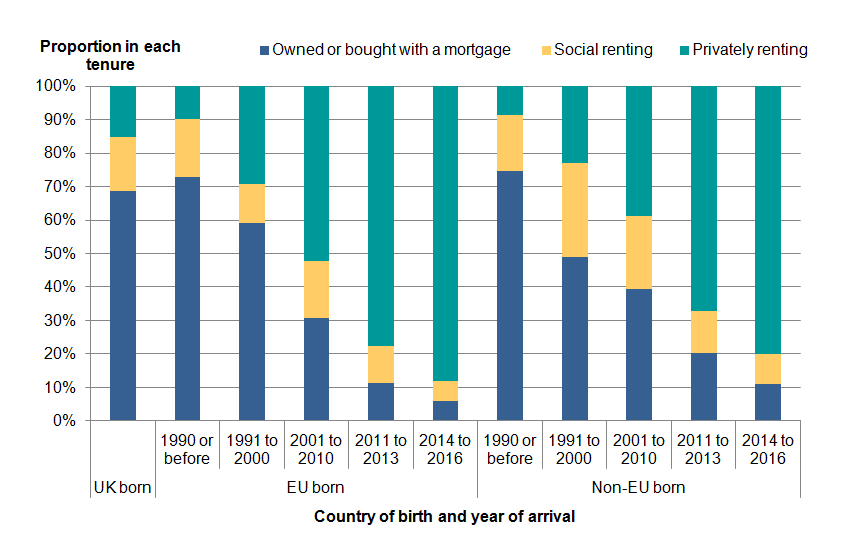
Figure 2 shows that 88% of EU born residents and 80% of non-EU born residents arriving between 2014 and 2016 privately rented1. EU born residents who had immigrated to the UK before 2001 were more likely to own or have bought their house with a mortgage; 59% of those arriving between 1991 and 2000 and 73% of those arriving before 1990 lived in homes that they own, similar to the proportion of UK born residents in the owner-occupied sector in 2016 (69%).
Figure 2: Proportion of UK, EU and non-EU born residents by housing tenure and year of arrival, England, 2016
Source: Source: Office for National Statistics – 2016 Annual Population Survey
Notes:
- “Owned or bought with a mortgage” includes those who own their house outright or have bought a house with a mortgage (including shared ownership).
- “Social renting” includes those living in council or housing association accommodation.
- “Privately renting” includes those renting from a landlord or letting agency, an employer or household member, friend or relative of a household member, or any other form of privately renting.
- Those where country of birth was not specified or missing and those where tenure was “squatting”, not specified, or missing have been excluded from this analysis.
- “Year of arrival” in this analysis refers to year of first arrival in the UK.
- Proportions shown for UK born residents are not broken down by year of arrival because the APS does not ask UK born respondents about their year of arrival in the UK.
Download this image Figure 2: Proportion of UK, EU and non-EU born residents by housing tenure and year of arrival, England, 2016
.png (21.1 kB) .xls (29.7 kB)
Notes for: More recent migrants are more likely to privately rent than live in social housing or own their own home
- APS estimates for individuals rather than households.
5. Changes in housing tenure for UK, EU and non-EU born residents
Figure 3 shows the number of residents across the three main housing tenures by country of birth1 between 2001 and 2016. In 2016, two-thirds of UK born residents lived in housing owned or bought with a mortgage (69%), compared to a little over half of EU born residents living in privately rented housing (52%). Non-EU born residents tended to live in either privately rented housing (34%) or in housing owned or bought with a mortgage (47%). These figures need to be treated with care, as they can be affected by a number of factors, including the availability and affordability of housing in parts of the country where migrants have tended to settle. In addition, differences in tenure by year of arrival (as analysed in section 4) could mean that the proportion of immigrants renting rises because more of those immigrants arrived recently.
Figure 3: Estimated population of UK, EU and non-EU born residents by housing tenure in England, 2001, 2011 and 2016

Source: Source: Office for National Statistics – 2001 and 2011 Censuses, 2016 Annual Population Survey
Notes:
- “Owned or bought with a mortgage” includes those who own their house outright or have bought a house with a mortgage (including shared ownership).
- “Social renting” includes those living in council or housing association accommodation.
- “Privately renting” includes those renting from a landlord or letting agency, an employer or household member, friend or relative of a household member, or any other form of privately renting.
- Those where country of birth was not specified or missing and those where tenure was “squatting”, not specified, or missing have been excluded from this analysis.
Download this image Figure 3: Estimated population of UK, EU and non-EU born residents by housing tenure in England, 2001, 2011 and 2016
.png (14.4 kB) .xls (12.8 kB)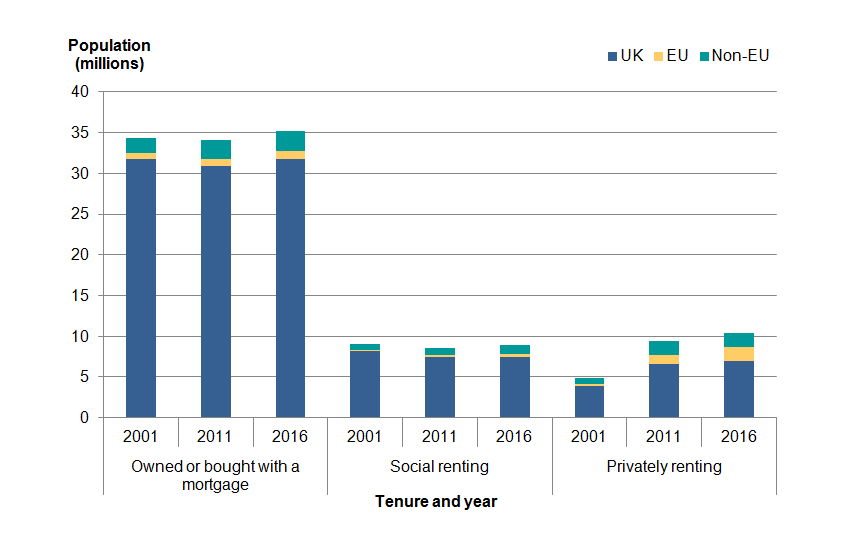
Over time, Figure 3 shows that:
- the number of UK born residents who live in accommodation that they own has remained relatively unchanged since 2001 at just over 30 million, while the number of EU and non-EU born residents who own their own home has increased
- the number of residents privately renting has increased since 2001 for all country of birth groups
- in all time periods, UK born and non-EU born residents are more likely to live in accommodation that they own rather than rent; however, compared to 2001, EU born residents are now much more likely to live in privately rented accommodation
- the number of UK born residents living in social housing has decreased slightly since 2001, while the number of residents born outside the UK living in social housing has increased for both EU and non-EU born
It should also be noted that changes in tenure over time are also influenced by length of stay in the UK (as shown in analysis by year of arrival) and age, as older residents are generally more likely to own their homes than younger residents.
The English Housing Survey (EHS) provides further evidence of these patterns. It shows that the size of the privately rented sector, in terms of number of households, more than doubled between 2001 and the year ending March 2016, from 2.1 million to 4.5 million households. The privately rented sector accounted for 10% of all households in 2001, compared with 20% of households in the year ending March 20162.
Notes for: Changes in housing tenure for UK, EU and non-EU born residents
Country of birth is used in this analysis, since it enables better comparisons over time than would be achieved by focusing on nationality, which is normally recommended for analysis of international migration. It should be noted that British nationals born abroad will be included in the non-UK born categories. Similarly, UK born non-British nationals will be included in the UK born categories.
For more information please refer to the English Housing Survey 2015 to 2016: headline report and Table AT1.1 in English housing survey headline report 2015 to 2016: section 1 household tables.
6. Regional comparisons show different patterns
As with changes for England overall, there are a number of factors that influence changes in housing tenure by country of birth at the regional level. Any recent impact on housing is likely to be seen more in areas with larger recent changes in population than those areas with historically higher levels of immigration and broadly reflect where recent migrants have tended to live.
Figure 4: Estimated population of UK, EU and non-EU born residents privately renting by region in England, 2016
Source: Office for National Statistics – 2016 Annual Population Survey
Notes:
- “Privately renting” includes those renting from a landlord or letting agency, an employer or household member, friend or relative of a household member, or any other form of privately renting.
- Those where country of birth was not specified or missing and those where tenure was “squatting”, not specified, or missing have been excluded from this analysis.
Download this chart Figure 4: Estimated population of UK, EU and non-EU born residents privately renting by region in England, 2016
Image .csv .xlsFigure 4 shows the estimated number of UK, EU and non-EU born residents privately renting by region of England in 2016. While the overall numbers of people living in the privately rented sector have increased between 2011 and 2016, the proportion of UK, EU and non-EU born residents privately renting in each region of England has remained broadly similar between 2011 and 2016.
Estimates and confidence intervals for all sectors and country of birth groups for 2011 and 2016 are available in the underlying datasheets. Annual Population Survey (APS) figures are not provided for local authorities due to small sample sizes for single years of data broken down by tenure and country of birth. However, 2001 and 2011 Census data for local authorities by tenure and country of birth are available in the underlying datasheets.
Annex 1: Country of birth groupings
2001 Census
- UK born includes those born in England, Wales, Scotland, Northern Ireland, the Channel Islands and Isle of Man.
- EU born includes those born in Austria, Belgium, Denmark, Finland, France, Germany, Greece, Republic of Ireland (including “Ireland” where part was not specified), Italy, Luxembourg, Netherlands, Portugal, Spain and Sweden.
- Non-EU includes those born in all other countries.
2011 Census
- UK born includes those born in England, Wales, Scotland, Northern Ireland, Great Britain (where not specified further) and United Kingdom (where not specified further). Those born in the Channel Islands and Isle of Man are included in the non-EU category.
- EU born includes those born in Austria, Belgium, Bulgaria, Cyprus, Czech Republic, Denmark, Estonia, Finland, France, Germany, Greece, Hungary, Republic of Ireland, Italy, Latvia, Lithuania, Luxembourg, Malta, Netherlands, Poland, Portugal, Romania, Slovakia, Slovenia, Spain and Sweden.
- Non-EU includes those born in all other countries.
Annual Population Survey (APS)
- UK born includes those born in England, Wales, Scotland, Northern Ireland, the Channel Islands and Isle of Man.
- EU born includes those born in countries that were part of the EU during the reference period of the data. For 2011 and 2012, this includes Austria, Belgium, Bulgaria, Cyprus, Czech Republic, Denmark, Estonia, Finland, France, Germany, Greece, Hungary, Republic of Ireland, Italy, Latvia, Lithuania, Luxembourg, Malta, Netherlands, Poland, Portugal, Romania, Slovakia, Slovenia, Spain and Sweden. For 2013, it includes these countries plus Croatia (from July 2013 onwards) and for 2014 to 2016, it includes all the previously listed countries plus Croatia.
- Non-EU includes those born in all other countries not included in the UK or EU groupings as constituted at the reference period. Those with a missing or not specified country of birth in APS data are excluded from the above country of birth groupings but included in overall totals for each tenure where these are quoted.