1. Main points
In the year ending March 2016, the majority of small areas had increases in the median price paid for properties, and increases in housing market activity.
The median price paid for property increased in the majority of small areas in 17 of the past 20 years.
Falls in the median price paid for property were most likely in areas with the lowest house prices.
The median price paid for flats was higher in areas where flats were the most commonly sold property type.
Nôl i'r tabl cynnwys2. Things you need to know
This publication of House Price Statistics for Small Areas (HPSSAs) is accompanied by an article which provides analysis of the effects of stamp duty land tax changes in April 2016. The article uses monthly data (not normally available in the HPSSAs) to provide an initial indication of the impact of these changes, rather than the quarterly rolling year data presented in this statistical bulletin which only cover the period up to year ending March 2016.
The HPSSAs use data from the Land Registry (LR) to provide statistics on the price paid and composition of residential property transactions for properties that were sold at full market value in England and Wales.
Residential property transactions can be added to or edited in the LR price paid data retrospectively. This can cause changes to the number of sales and price statistics reported in the HPSSAs. For this reason, the entire series of data in the HPSSAs (back to year ending December 1995) is revised quarterly and these data supersede all previously published HPSSA data.
The smallest areas for which statistics are presented are middle layer super output areas (MSOAs), of which there are 7,201 in England and Wales. The largest area available is England and Wales overall. Statistics for MSOAs provide a more detailed geographic understanding of housing trends. It can be useful to view them in the context of the larger areas in which they sit, such as local authorities, regions and the country as a whole. More information about these statistics and their uses can be found in House Price Statistics for Small Areas Explained.
HPSSAs provide a different set of statistics to the new UK House Price Index (UK HPI). The UK HPI is a monthly publication which presents mix-adjusted average (geometric mean) house prices and house price indices for the UK, its constituent countries, the regions of England and local authority districts. The index is calculated using the LR Price Paid Data. The HPSSAs and the UK HPI follow similar trends, but the UK HPI is weighted to reflect the actual mix of properties sold in the previous year whereas the HPSSAs are not, as they refer to the actual price paid. Both the UK HPI and these HPSSAs include statistics showing average house prices for England and Wales, English regions and local authority districts, but the figures are not the same because of the different methods used to produce them.
The UK HPI is designed to reflect overall housing market values from the national to local authority level, while the HPSSAs report the non-adjusted average transactional values down to the small area level, and are therefore particularly useful when identifying the change in price for properties actually sold in a given period and area.
Nôl i'r tabl cynnwys3. Rising house prices in the majority of small areas
Map 1 shows the median price paid for middle layer super output areas (MSOAs) in England and Wales in year ending March 2016. The median price paid ranged from £2,950,000 (within Westminster) to £30,000 (within County Durham).
Map 1: Median price paid for all dwellings by MSOA
England and Wales, year ending March 2016

Notes:
- MSOA = middle layer super output area
Download this image Map 1: Median price paid for all dwellings by MSOA
.png (357.3 kB)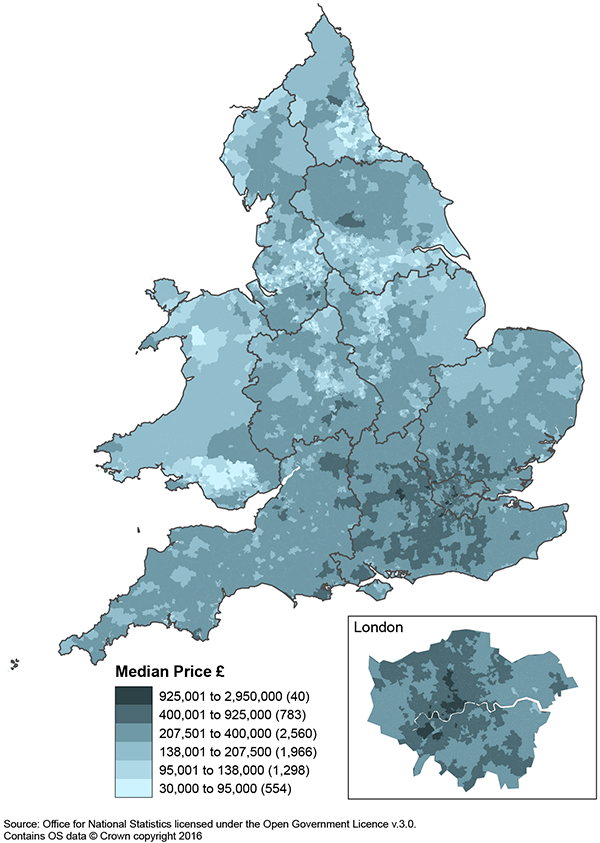
Compared with the same period last year, 78% of MSOAs in England and Wales had an increase in median price paid for residential property in the year ending March 2016. This is a smaller proportion of MSOAs than in the previous year (year ending March 2015) when 82% of MSOAs had increases in property prices.
Figure 1 shows the median price paid for property increased in the majority of small areas in 17 of the past 20 years. In 2003, the percentage of MSOAs in which property prices increased peaked at 96%, and reached its lowest level of 21% in year ending March 2009. This highlights the impact of the economic downturn on the housing market at this time.
Figure 1: Percentage of MSOAs in which property prices increased since the previous year
Year ending March 1997 to year ending March 2016, England and Wales
Source: Office for National Statistics, Land Registry
Notes:
- MSOA = middle layer super output area
Download this chart Figure 1: Percentage of MSOAs in which property prices increased since the previous year
Image .csv .xlsFigure 2 shows the percentage of MSOAs in England and Wales in which housing market activity increased compared with the previous year. The majority of MSOAs in England and Wales (63%) had an increase in the number of property sales between year ending March 2015 and year ending March 2016. This is similar to housing market activity growth in the previous year, but is lower than the post-economic downturn peak of 90% in year ending March 2014.
In 2009, 99.4% of MSOAs had a decrease in the number of property sales on the previous year, which highlights the widespread falls in housing market activity during the economic downturn. There have been 8 years in the last 20 where the majority of MSOAs had a fall in the number of properties sold, although this has only happened once since 2009.
Figure 2: Percentage of MSOAs in which the number of property sales increased since the previous year
Year ending March 1997 to year ending March 2016, England and Wales
Source: Office for National Statistics, Land Registry
Notes:
- MSOA = middle layer super output area
Download this chart Figure 2: Percentage of MSOAs in which the number of property sales increased since the previous year
Image .csv .xlsFigure 3 shows the percentage of MSOAs in which the median price paid for property increased, in the year ending March 2016, split into price bands. The chart shows that MSOAs in which the median price paid was up to £100,000 were less likely to see a rise in median price than MSOAs in any other price band. In this price band, just under half of MSOAs had a rise in the median price paid since the previous year.
The £250,000 to £300,000 price band had the highest proportion of MSOAs with increasing median prices, at 91%. For MSOAs in which the median price paid was more than £500,000, a smaller proportion had increasing house prices (79%).
Figure 3: Percentage of MSOAs in which median property prices increased, since the previous year, by price band
Year ending March 2016, England and Wales
Source: Office for National Statistics, Land Registry
Notes:
- MSOA = middle layer super output area
- Each column relates to a range of property prices and is labelled with the upper price in its range
Download this chart Figure 3: Percentage of MSOAs in which median property prices increased, since the previous year, by price band
Image .csv .xls4. Most commonly sold property type varies by area
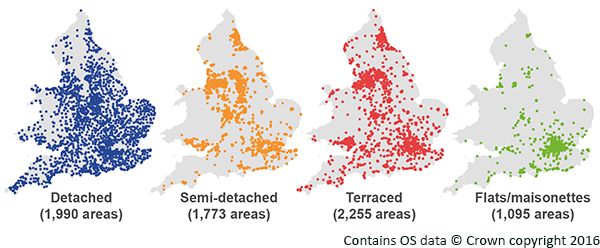
Map 2 shows the distribution of the most commonly sold property type for each of the 4 types of residential property. The map shows that middle layer super output areas (MSOAs) in which detached properties were the most commonly sold type were most widespread, whilst areas where flats were most common were generally in more urban areas. Some of the larger urban areas, like London and Manchester, contain very few MSOAs in which detached properties were the most commonly sold type.
Map 2: Most commonly sold property type by MSOA
England and Wales, year ending March 2016
Notes:
- MSOA = middle layer super output area
- MSOAs are represented by points on these maps
- Not all MSOAs had an outright most commonly sold property type and these MSOAs are not shown on the map
Download this image Map 2: Most commonly sold property type by MSOA
.png (128.8 kB)
Flats and maisonettes were the most commonly sold property in 15.2% of MSOAs in year ending March 2016. All other property types were more likely to be the most commonly sold. Unsurprisingly, flats were least likely to be the most commonly sold property type in more rural areas, particularly in Wales. However, the number of MSOAs in which flats were the most commonly sold type has increased by almost 60% (from 686 to 1,095) since 1995.
Figure 4 shows the price distribution of flats for both all MSOAs and for only those MSOAs in which flats were the most commonly sold property type. It shows that the median price paid for flats was generally higher in MSOAs where flats were the most commonly sold property type. This is likely to be a London effect, as the areas where most flats are built (and sold) are areas where prices are generally higher.
Figure 4: Percentage of MSOAs by median price paid band
Year ending March 2016, England and Wales
Source: Office for National Statistics, Land Registry
Notes:
- MSOA = middle layer super output area
- Price band labels on this chart refer to the upper limit of each band
Download this chart Figure 4: Percentage of MSOAs by median price paid band
Image .csv .xls6. New for this release
Some minor adjustments have been made to the layout of datasets in order to better adhere to the GSS geography policy. Areas for the following geographies now display in a slightly different order than previous versions of the House Price Statistics for Small Areas (HPSSA) data:
- parliamentary constituencies
- towns and cities
- regions
- countries
- local enterprise partnerships
Additionally, the datasets containing data for parliamentary constituencies are now presented with information on which region or Wales each constituency falls within, for context.
Nôl i'r tabl cynnwys7. Quality and methodology
The Quality and Methodology Information document contains important information on:
- the strengths and limitations of the data
- the quality of the output: including the accuracy of the data, how it compares with related data
- uses and users
- how the output was created
Details of the policy governing the release of new data are available in the UK Statistics Authority’s Code of Practice for Offical Statistics or from the Media Relations Office: media.relations@ons.gov.uk
Nôl i'r tabl cynnwys