1. Main points
The median price paid for residential property in neighbourhoods within England and Wales ranged from £24,500 (within the County Durham local authority district) to £2,920,000 (within Westminster).
The price paid for residential property in the cheapest neighbourhood of England and Wales decreased for the fifth consecutive quarter.
The gap between the highest and lowest-priced quarter of neighbourhoods has increased in England over the past 5 years but has decreased in Wales.
The median price paid for property in England is £20,000 (10%) higher than if the median were calculated without property transactions for London.
The median price paid for flats in England is £46,935 (30.7%) higher than if the median were calculated without property transactions for London.
London accounted for around 1 in every 3 sales of flats in England.
2. Things you need to know about this release
The House Price Statistics for Small Areas (HPSSAs) use data from the Land Registry (LR) to provide statistics on the price paid and composition of residential property transactions for properties that were sold in England and Wales. Properties sold at a discount to market level, such as properties sold under the Right to Buy scheme, are excluded from the data.
The entire series of data in the HPSSAs (back to year ending December 1995) is revised quarterly and these data supersede all previously published HPSSA data, to ensure that:
Residential property transactions added to or edited in the LR Price Paid Data (PPD) are included, especially in more recent periods where changes are most likely.
If a geography change is made the entire series reflects the new structure, avoiding geographic breaks in the time series.
The smallest areas for which statistics are presented are middle layer super output areas (MSOAs), of which there are 7,201 in England and Wales, each containing around 3,000 households. These are referred to as neighbourhoods in this statistical bulletin. Statistics for neighbourhoods provide a more detailed geographic understanding of housing trends.
HPSSAs provide a different set of statistics to the UK House Price Index (UK HPI). The UK HPI is weighted to reflect the mix of properties sold in the previous year, which is broadly representative of the mix of properties in the overall dwelling stock. The HPSSAs are not mix-adjusted but use rolling years to better reflect the actual mix of property sold than is possible with a shorter period. This means that the UK HPI provides a measure of the changing value of properties in the housing market whereas the HPSSAs measure the price paid for properties sold in a given period. Therefore the 2 sets of statistics provide different figures.
The HPSSAs report the non-adjusted average transactional values down to the small area level, and are therefore particularly useful when identifying the change in price for properties actually sold in a given period and area.
Nôl i'r tabl cynnwys3. House price gap continues to grow
House price statistics for large geographic areas don’t necessarily describe the amount of variation between smaller neighbourhoods within England and Wales. Over the last 5 years the cheapest neighbourhoods have become cheaper whilst the most expensive neighbourhoods have become more expensive. For example in year ending September 2011 the most expensive neighbourhood in England and Wales was in Westminster with a median price paid of £1,650,000. Since then, the median price paid in this neighbourhood has increased 77% to £2,920,000 in the year ending September 2016.
The current neighbourhood (middle layer super output areas) with the lowest median price paid for residential property in England and Wales was priced £24,500. This area covers the village of Horden, near Peterlee, within the County Durham local authority district. Horden is a former mining village, but since the colliery closed (in 1987) has had property sales of predominantly terraced housing for relatively low prices.
Five years ago, the neighbourhood with the lowest median price paid in England and Wales was an area in Burnley, at £42,000. The median price paid in this neighbourhood has fallen by more than 16% over the last 5 years, to £35,000. This, combined with the increases in the most expensive areas, tells us that the house price gap has been growing in recent years.
These small area figures show the wide house price variation across England and Wales, but are focussed on areas of extremely high or extremely low property prices, which are relatively unusual. One way of looking at the changing house price gap for neighbourhoods in which house prices are less extreme is to calculate the gap between the most expensive quarter of neighbourhoods and the least expensive quarter of neighbourhoods. This gap describes the range within which the average price paid in half of all neighbourhoods fits, known as the interquartile range.
The house price gap for all neighbourhoods across England and Wales has widened by £60,000 since 2011. Figure 1 shows the neighbourhood house price gap on a regional basis for England and for Wales. The neighbourhood house price gap in year ending September 2016 was largest in London (£210,500) and smallest in Wales (£55,019). This has changed since 2011 when 2 English regions (North East and East Midlands) had a narrower price gap than Wales. The price gap increased in all English regions between 2011 and 2016, but reduced in Wales by £1,919.
Figure 1: Interquartile range of median price paid for all properties across neighbourhoods
English regions and Wales, year ending Sept 2011 and year ending Sept 2016
Source: Office for National Statistics and Land Registry
Notes:
- Figure 1 shows variation in median price paid for residential property by English region and Wales. Each bar represents the difference between the top and bottom of the middle priced 50% of middle layer super output areas, referred to as neighbourhoods.
Download this chart Figure 1: Interquartile range of median price paid for all properties across neighbourhoods
Image .csv .xls4. Median house price in England 10% lower if property sales for London are excluded
London accounts for around 12% of all property sales in England, and the median price paid for all properties would be £20,000 lower if sales in London were excluded from the calculation.
Figure 2 shows that over the past 2 decades the median price paid for residential property would have been lower if calculated excluding transactions in London. Overall, the impact of property sales in London on the median price paid calculated for England is around 10%. This trend also largely persisted during the economic downturn in 2008.
Figure 2: Median property price paid calculated with and without London transactions
England, year ending Sept 1996 to year ending Sept 2016
Source: Office for National Statistics and Land Registry
Download this chart Figure 2: Median property price paid calculated with and without London transactions
Image .csv .xlsFigure 3 shows that many of the most expensive 10% of neighbourhoods are clustered in and around London. However, when transactions for London are excluded from the analysis, the most expensive 10% of the remaining neighbourhoods are spread out over a much wider area.
When excluding property sales in London, some of the most expensive 10% of neighbourhoods fall within all English regions and in Wales. However, many of the highest priced areas are still clustered around London, showing that even when removing the direct effect of London property sales, the capital still provides a geographical focal point for areas with the highest house prices.
Figure 3: Most expensive 10% of neighbourhoods for median price paid, with and without London
England and Wales, year ending Sept 2016
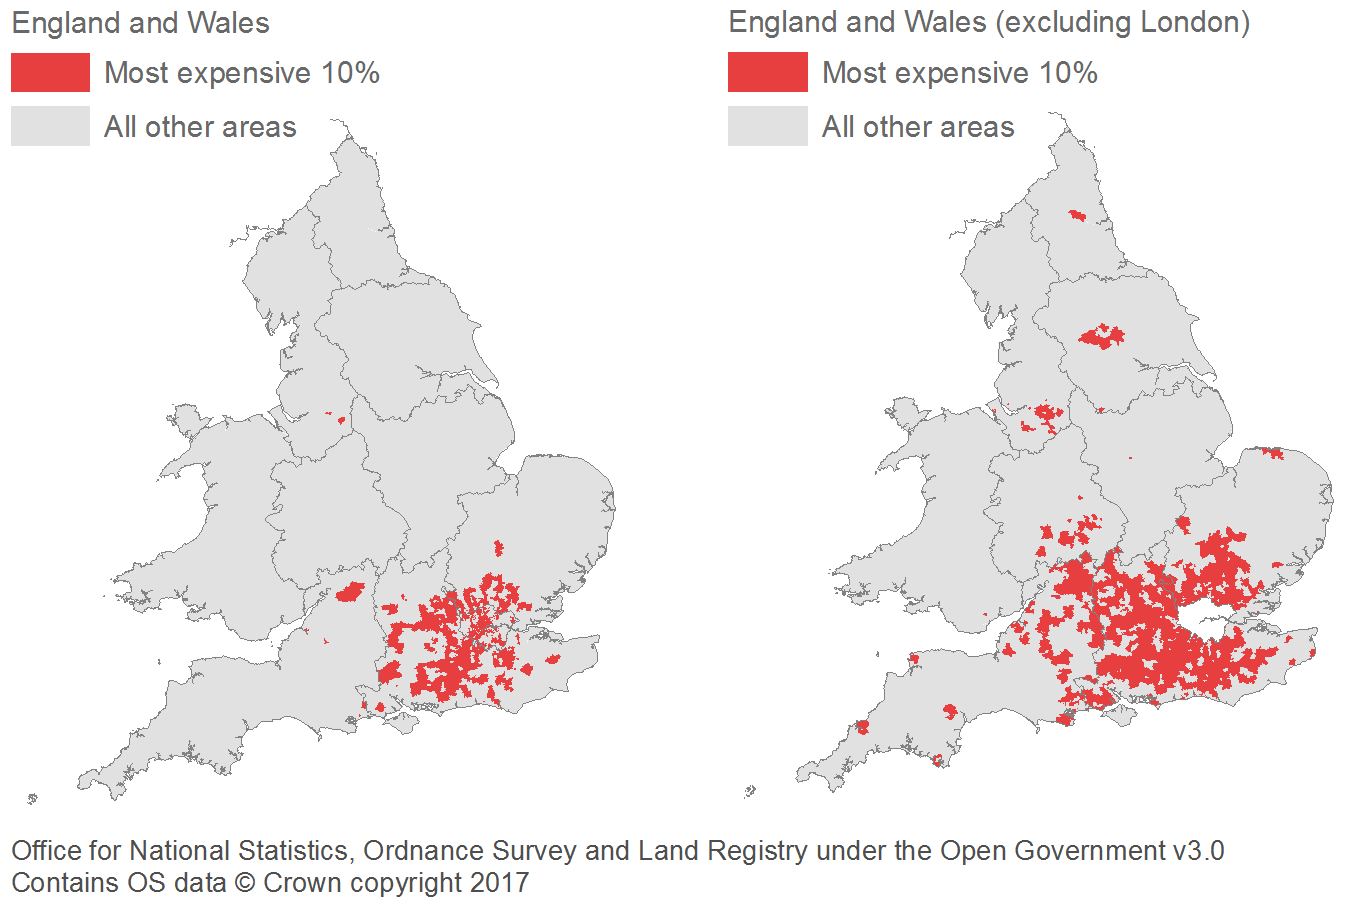
Source: Office for National Statistics, Ordnance Survey and Land Registry under the Open Government Licence v3.0. Contains OS data © Crown copyright 2017
Notes:
- The term neighbourhoods refers to middle layer super output areas.
Download this image Figure 3: Most expensive 10% of neighbourhoods for median price paid, with and without London
.png (59.4 kB)
In the year ending September 2016 the median price paid for flats and maisonettes in England was 23.5% higher than it would be if calculated without the transactions in London.
Figure 4 shows that since 1995, the effect of London property transactions on the median price paid calculated for flats in England has fluctuated between 15.4% and 36.7%, but has remained consistently higher than the London effect of all other property types. In year ending September 2016 the median price paid for flats was £46,935 (23.5%) higher than if it were calculated without property transactions for London.
London accounts for around 1 in every 3 sales of flats in England which helps to explain why the effect of London property sales on the national median price paid is greater for flats than for any other property type. London accounts for 1 in every 50 sales of detached properties and therefore London has a smaller impact on the overall value calculated for the median price paid for detached properties in England overall (1.1%).
Figure 4: Percentage difference between median price paid for property sales in England and median price paid for property sales in England without London
Year ending Dec 1995 to Sept 2016
Source: Office for National Statistics and Land Registry
Download this chart Figure 4: Percentage difference between median price paid for property sales in England and median price paid for property sales in England without London
Image .csv .xls6. What’s changed in this release
This release adds new data, on an experimental basis, to cover the year ending September 2016 and updated figures for the whole time series.
New geographies have been added following demand from users of our data, as follows:
electoral wards (December 2015)
7. Quality and methodology
The House Price Statistics for Small Areas Quality and Methodology Information document contains important information on:
the strengths and limitations of the data and how it compares with related data
users and uses of the data
how the output was created
the quality of the output including the accuracy of the data
Details of the policy governing the release of new data are available in the UK Statistics Authority’s Code of Practice for Offical Statistics or from the Media Relations Office: media.relations@ons.gov.uk.
Nôl i'r tabl cynnwys