1. Main points
The difference in median price between the most and least expensive parts of England and Wales was nearly £3.2 million in year ending September 2015, down from a peak of £3.5 million in year ending December 2014.
The most expensive area outside of London was in Elmbridge, Surrey where the median price paid for all properties was £997,475.
House price growth has diverged for the most expensive and least expensive areas since the recession.
Detached properties in England and Wales were the most commonly sold type of newly built property in year ending September 2015 (32% of all new property sales), having overtaken sales of new flats in year ending June 2015.
Nôl i'r tabl cynnwys2. Gap between lowest and highest house prices falls
The difference in median price between the most and least expensive parts of England and Wales was nearly £3.2 million in year ending September 2015, down from a peak of £3.5 million in year ending December 2014. For all types of property, the median price paid ranged from £38,750 in one part of Pendle, Lancashire to £3,212,500 in one area of Westminster.
The median price paid for property in the most expensive middle layer super output areas (MSOAs) has also fallen, from a peak of £3.5 million in the year ending December 2014. This coincided with the introduction of new stamp duty rules where tax on the most expensive properties increased.
Part of the difference in price paid between the least and the most expensive areas is caused by different types of dwelling being sold in those areas. For example, detached properties in England and Wales sold for 61% more than semi-detached properties on average in the year ending September 2015. Therefore, an area with a higher proportion of detached property sales is likely to have a higher median price overall than an area which had a higher proportion of semi-detached property sales.
Map 1 shows that in the year ending September 2015 there were 581 MSOAs in which the median house price was in the lowest 10% of property prices in England and Wales overall. Generally, towns and cities in the north of England, the Midlands and also in south Wales contained most of these 581 MSOAs.
There were 27 MSOAs in which the median price paid for all properties was more than £1 million in year ending September 2015. All these areas are in London and are predominantly in the central and western boroughs. The most expensive area outside of London was in Elmbridge, Surrey where the median price paid for all properties was £997,475.
Map 1: Median house price for all dwellings by MSOA, England and Wales
Year ending September 2015

Source: Office for National Statistics licensed under the Open Government Licence v.3.0. Contains OS data © Crown copyright 2016
Notes:
- Note: MSOA = Middle layer super output area
Download this image Map 1: Median house price for all dwellings by MSOA, England and Wales
.png (455.3 kB)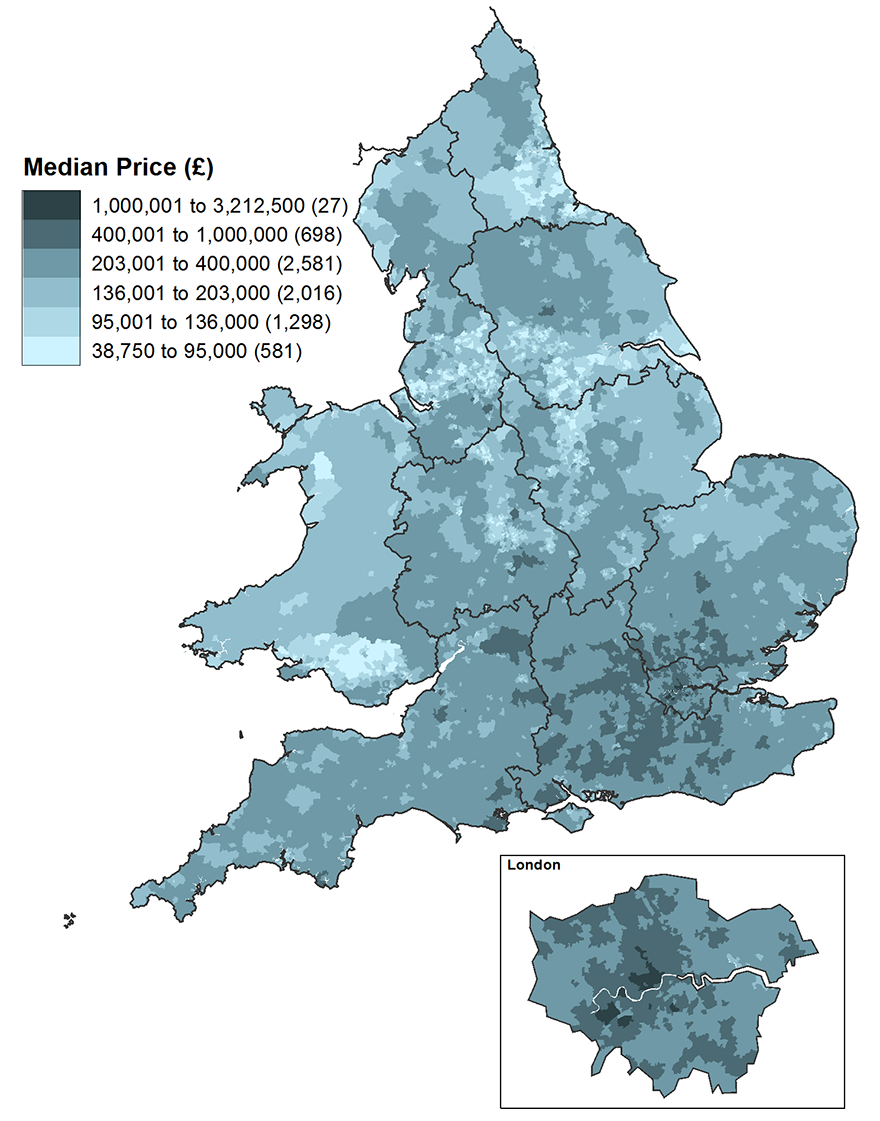
3. Long-term growth for most expensive areas
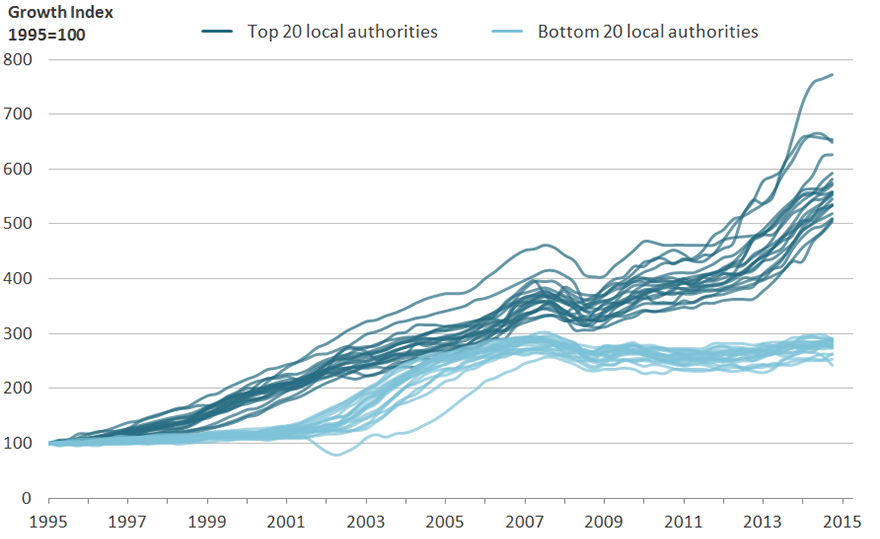
Figure 1 shows the growth in median house prices for local authorities as an index between 1995 and year ending September 2015. It shows the 20 local authorities for which the median price paid for all properties has grown the most and the 20 in which it has grown the least over the last 20 years.
The local authorities with the most growth in house prices and those with the least growth form 2 distinct clusters. Those with most growth grew at a sharper rate whereas those with the lowest growth remained relatively stable until 2001. The 2 clusters began to converge until 2007 but have diverged again since then, as the group of 20 local authorities with the least growth dropped slightly and then stayed relatively flat whilst the highest price growth areas have increased rapidly over the last 8 years.
Figure 1: Median house price growth, local authorities in England and Wales
Year ending December 1995 to year ending September 2015
Source: Office for National Statistics and Land Registry
Notes:
- Excludes Isles of Scilly
Download this image Figure 1: Median house price growth, local authorities in England and Wales
.png (159.4 kB) .xls (355.8 kB)
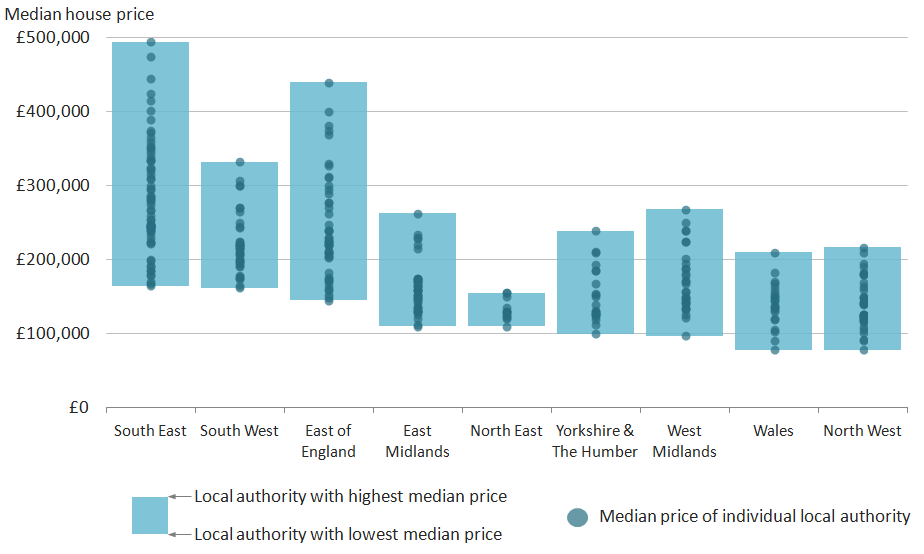
Figure 2 shows the range of median house prices for all dwelling types by English region (excluding London) and Wales in year ending September 2015. The median price paid for all dwellings for each local authority are displayed as points on each bar. The South East, South West and the East of England all stand out as having higher median prices for the lowest priced local authorities than the lowest priced local authorities in Wales and the other English regions. Despite large regional differences in the range of median prices, most regions and Wales had some degree of overlap.
The South East and the East of England had the widest ranges in local authority house prices. Both regions border London and most of the local authorities which had high median prices either border or have good transport links with London. In the South East for example the 3 local authorities in which the median price paid for all properties was highest were Elmbridge (£495,000), South Bucks (£475,000) and Chiltern (£445,750), all of which are immediately outside of London.
The 3 local authorities in the South East for which the median price paid for all properties was lowest are on the south coast of England, further from London than the most expensive part of the region. These were Gosport (£164,973), Hastings (£167,500) and Portsmouth (£170,000). There was a similar geographic pattern in the East of England.
The region with the smallest range of median prices in year ending September 2015 was the North East, ranging between £110,000 (County Durham) and £155,000 (North Tyneside).
Figure 2: Range of median house price in local authorities for English regions and Wales
Year ending September 2015
Source: Office for National Statistics and Land Registry
Notes:
- Excludes London
Download this image Figure 2: Range of median house price in local authorities for English regions and Wales
.png (35.8 kB) .xls (252.4 kB)
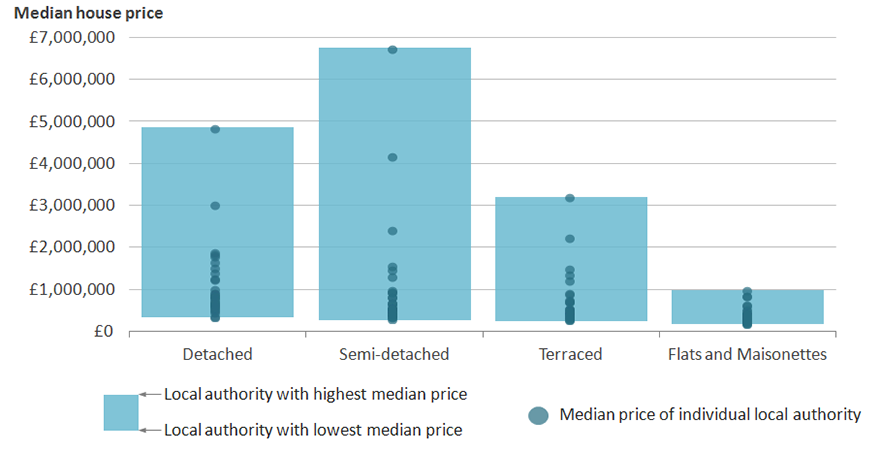
Figure 3 shows the range of median house prices for different property types in London boroughs. Semi-detached properties had the largest range in median price within London and this is caused by a small number of outliers (Kensington and Chelsea, Westminster, Camden) which all had a particularly high median price for semi-detached properties. The range of median prices for detached and terraced properties was also affected to some extent by high prices in these few boroughs. If we ignore these outliers at the top, the ranges would be more similar, although the range of median prices for flats would still be the smallest.
Figure 3: Range of all median prices in London, by dwelling type and London borough
Year ending September 2015
Source: Office for National Statistics and Land Registry
Download this image Figure 3: Range of all median prices in London, by dwelling type and London borough
.png (68.9 kB) .xls (212.5 kB)
4. Detached properties now most common new-build
Detached properties in England and Wales were the most commonly sold type of newly built property in year ending September 2015 (32% of all new property sales), having overtaken sales of new flats in year ending June 2015.
Figure 4 shows the changes in composition for sales for new properties over time. In year ending December 1995, sales of detached housing dominated the new build market with 44% of all sales for new properties. By 2000, the share of sales for new detached housing peaked at 52% but declined until 2008. Since then the share of sales for new detached property has been increasing steadily. The share of sales for new semi-detached properties has also been rising since 2008, albeit at a slower rate than the share of new detached properties.
The percentage of new terraced housing exceeded that of semi-detached in 2001 and remained higher until 2014. For newly built flats, the share rose rapidly between 2000 and 2008, during which time many urban areas were regenerated. Since then the share of newly built flats has fallen steadily.
Figure 4: Proportion of property sales of newly built dwellings by type, England and Wales
Year ending December 1995 to year ending September 2015
Source: Office for National Statistics and Land Registry
Download this chart Figure 4: Proportion of property sales of newly built dwellings by type, England and Wales
Image .csv .xls5. New for this release
This release includes House Price Statistics for Small Areas data up to the year ending September 2015. For this release, we have produced house price statistics for a new geography, major towns and cities in England and Wales, along with analysis of house prices in major towns and cities.
We have also published an article which examines house price and the composition of property sales in rural and urban areas in England and Wales.
Nôl i'r tabl cynnwys6. Things you need to know
House Price Statistics for Small Areas (HPSSAs) use data from the Land Registry to provide statistics on the price paid and composition of residential property transactions which were sold at full market value in England and Wales.
Residential property transactions can be added to or edited in the Land Registry’s Price Paid data retrospectively. This can cause changes to the number of sales and price statistics reported in the HPSSAs. For this reason, the entire series of data in the HPSSAs (back to year ending December 1995) is revised quarterly and these data superseded all previously published HPSSA data.
The smallest areas for which statistics are presented are middle layer super output areas (MSOAs), of which there are 7,201 in England and Wales. The largest area available is England and Wales overall. Statistics for the smallest areas provide a more detailed geographic understanding of housing trends. It can be useful to view them in the context of the larger areas in which they sit, such as local authorities, regions and the country as a whole. More information about these statistics and their uses can be found in our HPSSAs Explained.
These house price statistics provide an accurate representation of the price paid for residential properties sold in a given area. They are useful for assessing the affordability of housing for a range of geographical areas as well as examining broad patterns in prices and the number of house sales over time. They provide a level of spatial detail not included in the ONS House Price Index (HPI) which reports house prices at regional and national level. HPSSAs are different to statistics included in the HPI and the two are not directly comparable. The HPI provides an economic measure of inflation over time, representative of the changing mean value of the housing stock, taking into account the mix of different houses. This provides an appropriate measure for inflation in property value as it is mix-adjusted to account for differences in the characteristics of houses in an area. HPSSAs focus on the price paid for residential properties that were actually sold in a particular period. They are not mix adjusted, which means variations in the composition of dwelling types sold can influence the house prices reported here. These variations help inform understanding of spatial differences in sold house prices.
For more information about the quality and methods used to produce these statistics, see our Quality and Methodology Information document.
Nôl i'r tabl cynnwys