Cynnwys
- Main points
- Things you need to know about this release
- Gap widens between top and bottom ends of the market
- House prices increased in the majority of neighbourhoods in 18 of the past 21 years
- Neighbourhood within Tower Hamlets in London had largest rise in value of property transactions
- Links to related statistics
- What’s changed in this release
- Quality and methodology
1. Main points
The median price paid for residential properties in neighbourhoods (MSOAs) within England and Wales ranged from £23,375 (within County Durham) to £2,700,000 (within Westminster).
In 2016, the median price paid for property increased in 78% of neighbourhoods in England and Wales, a small reduction compared with 2015.
Neighbourhoods in London and the South East accounted for 45% of the total value of residential property transactions in England and Wales overall in 2016.
The nominal total value of residential property transactions in England and Wales for 2016 was at the highest level since the pre-recession peak in 2007.
2. Things you need to know about this release
The House Price Statistics for Small Areas (HPSSAs) use data from the Land Registry (LR) to provide statistics on the price paid and composition of residential property transactions for properties that were sold in England and Wales. Properties sold at a discount to market level, such as properties sold under the Right to Buy scheme, are excluded from the data.
The entire series of data in the HPSSAs (back to year ending December 1995) is revised quarterly and these data supersede all previously published HPSSA data, to ensure that:
Residential property transactions added to or edited in the LR Price Paid Data (PPD) are included, especially in more recent periods to which changes are more likely to relate.
If a geography change is made the entire series reflects the new structure, avoiding geographic breaks in the time series.
The smallest areas for which statistics are presented are middle layer super output areas (MSOAs), of which there are 7,201 in England and Wales, each containing around 3,000 households. These are referred to as neighbourhoods in this statistical bulletin. Statistics for neighbourhoods therefore provide a detailed geographic understanding of housing trends.
HPSSAs provide a different set of statistics to the UK House Price Index (UK HPI). The UK HPI is weighted to reflect the mix of properties sold in the previous year, which is broadly representative of the mix of properties in the overall dwelling stock. The HPSSAs are not mix-adjusted but use rolling years to better reflect the actual mix of property sold than is possible with a shorter period. This means that the UK HPI provides a measure of the changing value of properties in the housing market, whereas the HPSSAs measure the price paid for properties sold in a given period. Therefore the two sets of statistics provide different figures.
The HPSSAs report the non-adjusted average transactional values down to the small area level and are therefore particularly useful when identifying the change in price for properties actually sold in a given period and area.
Nôl i'r tabl cynnwys3. Gap widens between top and bottom ends of the market
The median price paid in neighbourhoods (middle layer super output areas) ranged from £2,700,000 (within Westminster) to £23,375 (within County Durham). Figure 1 shows the median price paid for middle layer super output areas (MSOAs) in England and Wales in year ending December 2016.
Figure 1: Median price paid for all dwellings by middle layer super output areas (MSOA)
England and Wales, year ending December 2016
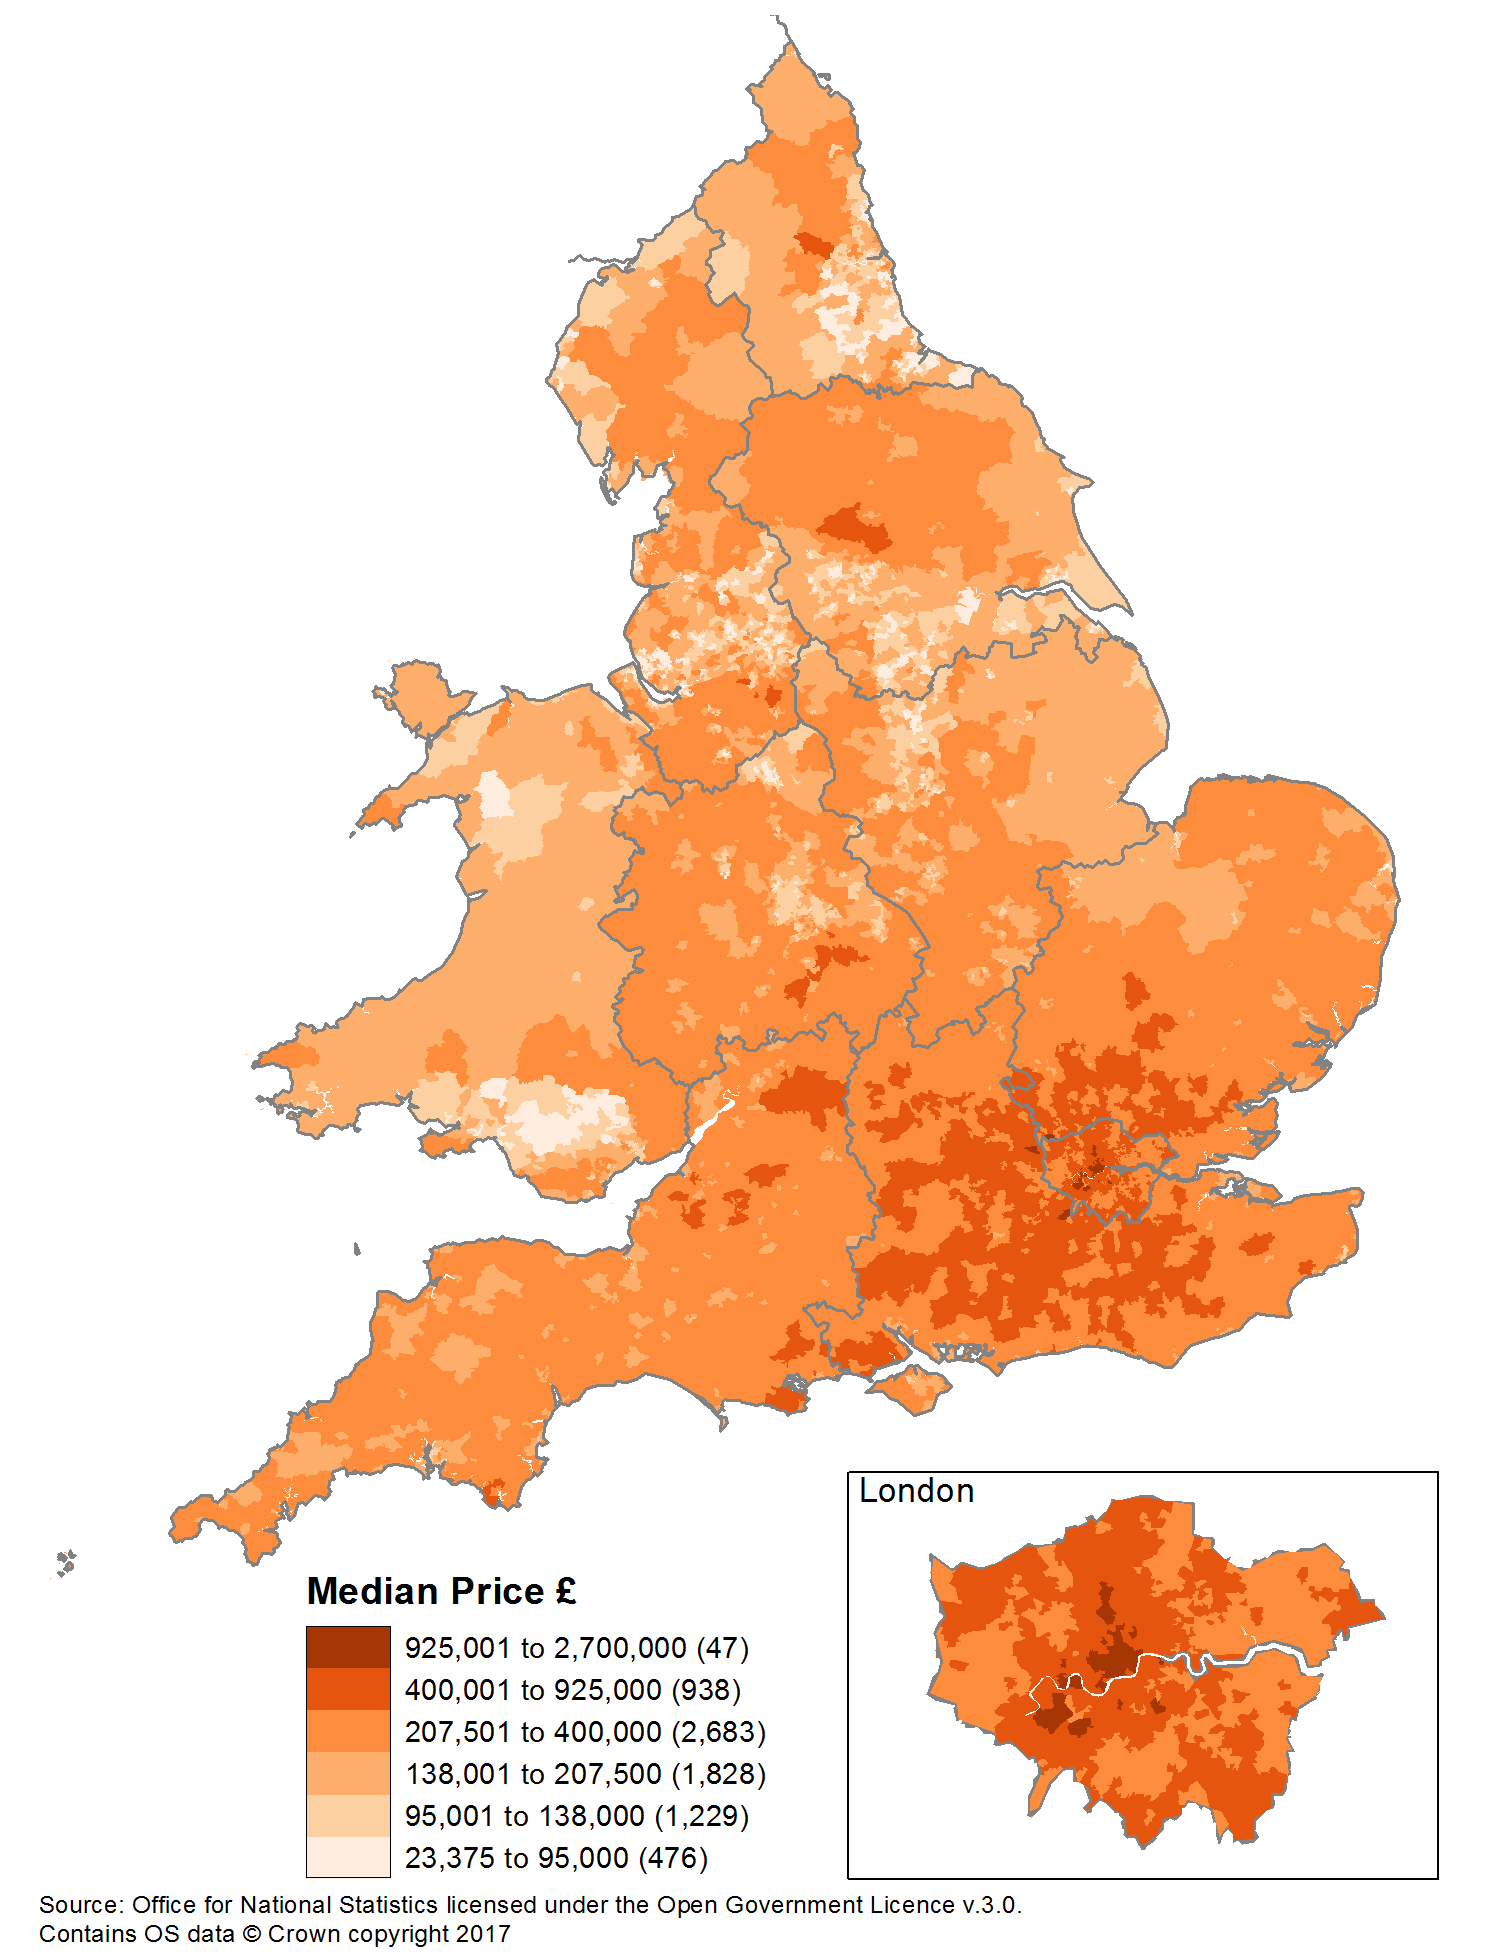
Source: Office for National Statistics, Ordnance Survey and Land Registry under the Open Government Licence v3.0. Contains OS data © Crown copyright 2017
Download this image Figure 1: Median price paid for all dwellings by middle layer super output areas (MSOA)
.png (148.7 kB) .png (148.7 kB)
Figure 2 shows the median property price paid in the 10th and 90th percentile of neighbourhoods for each year. The aim here is to illustrate the range of values between neighbourhoods with relatively low prices (as shown by the 10th percentile) and those with relatively high prices (as shown by the 90th percentile). The 10th percentile has stayed relatively stable, at around £100,000, since 2006, with minor changes over the last ten years. The 90th percentile has increased from £310,000 to £450,000 in the last 5 years.
Figure 2: Median property price paid in the 10th and 90th percentile of neighbourhoods
England and Wales, year ending Dec 1995 to year ending Dec 2016
Source: Office for National Statistics and Land Registry
Download this chart Figure 2: Median property price paid in the 10th and 90th percentile of neighbourhoods
Image .csv .xlsThe ratio between the 10th and 90th percentiles for price paid is shown in Figure 3. The chart shows that the ratio has been steadily increasing over the last decade, having fallen rapidly from its peak in 2002.
Figure 3: Ratio of median price paid for the 90th to the 10th percentile of neighbourhoods
England and Wales, year ending Dec 1995 to year ending Dec 2016
Source: Office for National Statistics and Land Registry
Download this chart Figure 3: Ratio of median price paid for the 90th to the 10th percentile of neighbourhoods
Image .csv .xls4. House prices increased in the majority of neighbourhoods in 18 of the past 21 years
Figure 4 shows that the median price paid for property increased in the majority of neighbourhoods (middle layer super output areas) in 18 of the past 21 years. The percentage of neighbourhoods in which property prices increased peaked at 96% in 2003 and reached a low of 19% in year ending December 2009. This highlights the impact of the economic downturn on the housing market at this time. However, over the last 3 years the percentage of neighbourhoods with rising prices has decreased marginally, from 81% in 2014 to 78% in 2016.
Figure 4: Percentage of neighbourhoods in which median property price paid increased and decreased since the previous year
England and Wales, year ending Dec 1996 to year ending Dec 2016
Source: Office for National Statistics and Land Registry
Download this chart Figure 4: Percentage of neighbourhoods in which median property price paid increased and decreased since the previous year
Image .csv .xlsWhen we look at housing market activity (the number of property sales) across neighbourhoods in England and Wales, a different pattern emerges. Figure 5 shows the percentage of neighbourhoods in which the number of property sales increased compared with the previous year. In 2016, 44% of neighbourhoods had an increase in the number of property sales compared with 2015. This is similar to housing market activity growth in the previous year, but is lower than the post-recession peak of 81% in 2013.
Figure 5: Percentage of neighbourhoods in which number of property sales increased and decreased since the previous year
England and Wales, year ending Dec 1996 to year ending Dec 2016
Source: Office for National Statistics and Land Registry
Download this chart Figure 5: Percentage of neighbourhoods in which number of property sales increased and decreased since the previous year
Image .csv .xls5. Neighbourhood within Tower Hamlets in London had largest rise in value of property transactions
Housing market value (HMV) is the total value of residential property transactions for an area. It is driven by a combination of property prices and the number of property transactions. This can be used to provide an overview of the scale of the property transaction economy. These housing market value statistics are presented in nominal terms, which means that they have not been adjusted to take account of inflation over time, and so they present the simple total transactional value of all property sales.
In 2016, the neighbourhood (middle layer super output area) with the highest HMV was within Tower Hamlets, with a total of £563 million. This was almost four times the 2015 value of £150 million. In the same period, the median price paid in this neighbourhood increased by £48,000 to £488,763, while the number of property sales increased from 312 in 2015 to 1,086 in 2016. Of these, 890 were new flats. This area of Tower Hamlets covers the north bank of the River Thames from Blackwall to East India Docks, opposite the O2 Arena and has had a large amount of development in the last 5 years.
The neighbourhood with the lowest HMV in 2016 is within Birmingham, with a total of £984,000. This represents less than 0.2% of the value of the highest value neighbourhood, within Tower Hamlets.
The median price paid for the neighbourhood within Tower Hamlets in 2016 was £488,763, while it was £110,000 within the Birmingham neighbourhood. Despite this large difference, it is the housing market activity that had the larger impact on the two neighbourhoods’ HMV. In the neighbourhood in Birmingham there were nine house sales in 2016, compared with 1,086 house sales in the neighbourhood in Tower Hamlets.
HMV statistics for small areas show the wide variation in housing market value across England and Wales. If we use the interquartile range, the gap between the highest quarter of housing market value of neighbourhoods and the lowest quarter, this describes the range of the housing market value in half of all neighbourhoods and so minimises the effects of the highest and lowest outliers. This value can be described as the housing market value (HMV) gap.
The HMV gap for England and Wales has widened by more than £11 million since 2011. Figure 6 shows the neighbourhood HMV gap on a regional basis for England and for Wales. The HMV gap was largest for neighbourhoods within London, which means that neighbourhoods in London have more varied housing market value than neighbourhoods within the other English regions and in Wales. This most likely reflects the diverse property market in London, both in terms of price paid and in terms of housing market activity levels.
Figure 6: Interquartile range of housing market value for all properties across neighbourhoods
English regions and Wales, 2011 and 2016
Source: Office for National Statistics and Land Registry
Notes:
- Each bar represents the difference between the top and bottom of the middle valued 50% of middle layer super output areas (referred to as neighbourhoods).
Download this chart Figure 6: Interquartile range of housing market value for all properties across neighbourhoods
Image .csv .xlsFigure 7 shows that London had the highest share of total housing market value of all English regions and Wales in 2016, but that it did not have the largest share of all property sales, which was in the largest region, the South East. This illustrates that the price paid for properties in London contributed proportionately more to housing market value than the level of housing market activity.
In the North West, the price paid for property contributed to housing market value to a lesser extent than anywhere else. Here, the number of property sales comprised 12% of all property sales in England and Wales, while the housing market value of the North West comprised 8% of the total HMV.
Figure 7: Percentage of total housing market value and percentage of all property sales
English regions and Wales, 2016
Source: Office for National Statistics and Land Registry
Download this chart Figure 7: Percentage of total housing market value and percentage of all property sales
Image .csv .xlsThe total value of transactions in the housing market of England and Wales almost halved in 2008, during the recession. Its value decreased from £279 billion in 2007 to £141 billion in 2008. The housing market value for England and Wales has been steadily rising since 2011, although it is still below its 2007 peak, with the housing market value for 2016 being £254 billion. Note that these figures are in nominal terms and are not adjusted for increases in inflation over time.
The English regions and Wales have followed a similar trend of HMV to the national trend, with the exception of London. Figure 8 shows the HMV in London overtook its 2007 figure in 2014, with a total of £62.2 billion. Unlike the other regions and the national trend, London’s housing market value has fallen since its 2014 peak and in 2016 was almost £59.1 billion.
Figure 8: Indices of total value of property transactions
London, England and Wales, 1995 to 2016
Source: Office for National Statistics and Land Registry
Download this chart Figure 8: Indices of total value of property transactions
Image .csv .xlsFigure 9 shows the number of sales as indices based on 2007. Sales pre-2008 remained consistent, not really affecting the increase in HMV. The recession of 2008 caused a similar drop in sales as happened with the HMV, both indices dropping to around 51%. The post recession recovery in HMV has been driven by rising prices rather than number of sales, as the sales index has not risen as high as the HMV. The fall in the HMV for London since 2014 can be attributed to a fall in sales, which in the same period fell from 118,433 to 100,877 in 2016.
Figure 9: Indices of number of property transactions
London, England and Wales, 1995 to 2016
Source: Office for National Statistics and Land Registry
Download this chart Figure 9: Indices of number of property transactions
Image .csv .xls7. What’s changed in this release
In the March 2017 release of House Price Statistics for Small Areas (HPSSAs), we published statistics for four new geographies (electoral wards, NUTS3, combined authorities and counties). We kept these datasets separate from the “regular” datasets containing the existing geographies, such as middle layer super output areas (MSOAs) and local authority districts. In this release we have incorporated the data for the four new geographies into the regular datasets.
Due to the increase in the number of sub-national geographies available in the HPSSAs, datasets numbered 6 to 20 in previous publications have been split into two types of geography: administrative geographies and other sub-national geographies.
The geographies included in the administrative datasets are:
- England and Wales
- countries
- regions
- local authorities and unitary authorities
- counties and unitary authorities
- combined authorities
MSOA level data will continue to be published in datasets 1 to 5.
The administrative datasets will be numbered 6 to 20.
The geographies included in the sub-national datasets are:
- rural-urban classification
- Parliamentary constituency
- census travel to work area
- local enterprise partnership
- towns and cities
- NUTS3
The sub-national datasets will be numbered 21 to 35.
Ward geography data will be released in its own datasets, numbered 36 to 40.
Nôl i'r tabl cynnwys8. Quality and methodology
The House Price Statistics for Small Areas Quality and Methodology Information document contains important information on:
- the strengths and limitations of the data and how it compares with related data
- users and uses of the data
- how the output was created
- the quality of the output including the accuracy of the data
Details of the policy governing the release of new data are available in the UK Statistics Authority’s Code of Practice for Offical Statistics or from the Media Relations Office via email to media.relations@ons.gov.uk.
Nôl i'r tabl cynnwys