1. Disclaimer
We are producing these Research Outputs to provide the tenure breakdown of dwellings within the private sector at the subnational level, which are currently only available at the country level. However, these Research Outputs are not official statistics and must not be reproduced without this disclaimer. Research Outputs are produced to provide information about new methods and data sources being investigated. There are official statistics available on dwelling stock by tenure for local authorities, which you should refer to if you require official statistics. These provide the total private sector stock for each area, but do not provide a breakdown of owner-occupied and privately-rented dwellings.
Nôl i'r tabl cynnwys2. Introduction
There are currently no published annual statistics on the dwelling stock by tenure breakdown within the private sector for subnational geographies in England. We are exploring whether it is possible to use data on tenure for subnational areas from the Annual Population Survey (APS) to provide estimates of the number and percentage of owner-occupied and privately-rented dwellings for areas in England between 2012 and 2015.
The APS is a household survey and so only covers dwellings that are occupied. Therefore it does not provide data on any vacant dwellings. However, we are aiming to provide an indication of the total number of dwellings available to be taken up by each of the tenure types, rather than just the currently occupied dwelling stock. To do this, we apply an adjustment to the survey-based estimates to take account of the vacant dwelling stock. Our estimates refer to “dwellings” rather than “households”. A dwelling is the physical unit of accommodation, whereas a household is an individual or group of people living at the same address and sharing cooking, living room or dining area facilities.
Applying vacancy rate adjustments using data from the English Housing Survey (EHS) to the owner-occupied and privately-rented stock estimates derived from APS household data can provide an estimate of the total number of dwellings within each tenure type. This includes dwellings that are vacant. When considering the breakdown of tenures within the total number of dwellings, making a vacancy rate adjustment is important because the likelihood of a dwelling being vacant varies by tenure. Privately-rented dwellings are more likely to be vacant than owner-occupied dwellings, most likely because of the higher turnover rates of the privately-rented dwelling stock. Vacancy rates across the tenures also change over time and across geographical areas.
In these Research Outputs we provide the percentages of the owner-occupied and privately-rented dwellings out of the total dwelling stock. We also provide estimates of the number of dwellings by tenure, which have been constrained to the published National Statistics on private sector stock produced by the Department for Communities and Local Government (DCLG). We have not included statistics on the number of dwellings in the social rented sector because DCLG provides these estimates in Tables 100, 115 and 116, which are calculated from data provided by local authorities and housing associations.
Nôl i'r tabl cynnwys3. Why are we producing these statistics?
Annual information about the number and percentage of owner-occupied and privately-rented dwellings in English local authorities is needed to provide evidence to help planning authorities set housing policy, and to help monitor trends and changes in the distribution and geography of tenure over time.
Annual statistics on dwelling stock by tenure and local authority district in Wales are published by the Welsh Government. These statistics provide a breakdown of owner-occupied, privately-rented and social housing stock. These estimates are not directly comparable with the estimates for England because they are not adjusted to take account of vacancy rates.
For England, dwelling stock by tenure estimates are available at the national level from the Department for Communities and Local Government (DCLG), but are not available for any subnational level. For local authorities, only information on the private sector stock as a whole is available (see Table 100: number of dwellings by tenure and district, England). Therefore, in England, the decennial census is the only data source that provides estimates of the privately-rented and owner-occupied dwelling stock by local authority.
Nôl i'r tabl cynnwys4. Feedback and next steps
We are keen to receive feedback on this Research Output and the methodology used to produce these estimates, including how they might be improved and potential uses of the data. Please email your feedback to better.info@ons.gov.uk.
Our next step is to explore the possibility of carrying out local authority level vacancy rate adjustments. To do this, using occupancy rates for smaller geographies would improve our statistics because occupancy rates for areas within a region are likely to differ.
In addition, our longer-term aim is to access and make use of administrative data about the size of the private rented sector to further improve our estimates.
Nôl i'r tabl cynnwys5. Methodology
To calculate the breakdown of owner-occupied and privately-rented dwellings, household level data were taken from the Annual Population Survey (APS), for each of the years 2012 to 2015. The APS data were filtered to only include the household reference person (HRP). This ensures that we only include one individual per household. This method requires an assumption that households sampled in the APS are equivalent to dwellings. In reality though, there are some definitional differences between households and dwellings, which means the tenure of some households may differ to the tenure of the dwellings in which they reside.
To identify the location of each household, we used the postcode variable in the APS and matched it with the most recent version of the National Statistics Postcode Lookup (NSPL). Estimates were produced for English regions, local authorities (LAs), county and unitary authorities (county and UAs) and Nomenclature of Territorial Unit 3 areas (NUTS 3).
In the APS, the variable for tenure is split into six categories. These were re-coded into a new variable to combine households classified as:
- owned outright
- being bought with mortgage or loan
- part rent, part mortgage
These were then grouped together as "owner-occupied" households. In addition, households that were categorised in the APS as privately rented, rent free or squatting were grouped into a new "rented" category. The rented category included households in both the private rented and social rented sector. We therefore needed to separate these to produce estimates of the individual types of tenure.
To identify households living in socially-rented accommodation, the APS variable "landlord of accommodation" was used. Those categorised as "LA, council or Scottish homes" or "Housing association, charitable trust or local housing company" were classed as socially renting. Those in the categories "employing organisation", "another organisation", "relative of household member", "individual employer" or "other individual private landlord" were all categorised in the private rented sector.
Cross tabulations were created between tenure and the given geography, and also renting type and the given geography to produce estimates of the number of households in owner-occupied and rented-accommodation. Within the rented category, we produced a breakdown of the number of households in private-rented and social-rented accommodation. We applied the household weighting variable from the APS when creating the cross tabulations of geography by tenure, to produce estimates that are representative of the population.
The measure so far is for households because it is based on a survey that doesn’t cover unoccupied dwellings. To convert this measure into a measure of tenure for dwellings rather than households we can apply occupancy rates from the English Housing Survey (EHS), which are provided by the Department for Communities and Local Government (DCLG). Vacancy and occupancy rates are provided by year, tenure and region. We divided the stock figure by the occupancy rate for the given year, tenure and region. This gives us an estimate of the dwelling stock by tenure.
With the dwelling stock breakdown, we then carried out some smoothing taking into consideration the previous and following year’s estimates. This helps to minimise the effects of year-on-year variation in the APS data. From our smoothed estimates, the percentage breakdown of owner-occupied and privately-rented dwellings within the private sector was calculated from the APS data, and these percentages were applied to the published estimates of private sector dwellings in DCLG Tables 100 and 109. This provides us with estimates and percentages of owner-occupied and privately-rented dwellings out of the total dwelling stock.
Worked example
1. Access full Annual Population Survey (APS) dataset for one individual year (January to December).
2. Remove all respondents from the dataset that are not the household reference person (HRP) so that remaining records are effectively households rather than individuals.
| RELHRP6 | Keep or remove |
|---|---|
| 0: Household reference person | Keep |
| 1: Respondent is not HRP | Remove |
3. Use the postcode variable to derive a variable that identifies the geographical area for each record. We do this for country, region, local authority, county and unitary authority, and NUTS 3 area.
4. Re-code the tenure variable (TEN1) to split into owner-occupied and privately-rented dwellings.
| TEN1 | New tenure variable |
|---|---|
| 1. Owned outright | 1. Owner-occupied |
| 2. Being bought with a mortgage or loan | 1: Owner-occupied |
| 3. Part rent, Part mortgage | 1: Owner-occupied |
| 4. Rented | 0: Rented |
| 5. Rent Free | 0: Rented |
| 6. Squatting | 0: Rented |
5. Recode the Landlord of accommodation (LLORD) variable to derive a variable for type of rented accommodation.
| LLORD | New rent type variable |
|---|---|
| 1. Local authority, council or Scottish Homes | 1: Social renting |
| 2. Housing association, charitable trust or local housing company | 1: Social renting |
| 3. Employing organisation | 0: Private renting |
| 4. Another organisation | 0: Private renting |
| 5. Relative of household member | 0: Private renting |
| 6. Individual employer | 0: Private renting |
| 7. Other individual private landlord | 0: Private renting |
6. Complete a cross tabulation of the relevant geography variable by the tenure variable to calculate the owner occupied and rented split from total dwellings. Apply the household weighting variable (PHHWTA17) when conducting the cross tabulation.
7. Complete a cross tabulation of the relevant geography variable by the rent type variable to calculate the socially-rented and privately-rented split from the rented sector. Apply the same household weighting variable as the previous step when conducting the cross tabulation.
8. Divide the given stock figure by the occupancy rate taken from the English Housing Survey (EHS), for the given region, tenure and year. This will provide estimates of the dwelling stock for owner-occupied, privately-rented and socially-rented dwellings.
9. Smooth estimates over the time series (0.25 multiplied by previous year plus 0.50 multiplied by given year plus 0.25 multiplied by next year)
10. Use the smoothed estimates to provide a percentage split of owner-occupied and privately-rented dwellings in the private sector.
11. Apply these percentages to the published private sector stock estimates for each area (using DCLG Tables 100 and 109), to produce the breakdown of dwellings in the owner-occupied and privately-rented sectors within the private sector overall. These are aligned with the National Statistics produced by DCLG.
12. Calculate the coefficient of variation for each estimate using the following formula:
where P equals proportion from the private sector and n equals sample size of the private sector for the given area.
13. Calculate the 95% confidence intervals around estimates. This is done using the formula P± 1.96 x Standard Error. This is calculated on the estimates of the proportion of dwellings in a given tenure out of the total number of dwellings in the private sector. The percentages for upper and lower confidence limits are then applied to the private sector stock estimates published by DCLG, to provide estimates of the upper and lower confidence limits for the number of dwellings in each type of tenure. These estimates are then applied to DCLG total stock estimates (Table 100) to provide upper and lower confidence limits and percentages out of the total dwelling stock.
An example of this in practice:
Cross-tabulation of tenure by local authority, weighted by household weight variable
| Total number of owner occupied households in Hartlepool for 2013 | 25,611 |
| Total number of rented households in Hartlepool for 2013 | 15,364 |
Cross-tabulation of rent type by local authority, weighted by household weight variable
| Total number of privately-rented households in Hartlepool for 2013 | 5,460 |
| Total number of socially-rented households in Hartlepool for 2013 | 9,904 |
Apply occupancy rates from the English Housing Survey to the estimates
| Occupancy rate for the North East in 2013 for owner occupied | 96.076% |
| Owner-occupied estimate divided by occupancy rate (25,611 divided by 96.076%) | 26,657 |
| Occupancy rate for the North East in 2013 for private renters | 90.61% |
| Privately- rented estimate divided by occupancy rate (5,460 divided by 90.61%) | 6,026 |
Smooth estimates
Owner-occupied dwellings in Hartlepool for 2013 =
| 2012 | 2013 | 2014 | Estimate for 2013 |
|---|---|---|---|
| 0.25 x 26,792 + | 0.50 x 26,657 + | 0.25 x 26,183 | = 26,572 |
Privately-rented dwellings in Hartlepool for 2013 =
| 2012 | 2013 | 2014 | Estimate for 2013 |
|---|---|---|---|
| 0.25 x 5,163 + | 0.50 x 6,026 + | 0.25 x 6,860 | = 6,019 |
Percentage breakdown within private sector
| Owner-occupied plus private-rented in Hartlepool 2013 (private sector stock) | 32,591 |
| Owner-occupied dwellings as a percentage of private sector stock | 81.53% |
| Privately-rented dwellings as a percentage of private sector stock | 18.47% |
Constrain the estimates to published private sector stock estimates
| Private sector dwelling stock in Hartlepool in 2013 (DCLG Table 100) | 32,470 |
| Multiply proportion of private sector that is owner occupied by private sector stock | 0.8153 x 32,470 = 26,473 |
| Multiply proportion of private sector that is privately rented by private sector stock | 0.1847 x 32,470 = 5,997 |
Using these stock figures, derive percentages out of total stock (published in Table 100)
| Total dwelling stock in Hartlepool in 2013 (DCLG Table 100) | 42,440 |
| Owner-occupied dwellings (26,473) as a percentage of total stock (42,440) | 62.38% |
| Privately-rented count (5,997) as a percentage from total stock (42,440) | 14.13% |
6. Sample sizes
The sample sizes for households in the Annual Population Survey (APS) varied across areas and also differed depending on how the geographies were defined. Figures 1 to 4 show the five areas for each of the geographies that had the largest and smallest average sample size over the four years, once the data had been filtered. Statistics are not reported for an area when there was an APS sample size smaller than 50 for the private sector after the data were filtered.
Figure 1: Average (mean) Annual Population Survey (APS) private sector sample size over four years
English regions, 2012 to 2015
Source: Annual Population Survey, Office for National Statistics
Download this chart Figure 1: Average (mean) Annual Population Survey (APS) private sector sample size over four years
Image .csv .xlsFigure 1 shows that for English regions, the sample size ranged from an average of 5,729 households in the East Midlands to 14,933 households in the South East.
Figure 2: Average (mean) Annual Population Survey (APS) private sector sample size over four years, for local authorities with the largest and smallest sample sizes
England, 2012 to 2015
Source: Annual Population Survey, Office for National Statistics
Download this chart Figure 2: Average (mean) Annual Population Survey (APS) private sector sample size over four years, for local authorities with the largest and smallest sample sizes
Image .csv .xlsFigure 2 shows that for local authorities, the sample sizes ranged from an average of four households in the City of London to 1,034 households on the Isle of Wight. All areas that had a smaller private sector sample size than 50 for any given year are not reported. Both the City of London and West Somerset had a smaller sample size than 50 for every year, whilst Richmondshire, Adur and North Warwickshire had two years’ worth of data, which is not reported because of small sample sizes.
Figure 3: Average (mean) Annual Population Survey (APS) private sector sample size over four years, for county and unitary authorities with the largest and smallest sample sizes
England, 2012 to 2015
Source: Annual Population Survey, Office for National Statistics
Download this chart Figure 3: Average (mean) Annual Population Survey (APS) private sector sample size over four years, for county and unitary authorities with the largest and smallest sample sizes
Image .csv .xlsFigure 3 shows that for county and unitary authorities, the sample sizes ranged from an average of 198 households in Bedford to 6,492 households in Greater Manchester.
Figure 4: Average (mean) Annual Population Survey (APS) private sector sample size over four years, for NUTS 3 areas with the largest and smallest sample sizes
England, 2012 to 2015
Source: Annual Population Survey, Office for National Statistics
Download this chart Figure 4: Average (mean) Annual Population Survey (APS) private sector sample size over four years, for NUTS 3 areas with the largest and smallest sample sizes
Image .csv .xlsFigure 4 shows that for NUTS 3 areas, the sample sizes ranged from an average of 198 households in Bedford to 4,096 households in Berkshire. There were no county and unitary authorities or NUTS 3 areas that were not reported for any given year due to small sample sizes. Generally, the larger the population size of an area, the larger the sample sizes are, and so areas with smaller sample sizes tended to be areas of smaller population sizes.
Nôl i'r tabl cynnwys7. Comparing our estimates with regional dwelling stock estimates
The Department for Communities and Local Government (DCLG) produces regional dwelling stock by tenure estimates using data from the Annual Population Survey (APS) and applying occupancy rates from the English Housing Survey (EHS). Our estimates should therefore be comparable at the regional level.
Figure 5 compares the percentage of dwellings that are owner occupied between our estimates and DCLG estimates at the regional level.
Figure 5: Percentage of owner-occupied dwellings out of the total dwelling stock, by region
England, 2012 to 2015
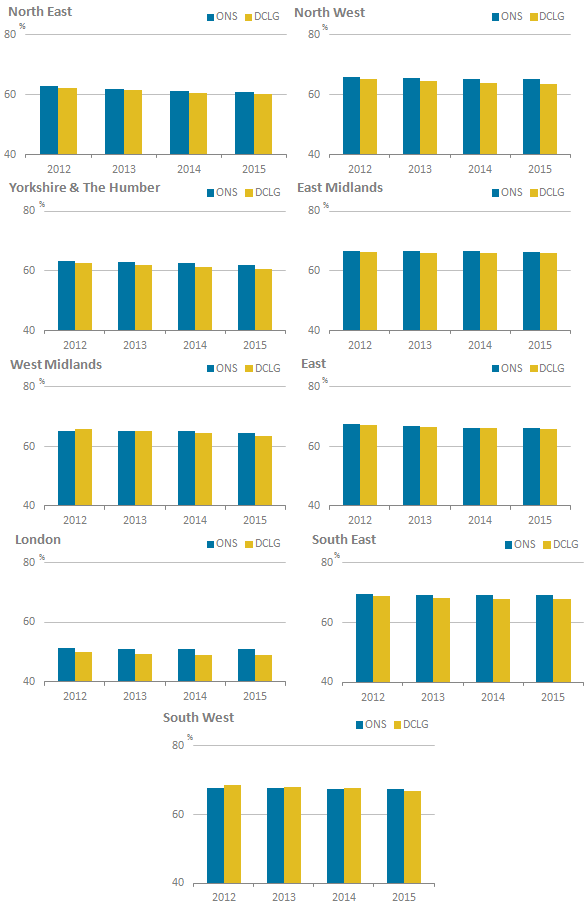
Source: Office for National Statistics and Department for Communities and Local Government
Download this image Figure 5: Percentage of owner-occupied dwellings out of the total dwelling stock, by region
.PNG (34.1 kB) .xlsx (36.3 kB)
Our estimates show similar but marginally higher owner-occupied percentages than DCLG estimates for every region and year, apart from the West Midlands in 2012 and the South West in 2012 to 2014. The largest difference was in London in 2015, where our estimates were 2.25 percentage points higher. The percentages were closest over the time series for the North East, East of England and East Midlands, where all differences were 1 percentage point or smaller. London was the only region where the difference for every year was greater than 1 percentage point.
The DCLG estimates of the percentage of privately-rented dwellings were marginally higher than our estimates for most regions and years. However, these differences were generally smaller than the differences in the owner-occupied dwellings percentages.
These differences are likely to be caused by the differences in occupancy rates used. DCLG uses occupancy rates for England as a whole, while we used regional occupancy rates. In our estimates, we apply our percentage breakdown within the private sector to the published private sector stock figures for each area in Table 100 and 109. This creates consistency with the published National Statistics for the overall private sector stock. This way, there is one estimate of the total number of dwellings in the private sector, which we break down further into owner-occupied and privately-rented dwellings.
Nôl i'r tabl cynnwys8. Stability of estimates over time
The suitability of the Annual Population Survey (APS) to produce estimates of dwelling stock by tenure depends, to some extent, on the sample sizes at the subnational level, and whether they are large enough to make robust estimates of the dwelling stock. To test whether the results are sufficiently robust, we analysed the stability of local authority owner-occupied and privately-rented stock percentages over time in relation to sample size. We would expect that for most areas, the percentages would not fluctuate largely year-on-year.
Figures 6 and 7 show the differences in the percentage of owner-occupied and privately-rented dwelling stock over the four-year period (taken from the highest to lowest point regardless of which year these occurred) against the APS sample size of private sector households for each local authority. City of London has been excluded from Figures 6 and 7, because it had consistently small sample sizes.
Figure 6: Change in the percentage of owner-occupied dwellings, by average (mean) sample size in the private sector for each local authority
England, 2012 to 2015
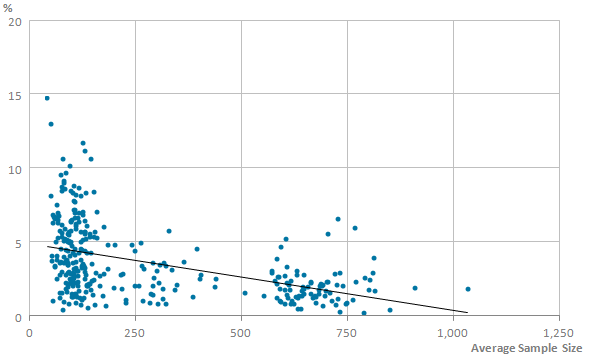
Source: Office for National Statistics, Department for Communities and Local Government
Download this image Figure 6: Change in the percentage of owner-occupied dwellings, by average (mean) sample size in the private sector for each local authority
.PNG (18.2 kB) .xlsx (30.3 kB)
Figure 7: Change in the percentage of privately-rented dwellings, by average (mean) sample size in the private sector for each local authority
England, 2012 to 2015

Source: Office for National Statistics, Department for Communities and Local Government
Download this image Figure 7: Change in the percentage of privately-rented dwellings, by average (mean) sample size in the private sector for each local authority
.PNG (18.7 kB) .xlsx (39.0 kB)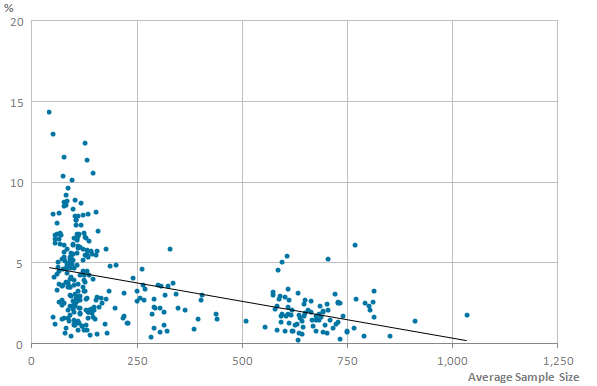
Figures 6 and 7 show that the most unstable local authorities tended to have the lowest sample sizes. However, there were also local authorities with relatively small sample sizes in which the dwelling stock percentages didn’t change a large amount.
The two most unstable local authorities for both owner-occupied and privately-rented stock were West Somerset and Richmondshire, which had average sample sizes of 41 and 49 respectively. These are relatively small sample sizes and so for this reason, we have chosen to not report any estimates made on areas where the sample size is smaller than 50 in any given year.
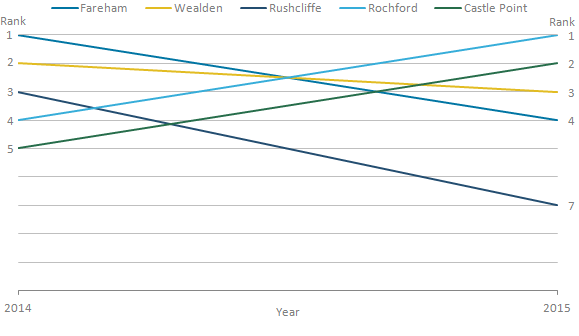
Another way of assessing stability is by looking at the local authorities with the highest percentages for dwellings in a given tenure in one year, and comparing the rank with its rank in the following year. We would not expect the rank of most local authorities to change much over a single year. However, it is likely that some areas will change more than others. Figures 8, 9 and 10 show the year-on-year change in ranks of owner- occupied dwelling percentages out of the total stock, for the five local authorities that had the highest percentages in 2012.
Figure 8: Rank of owner-occupied dwelling percentages, for the five local authorities that had the highest percentages in 2012
England, 2012 to 2013
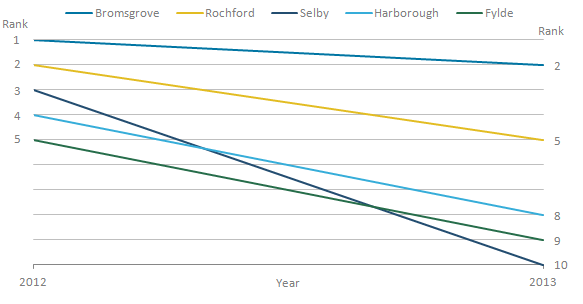
Source: Office for National Statistics, Department for Communities and Local Government
Download this image Figure 8: Rank of owner-occupied dwelling percentages, for the five local authorities that had the highest percentages in 2012
.PNG (11.5 kB) .xlsx (16.1 kB)
Figure 9: Rank of owner-occupied dwelling percentages, for the five local authorities that had the highest percentages in 2013
England, 2013 to 2014

Source: Office for National Statistics, Department for Communities and Local Government
Download this image Figure 9: Rank of owner-occupied dwelling percentages, for the five local authorities that had the highest percentages in 2013
.PNG (8.6 kB) .xlsx (15.9 kB)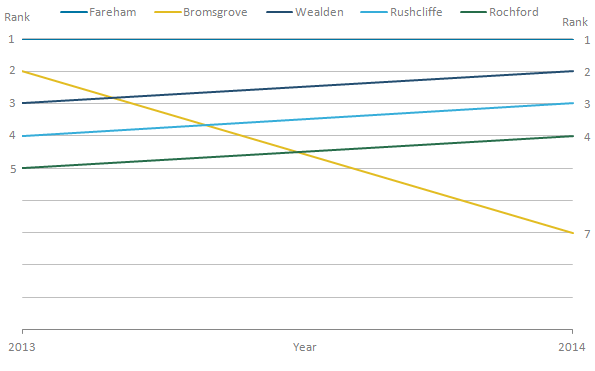
Figure 10: Rank of owner-occupied dwelling percentages, for the five local authorities that had the highest percentages in 2014
England, 2014 to 2015
Source: Office for National Statistics, Department for Communities and Local Government
Download this image Figure 10: Rank of owner-occupied dwelling percentages, for the five local authorities that had the highest percentages in 2014
.PNG (10.8 kB) .xlsx (15.7 kB)
The largest year-on-year change in rank for a local authority, for those that start within the highest five ranks, was seven places. This was in Selby, which had the third highest owner-occupied percentage in 2012 and the 10th highest in 2013. Selby had a decrease in the percentage of owner-occupied dwellings, by 3.8 percentage points. All of the local authorities that appeared in the top five ranks for a given year were within the top 10 in the following year.
Nôl i'r tabl cynnwys9. Measuring uncertainty
These estimates of the dwelling stock by tenure are derived from the Annual Population Survey (APS), and so 95% confidence intervals and coefficients of variation (CVs) have been included to indicate the degree of uncertainty around the estimates. Confidence intervals are generally wider when the sample sizes in the APS are smaller.
The CVs are derived from the proportion of dwellings in the private sector (p) and the sample size of the number of dwellings in the private sector (n) as follows:
Generally, a CV of lower than 10% is considered good and a CV of lower than 20% is considered acceptable. CVs of greater than 20% could indicate a relatively large amount of uncertainty around an estimate, although this has to be considered in the context of the whole set of estimates and associated CVs.
In these dwelling stock estimates, the CVs tend to be lower the higher the percentage of owner-occupied dwellings. Figures 11 and 12 show the proportions of local authorities in each CV category for owner-occupied and privately-rented dwellings respectively.
For owner-occupied dwellings, the majority of local authorities had a CV of less than 5%, whereas for privately-rented dwellings the CVs were generally higher and had a wider distribution. Figure 12 shows that more than 30% of local authorities had CVs in excess of 20% for all years.
Figure 11: Coefficients of variation for the percentage of owner-occupied dwellings by local authority
England, 2012 to 2015
Source: Office for National Statistics, Department for Communities and Local Government
Download this chart Figure 11: Coefficients of variation for the percentage of owner-occupied dwellings by local authority
Image .csv .xls
Figure 12: Coefficients of variation for the percentage of privately-rented dwellings by local authority
England, 2012 to 2015
Source: Office for National Statistics, Department for Communities and Local Government
Download this chart Figure 12: Coefficients of variation for the percentage of privately-rented dwellings by local authority
Image .csv .xlsThe estimates of the percentage of privately-rented dwellings have greater uncertainty around them than the estimates of the percentages of owner-occupied dwellings. However, relatively high levels of confidence around the estimates of owner-occupied dwellings give us assurance that the estimates of privately-rented dwellings are robust. This is because the estimates of the percentage of privately-rented dwellings are residuals of the percentage of owner-occupied dwellings out of the total private sector stock.
When comparing the CVs to existing official statistics derived from the APS, the estimate of gross pay of all employees in 2016 showed that 5% of local authorities had a CV of less than 5%. For these estimates, 59% of local authorities had CVs of between 5% and 10%, while 37% of local authorities had CVs of more than 10%. The uncertainty around our estimates of dwelling stock by tenure at the local authority level is largely consistent with the level of uncertainty of these official statistics.
Nôl i'r tabl cynnwys