1. Introduction
There are three main types of tenure for which dwellings can be categorised. These are owner-occupied, privately rented and social housing. Annual estimates of the tenure of dwellings for subnational geographies will provide evidence to help planning authorities set housing policy, and allow them to monitor the distribution of tenure over time within an area and between areas. They will also provide information which helps the sampling and adjustment of data collected about the Private Rented Sector.
Published statistics on dwelling stock by tenure are available at the national level, produced by the Ministry of Housing, Communities and Local Government (MHCLG). MHCLG also produces dwelling stock estimates for local authority districts in England, but this only includes data for the private sector overall. In England, annual statistics on the breakdown of the private sector into owner-occupied and privately rented dwelling stock at the subnational level are not available. There is a need for annual statistics which provide a full dwelling stock by tenure breakdown at the subnational level.
This Research Output provides the latest information about research into new methods and data sources used to produce annual subnational estimates of the dwelling stock by tenure in England. There are two articles in this release.
This article is an update to our previous Research Output, which uses the same method but with one year's extra data. As there is a degree of uncertainty around these estimates, it can be difficult to achieve robust estimates at small geographical levels, and ways to overcome this are explored in the second article.
The second article describes an alternative method of producing estimates of dwelling stock by tenure which brings together data from multiple sources for local authorities in England and Wales. The aim is to improve the precision of the estimates by building on the strengths of multiple sources of information.
Nôl i'r tabl cynnwys2. Main points
In 2018, the estimated percentage of dwellings that were owner-occupied ranged from 27.8% in Tower Hamlets in London to 85.8% in Ribble Valley in the North West.
The percentage of privately rented dwellings in 2018 ranged from an estimated 6.2% in Ribble Valley to 39.4% in Westminster.
Hertsmere in the East of England had the largest proportionate increase in privately rented dwellings over the last six years, as well as the largest decrease in the percentage of owner-occupied dwellings.
Local authorities which had the highest percentage of privately rented dwellings in 2018 were typically in London and surrounding areas, whereas the local authorities which had the highest percentages of owner-occupied dwellings were distributed across English regions, excluding London, the South West and North East.
In 2018 there were 101 local authorities in which at least 20% of the dwelling stock was privately rented, up from 83 local authorities in 2012.
3. Disclaimer
We have published these Research Outputs to provide an indication of the tenure breakdown of dwellings within the private sector at the subnational level. Research Outputs are produced to provide information about new methods and data sources being investigated.
Official statistics on private dwellings by tenure are currently only available at the country level. Statistics on dwelling stock by tenure are available for local authorities but do not provide a breakdown of owner-occupied and privately rented dwellings.
The statistics presented in this release are subject to a margin of error because they are estimates based on a survey. Users of these statistics should refer to the coefficient of variation (CV) and confidence intervals – which provide a measure of the uncertainty around the estimates – when making interpretations.
Nôl i'r tabl cynnwys4. Things you need to know about this release
These subnational estimates of dwelling stock by tenure were created using data from the Annual Population Survey (APS) to produce statistics on the number and percentage of owner-occupied and privately rented dwellings out of the total dwelling stock for subnational geographies in England.
Estimates are available in a dataset accompanying this article. They include estimates by:
country
region
local authority district
county and unitary authorities
Nomenclature of Territorial Units 3 areas (NUTS 3)
combined authorities
The APS is a household survey and so only dwellings that are occupied are included in the data because it is not possible to obtain a survey response from a vacant dwelling. The method used to produce the estimates requires an assumption that households sampled in the APS are equivalent to occupied dwellings, but there are definitional differences between households and dwellings. For example, the tenure of some households may differ from the tenure of the dwellings in which they reside. We make an adjustment to the survey-based estimate to account for the dwelling stock that is vacant because we are estimating the total number of dwellings that are taken up by each tenure type. These estimates cover the total number of dwellings which are taken up by each tenure type.
To make the vacancy rate adjustment, occupancy rates by year, region and tenure from the English Housing Survey (EHS) are applied to the owner-occupied and privately rented stock estimates derived from the APS. This is useful because the likelihood of a dwelling being vacant varies by tenure, with privately rented dwellings more likely to be vacant than owner-occupied dwellings.
The likelihood of a dwelling being vacant also varies across geographical areas. In 2017, the difference in occupancy rates between English regions ranged from 84.5% of privately rented dwellings in the South West to 94.2% in the North West. This highlights the importance of using occupancy rates for as small a geography as possible.
We used occupancy rates for each year apart from 2018 for which data are not currently available. We have applied the occupancy rates for 2017 to the 2018 APS data in the calculation of these estimates.
These statistics provide an estimate of the total number of dwellings within each tenure type, including dwellings that are vacant, which have been constrained to the published National Statistics on private sector stock produced by the Ministry of Housing, Communities and Local Government (MHCLG).
The private sector stock (owner-occupied plus privately rented dwellings) for regions sum to England overall, to the nearest thousand dwellings. Aggregating the private sector stock of local authorities does not sum to the regional or England level private sector stock, because of data imputation. Data for local authorities are taken from MHCLG's Table 100 (XLS, 735kb). Regional data and country level data are taken from Table 109 (XLS, 39.5kb) and Table 104 (XLS, 40kb) respectively.
We use the number of dwellings in each of these tenures to provide percentages of owner-occupied and privately rented dwellings out of the total dwelling stock. In this release we are not focusing on social housing because National Statistics on social housing by local authority are produced by MHCLG in Tables 100,115 and 116. We have produced statistics that provide a breakdown of tenure within the private sector. MHCLG also publishes a breakdown of tenure within the private sector for England overall, and we include this figure in the datasets which accompany this release.
There is a degree of uncertainty around the estimates because they are based on a sample of households and are less precise than if the survey covered every household. It is best to interpret these statistics over a longer time series to assess changes in housing tenure. Significant differences throughout this Research Output refer to 95% confidence intervals around the estimates not overlapping.
Nôl i'r tabl cynnwys5. Research findings
According to the Ministry of Housing, Communities and Local Government (MHCLG), nearly two thirds (63.2%) of the total dwelling stock in England was owner-occupied in 2018. This percentage has decreased slightly since 2012, when 63.8% of dwellings were owner-occupied.
To present estimates of dwelling stock by tenure for subnational geographies, survey data are used in this release. Figure 1 shows the percentage of owner-occupied dwellings, presented with their 95% confidence intervals for English regions in 2018.
Figure 1: The South East continues to have the largest percentage of owner-occupied dwellings of all English regions
Percentage of owner-occupied dwellings, by region, England, 2018
Source: Office for National Statistics - Annual Population Survey, Ministry of Housing, Communities and Local Government - English Housing Survey, Live tables on dwelling stock
Notes:
- Error bars refer to the 95% confidence intervals for an estimate.
Download this chart Figure 1: The South East continues to have the largest percentage of owner-occupied dwellings of all English regions
Image .csv .xlsIn 2018, the South East was the region which had the largest percentage of owner-occupied dwellings (69.3%), while London had the lowest (51.3%). These estimates for the English regions have remained relatively stable for the last six years.
Figure 2 shows the percentage of privately rented dwellings, presented with their 95% confidence intervals, for English regions in 2018.
Figure 2: More than a quarter of dwellings in London were privately rented in 2018
Percentage of privately rented dwellings, by region, England, 2018
Source: Office for National Statistics - Annual Population Survey, Ministry of Housing, Communities and Local Government - English Housing Survey, Live tables on dwelling stock
Notes:
- Error bars refer to the 95% confidence intervals for an estimate.
Download this chart Figure 2: More than a quarter of dwellings in London were privately rented in 2018
Image .csv .xlsIn 2018, London had a larger percentage of privately rented dwellings (26.4%) than any other English region. There was less variation between other regions for privately rented dwellings than for owner-occupied dwellings, with no region having more than 20% privately rented dwellings.
The tenure breakdown at the regional level does not present the full picture of variations in tenure in different areas. It is more useful to look at estimates for local authorities to understand tenure differences between areas. For this lower-level geography, the 95% confidence intervals are wider, so it is important to consider the uncertainty around the estimates when looking at changes or differences.
Figure 3 shows the percentage of owner-occupied and privately rented dwellings out of the total dwelling stock across local authorities in England for 2018.
Figure 3: Percentage of owner-occupied and privately rented dwellings by local authority
England, 2018
Embed code
Generally, areas with a higher percentage of owner-occupied dwellings have a lower percentage of privately rented dwellings, but this is not always the case because some areas have a relatively high percentage of social housing.
Figure 3 shows that in 2018, local authorities which had relatively high percentages of owner-occupied dwellings were distributed across regions, except for London and the North East. Local authorities which had the highest percentages of privately rented dwellings were in London and the neighbouring South East and East regions.
The tenure breakdown of dwellings in London is different to other English regions, with a significantly lower percentage of owner-occupied dwellings, and a signficiantly higher percentage of privately rented dwellings than all other regions. There is also variation in the tenure breakdown between local authorities within London. Figure 4 shows the five local authorities in London which had the highest and lowest percentage of owner-occupied dwellings in 2018.
Figure 4: Tower Hamlets had the lowest percentage of owner-occupied dwellings in England
Percentage of owner-occupied dwellings, by local authority, London, 2018
Source: Office for National Statistics - Annual Population Survey, Ministry of Housing, Communities and Local Government - English Housing Survey, Live tables on dwelling stock
Notes:
- Error bars refer to the 95% confidence intervals for an estimate.
Download this chart Figure 4: Tower Hamlets had the lowest percentage of owner-occupied dwellings in England
Image .csv .xlsEight of the ten local authorities with the lowest percentage of owner-occupied dwellings were in London, particularly Inner London, with local authorities in Outer London predominantly having higher percentages of owner-occupied dwellings. Overall the highest rates of owner-occupied dwellings were outside London.
In 2018, the percentage of owner-occupied dwellings in London ranged from 27.8% in Tower Hamlets to 71.7% in Havering. Despite Havering having the highest owner-occupied dwellings rate in London, it was the 92nd highest out of the 317 local authorities in England.
The highest percentage of owner-occupied dwellings in England was in Ribble Valley in the North West (85.8%). In 2012, Ribble Valley had the 32rd highest percentage of owner-occupied dwellings (76.6%), an increase of 9.2 percentage points over the six-year period. Higher rates of owner-occupied dwellings are associated with factors such as housing affordability and the prevalence of social housing.
Figure 5 shows the five local authorities with the highest and lowest percentage of privately rented dwellings in England in 2018.
Figure 5: Local authorities in London continue to have the largest percentage of privately rented dwellings in England
Percentage of privately rented dwellings, by local authority, England, 2018
Source: Office for National Statistics - Annual Population Survey, Ministry of Housing, Communities and Local Government - English Housing Survey, Live tables on dwelling stock
Notes:
- Error bars refer to the 95% confidence intervals for an estimate.
Download this chart Figure 5: Local authorities in London continue to have the largest percentage of privately rented dwellings in England
Image .csv .xlsOf the 311 local authorities for which estimates are available for 2018, 13 had less than 10% privately rented dwellings out of the total dwelling stock. These were spread across five regions. The lowest of these was Ribble Valley in the North West, with an estimate of 6.2% privately rented dwellings. Generally the areas with the highest proportions of privately rented dwellings were in London.
Figure 6 shows the percentage of local authorities which had at least 70% of owner-occupied dwellings in 2018
Figure 6: Lower rates of owner-occupied dwellings are becoming increasingly common
Distribution of the percentage of all dwellings that are owner-occupied, in local authority districts, 2012 and 2018
Source: Office for National Statistics - Annual Population Survey, Ministry of Housing, Communities and Local Government - English Housing Survey, Live tables on dwelling stock
Download this chart Figure 6: Lower rates of owner-occupied dwellings are becoming increasingly common
Image .csv .xlsFigure 6 shows that there were slightly fewer local authorities with a percentage of owner-occupied dwellings at 70% and over in 2018, in comparison with 2012. This indicates a decrease in the number of local authorities with higher owner-occupied percentages over time.
Figure 7 shows the percentage of local authorities which had at least 20% privately rented dwellings in 2018.
Figure 7: Higher rates of private renting are becoming increasingly common
Distribution of the percentage of all dwellings that are privately rented, in local authority districts, 2012 and 2018
Source: Office for National Statistics - Annual Population Survey, Ministry of Housing, Communities and Local Government - English Housing Survey, Live tables on dwelling stock
Download this chart Figure 7: Higher rates of private renting are becoming increasingly common
Image .csv .xlsFigure 7 shows that the rate of private renting was most commonly under 20% in local authorities, in both 2012 and 2018. Between 2012 and 2018 there were increases in the proportion of local authorities which had a percentage of privately rented dwellings at 20% or over.
These are estimates from survey data, and so it is important to look at the confidence intervals around the estimates to identify if changes to the estimates over time are statistically significant. Between 2012 and 2018, the two local authorities that had a significant change in owner-occupied dwellings both decreased, while those with a significant change in privately rented dwellings had an increase.
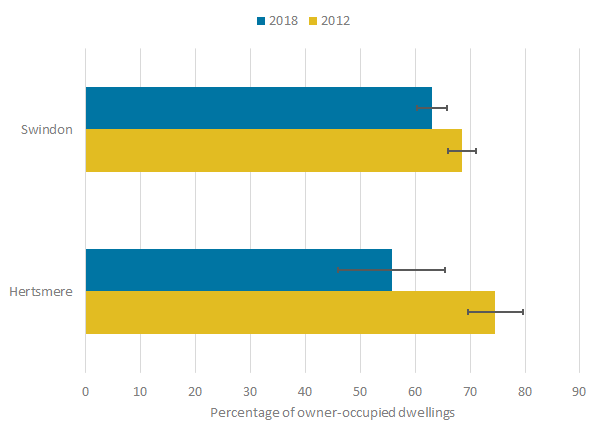
Figure 8 shows that Hertsmere had the largest proportionate decrease in owner-occupied dwellings between 2012 and 2018.
Figure 8: Two local authorities had a significant change in the percentage of owner-occupied dwellings between 2012 and 2018
Percentage of owner-occupied dwellings for the local authorities which had significant changes between 2012 and 2018
Source: Office for National Statistics - Annual Population Survey, Ministry of Housing, Communities and Local Government - English Housing Survey, Live tables on dwelling stock
Notes:
- Error bars refer to the 95% confidence intervals for an estimate.
Download this image Figure 8: Two local authorities had a significant change in the percentage of owner-occupied dwellings between 2012 and 2018
.png (5.7 kB) .xlsx (35.0 kB)
Figure 8 shows the local authorities that had significant changes in the percentage of owner-occupied dwellings over the last six years, when considering the 95% confidence intervals around the estimates. Hertsmere had the largest change, decreasing by 18.9 percentage points. There were more local authorities that had a significant change in the percentage of privately rented dwellings, which are shown in Figure 9.
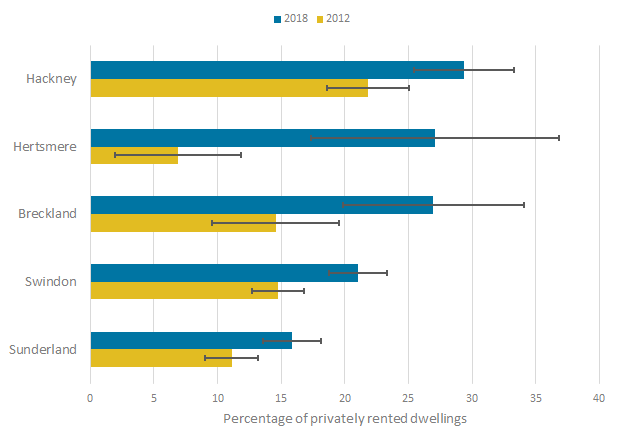
Figure 9: Hertsmere had the largest proportionate increase in privately rented dwellings over the last six years
Percentage of privately rented dwellings for the local authorities which had significant changes between 2012 and 2018
Source: Office for National Statistics - Annual Population Survey, Ministry of Housing, Communities and Local Government - English Housing Survey, Live tables on dwelling stock
Notes:
- Error bars refer to the 95% confidence intervals for an estimate.
Download this image Figure 9: Hertsmere had the largest proportionate increase in privately rented dwellings over the last six years
.png (10.0 kB) .xlsx (35.5 kB)
In addition to having the largest decrease in owner-occupied dwellings over the last six years, Hertsmere also had the largest proportionate increase in privately rented dwellings. In Hertsmere, 27.1% of all dwellings were privately rented in 2018, nearly four times the rate in 2012 (6.9%).
All of the local authorities that had significant change in the percentage of privately rented dwellings between 2012 and 2018 had an increase. These local authorities are distributed across England. It is not suprising that Hertmere and Swindon have significant changes for both owner-occupied and privately rented dwellings over time because as one tenure is increasing prevalence, the other is decreasing.
Nôl i'r tabl cynnwys6. Feedback
We are keen to receive feedback on this Research Output and the methodology used to produce these estimates including how they might be improved, and potential uses of the data. Please email your feedback to better.info@ons.gov.uk.
Nôl i'r tabl cynnwys7. Further development of dwelling stock estimates
Alongside this Research Output, there is an additional article exploring the use of a new method of producing subnational dwelling stock by tenure estimates which makes use of data from multiple sources. As this new method has been successful and improved the precision of the estimates, we are looking to adopt this new methodology. For more information, see the article which describes the new method.
In addition, we will explore whether there are any other data sources which could be incorporated into our new method, to try to further improve the precision of the estimates.
Nôl i'r tabl cynnwys8. Quality and methodology
For details about the quality and methodology of these estimates, refer to our previous publication Research Outputs: Subnational dwelling stock by tenure estimates, England: 2012 to 2017.
The previous publication contains more detailed information on:
data sources
other sources of data
tenure information
households versus dwellings
geography
weighting to national population totals
applying vacancy rates and smoothing
measures of uncertainty
If you are interested in the step-by-step process used to produce these estimates, refer to our Research Output published in December 2017.
Nôl i'r tabl cynnwys9. Dwelling stock by tenure statistics across the UK
Annual subnational statistics on the dwelling stock are available for each of the four UK countries. For England, Scotland and Wales these are also available with a breakdown of the number of owner-occupied and privately rented dwellings, as well as social housing. Statistics on the breakdown of owner-occupied and privately rented dwellings by local government district are not yet available for Northern Ireland.
Across the UK, the concepts measured are the same, but the statistics are produced using different methods and data sources.
In England and Wales, the Annual Population Survey is used. This provides an estimate of the number of owner-occupied and privately rented dwellings at local authority level. However, there are some differences between the two sets of statistics:
Statistics for Wales are designated as National Statistics whereas the statistics for England are still being developed and are not designated as National Statistics.
Statistics for England are adjusted to account for regional variations in the proportion of vacant dwellings by tenure; this adjustment is not yet done for the statistics for Wales.
For Scotland, the breakdown of owner-occupied and privately rented dwellings are from the Scottish Household Survey. These are applied to the estimates of privately-owned dwelling stock, as provided by National Records of Scotland.
Nôl i'r tabl cynnwys