1. Key points
- 44.6 million adults (87%) in the UK had used the Internet in Q1 2014, an increase of 1.1 million since Q1 2013
- 6.4 million adults (13%) had never used the Internet, falling by 659,000 since Q1 2013
- Almost all (99%) 16 to 24 year olds had used the Internet, compared with 37% of adults aged 75 years and over
- Men (89%) were more likely to be Internet users than women (85%)
- London had the highest proportion of Internet users (90%); Northern Ireland the lowest (79%)
2. Overview
This is the latest quarterly release about Internet use by adults aged 16 years and over. Internet use is linked to various socio-economic and demographic characteristics, such as age, sex, disability, geographical location and weekly earnings. For example, those who are less likely to have used the Internet include both the elderly and disabled adults.
The estimates in this release are derived from the Labour Force Survey (LFS) and are not seasonally adjusted. ONS developed these statistics to meet the needs of users (see background note 4). There is a particular interest and focus in the UK on those who have never used the Internet.
On 8 August 2013, ONS published the annual Internet Access – Households and Individuals 2013 statistical bulletin. The annual survey provides more information on Internet use than this quarterly update. However, while the estimates in the annual bulletin are more detailed, they are derived from the Opinions and Lifestyle Survey, which has a smaller sample size than the LFS. Therefore comparisons made between this quarterly release and the annual publication should be undertaken with caution.
Nôl i'r tabl cynnwys3. What do you think?
We are constantly aiming to improve this release and its associated commentary. We would welcome any feedback you might have; please contact us via email: esociety@ons.gov.uk or telephone Cecil Prescott on +44 (0)1633 456767.
Nôl i'r tabl cynnwys4. Users and non-users
In Q1 2014, there were 44.6 million adults in the UK who had ever used the Internet, representing 87% of the adult population. The 6.4 million adults who had never used the Internet represented 13% of the adult population.
There was an increase, since Q4 2013, of 347,000 adults (1%) who had ever used the Internet and an increase of 1.1 million (2%) compared with a year earlier (Q1 2013).
Since questions on Internet usage have been asked on the LFS (Q1 2011) the number of Internet users has increased by 3.5 million (8%).
There was a decrease, since Q4 2013, of 253,000 adults (4%) who had never used the Internet and a decrease of 659,000 adults (9%) compared with a year earlier (Q1 2013).
Figure 1: Internet non-users
Source: Office for National Statistics
Download this chart Figure 1: Internet non-users
Image .csv .xls5. Age
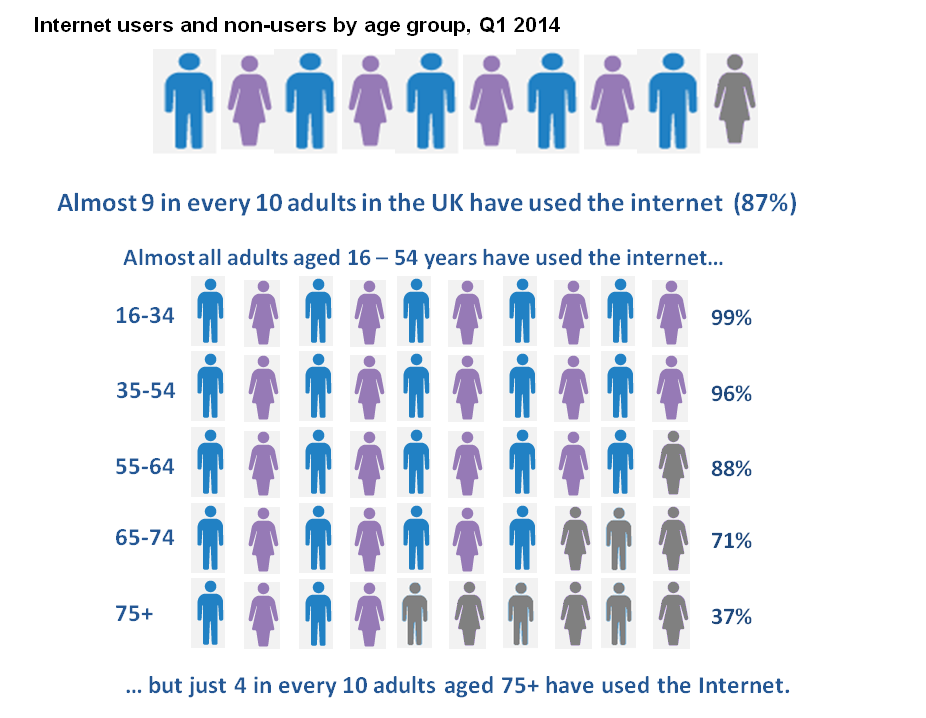
Age is a key factor as to whether an individual has ever used the Internet. Almost all adults aged 16 to 24 years (99%) had ever used the Internet (7.1 million people). In contrast, only 37% of adults aged 75 years and over had ever used the Internet, representing 1.8 million people.
Of the 6.4 million adults who had never used the Internet in Q1 2014, 47% (3.0 million) were aged 75 years and over.
Since Q1 2011, the proportion of adults aged 75 years and over who have ever used the Internet has increased by 13 percentage points.
Internet users and non users by age group, Q1 2014

Download this image Internet users and non users by age group, Q1 2014
.png (61.6 kB)6. Sex
In Q1 2014, there were 22.4 million male and 22.2 million female Internet users. Men were more likely to have used the Internet than women, with 89% of men having ever used the Internet compared with 85% of women.
These differences have remained since the first quarterly survey was undertaken in Q1 2011.
Since Q1 2011, the proportion of both and women who have ever used the Internet has increased by 5 percentage points.
Figure 2: Internet users by sex
Source: Office for National Statistics
Download this chart Figure 2: Internet users by sex
Image .csv .xls7. Disability
Estimates of adults with a disability are presented in Q1 2014 as defined by the Equality Act rather than the Disability Discrimination Act.
The 3.5 million disabled adults who had never used the Internet represented 30% of the adult population who were disabled.
Of those adults who reported no disability, 7% (3.0 million adults) had never used the Internet.
Figure 3: Internet non-users by disability status
Source: Office for National Statistics
Download this chart Figure 3: Internet non-users by disability status
Image .csv .xls8. Age and sex
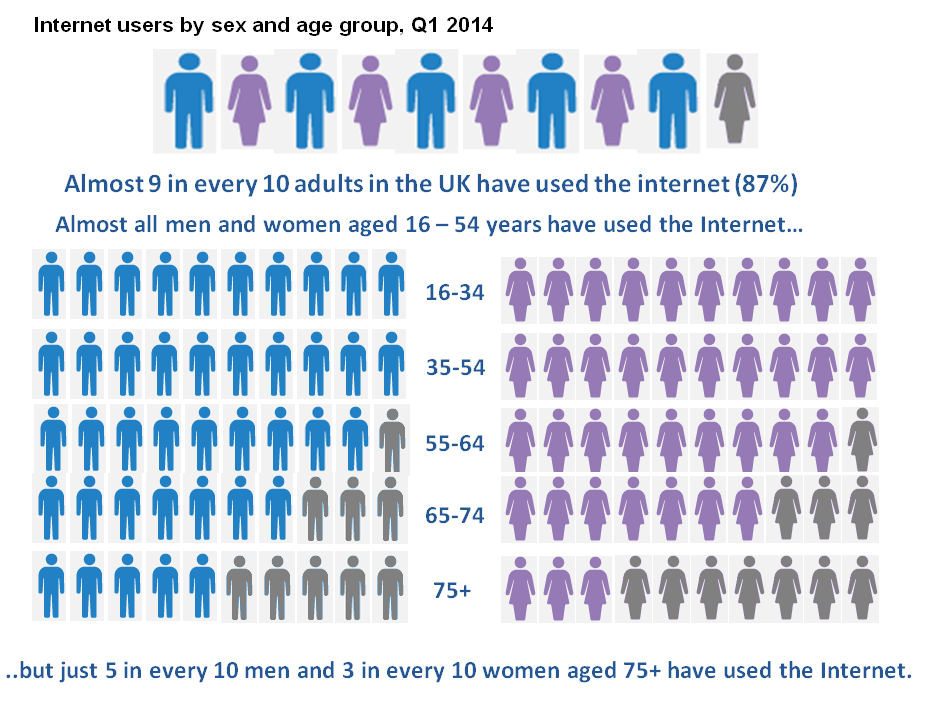
Tables 2A and 2B show that men in the older age groups are more likely to use the Internet than women of the same age. In Q1 2014, approximately five in ten (47%) men aged 75 years and over had ever used the Internet, compared with three in ten (30%) women.
There is little difference in Internet use between men and women in all age groups under 65 years of age.
Internet users by sex and age group, Q1 2014

Download this image Internet users by sex and age group, Q1 2014
.png (66.3 kB)9. Ethnic group
Tables 3A and 3B show comparatively small differences in Internet use between ethnic groups; the highest rates of Internet use (over 90%) were among adults who indicated that their ethnic group was Mixed ethnic, Chinese, Black, or Other.
The Pakistani ethnic group remained the group with the lowest rate of use (82%) in Q1 2014.
Nôl i'r tabl cynnwys10. Regional distribution
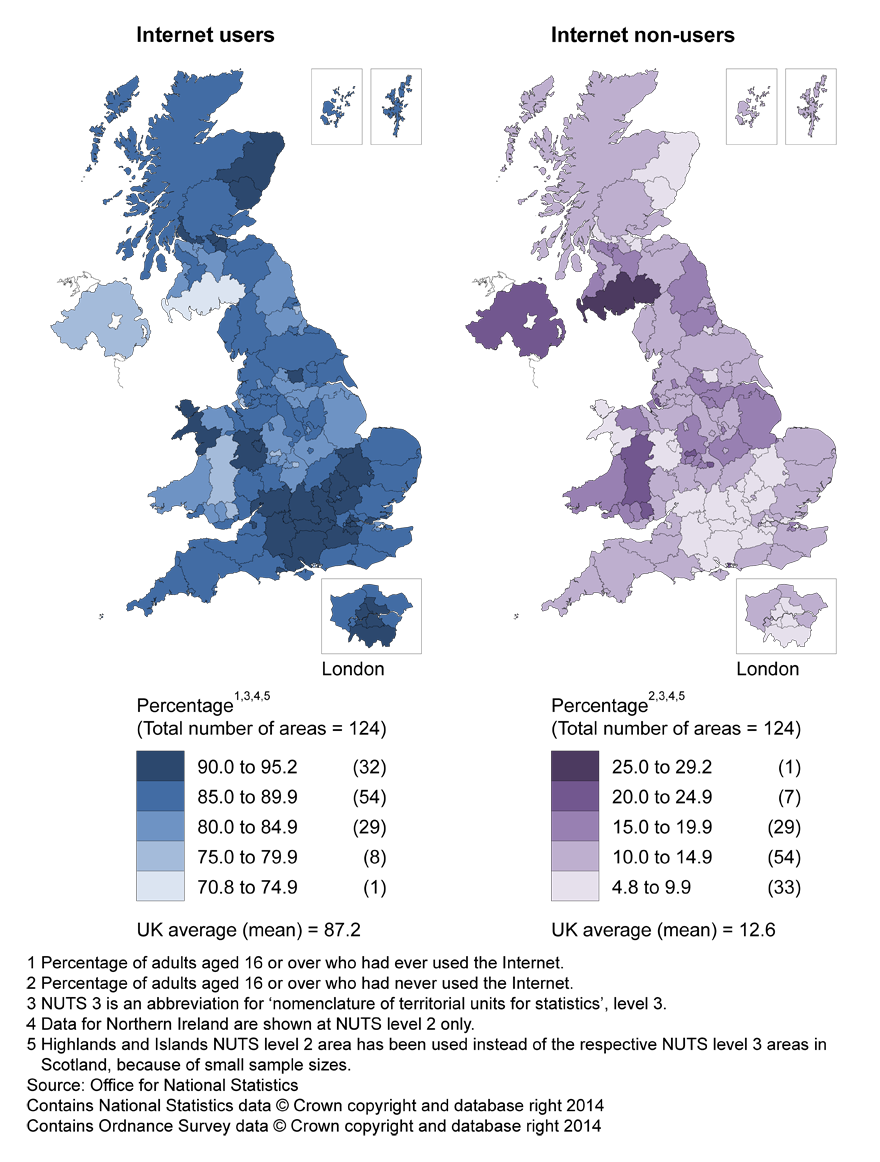
London had the highest proportion of Internet use, with 90% of adults reporting that they had ever used the Internet in Q1 2014. In contrast only 79% of adults in Northern Ireland reported that they had ever used the Internet.
Tables 5A and 5B are presented at a lower level of geography than tables 4A and 4B and have been included due to user interest. The estimates are based on smaller sample sizes than the higher level regional estimates in tables 4A and 4B and are therefore subject to a greater degree of sampling variability, so should be treated with caution (see background note 6).
MAP: Internet usage by region, Q1 2014

Download this image MAP: Internet usage by region, Q1 2014
.png (369.6 kB)The map shows the proportion of Internet usage by geographical area. While there is sampling variability around these estimates, the area with the highest proportion of adults who had never used the Internet in Q1 2014 was Dumfries and Galloway (29%).
A mapping tool is available for viewing the Q1 2014 results, by region and the UK as a whole. The mapping tool can be used to illustrate how, in each region, the number of people who have ever used the Internet has changed from Q1 2011, as well as enabling comparison with other regions.
Nôl i'r tabl cynnwys11. Earnings
Tables 6A and 6B show that Internet use has almost reached full coverage for those earning in excess of £500 a week, with Internet use at 99% or above for all groups with weekly pay rates above this level.
In Q1 2012, 7% (367,000) of adults earning less than £200 per week had never used the Internet, compared with 5% (253,000) in Q1 2014.
Nôl i'r tabl cynnwys12. Recent internet users
In Q1 2014, 97% of those adults who had ever used the Internet had used it within the three months prior to interview and 3% had used it more than three months ago.
Adults aged 75 years and over were most likely to have used the Internet more than 3 months ago (14%) whereas only 0.3% of Internet users aged 16 to 24 years used it more than 3 months ago.

