Cynnwys
- Main points
- Things you need to know about this release
- Household internet access continues to rise
- London and the South East of England have the highest internet access
- Nearly 9 out of 10 adults in Great Britain use the internet at least weekly
- Nearly 8 out of 10 adults access the internet “on the go”
- Email remains the most common internet activity
- Online shopping continues to grow
- Quality and methodology
1. Main points
In 2017, 90% of households in Great Britain had internet access, an increase from 89% in 2016 and 57% in 2006.
In terms of access, 73% of adults accessed the internet “on the go” using a mobile phone or smartphone, more than double the 2011 rate of 36%.
In terms of purchases, 77% of adults bought goods or services online, up from 53% in 2008.
Clothes or sports goods were purchased by 56% of adults, making these the most popular online purchase in 2017.
In 2017, 93% of adults who had bought online in the last 12 months, had done so from online sellers in the UK, while 31% had bought from sellers in other EU countries and 31% had bought from the rest of the world.
2. Things you need to know about this release
The Internet Access Survey results are derived from the Opinions and Lifestyle Survey (OPN). Estimates for 2017 in this release refer to data collected in the January, February and April 2017 modules of the OPN.
We first collected statistics on internet access in 1998. Since then, various changes have been made to the Internet Access Survey, including the publication of annual results since 2006. Where possible, we make comparisons over time, however, time series comparisons vary, as the survey questions change from year to year.
In this release, “on the go” refers to access to the internet, away from home or work.
Nôl i'r tabl cynnwys3. Household internet access continues to rise
In 2017, 90% of households in Great Britain had an internet connection. This was up from 89% in 2016 and 57% in 2006.
Figure 1: Households with internet access, 1998 to 2017, UK and Great Britain
Source: Office for National Statistics
Notes:
- UK estimates from 1998 to 2004. Great Britain estimates from 2005 to 2017. Source: Family Expenditure Survey 1998 to 2001; Expenditure and Food Survey 2002 to 2004.
- Estimates were published on a quarterly basis from 1998 to 2004. See Households with Access to the Internet, 1998 to 2004
Download this chart Figure 1: Households with internet access, 1998 to 2017, UK and Great Britain
Image .csv .xlsChanges in the survey between 1998 and 2005 mean that the results before 2006 are not directly comparable with those from 2006 onwards. They are provided as our best available indication of growth in household internet access over this period.
Internet access varies depending on household composition. While nearly all households with children had an internet connection in 2017 (98%), access to the internet by single-adult households varied, depending on the age of the responder. For households with one adult aged 65 and over, 61% had internet access. In contrast, 88% of households with only one adult aged 16 to 64 years had internet access. The vast majority of households with internet access had fixed broadband (93%). Mobile broadband via mobile phone networks was used by 26% of households as an internet connection.
Households (10%) without internet access
Of those without internet access, 64% felt they didn’t need the internet as it was regarded as not useful or interesting. A further 20% felt they lacked skills and 12% reported that they had access to the internet elsewhere.
Nôl i'r tabl cynnwys4. London and the South East of England have the highest internet access
The highest levels of internet access in households across Great Britain were found in London and the South East of England, both at 94%. Since 2006, household internet access in Great Britain has grown by 32 percentage points, with increases across all regions and countries. The largest rise was in Scotland, increasing from 48% in 2006 to 90% in 2017.
Figure 2a: Household internet use, by country or region, Great Britain, 2006 and 2017
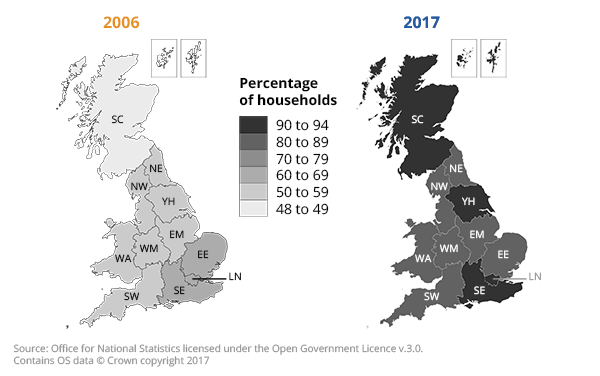
Source: Office for National Statistics licensed under the Open Government Licence v.3.0. Contains OS data © Crown copyright 2017
Notes:
- Base: Households in Great Britain.
Download this image Figure 2a: Household internet use, by country or region, Great Britain, 2006 and 2017
.png (64.1 kB) .xls (28.7 kB)
Figure 2b: Household internet use, by country or region, Great Britain, 2006 and 2017
Source: Office for National Statistics
Notes:
- Base: Households in Great Britain.
Download this chart Figure 2b: Household internet use, by country or region, Great Britain, 2006 and 2017
Image .csv .xls5. Nearly 9 out of 10 adults in Great Britain use the internet at least weekly
In 2017, 88% of adults in Great Britain used the internet at least every week, up from 51% in 2006. Since 2006, daily internet use has grown from 35% to 80% in 2017, while weekly use has declined, from 16% in 2006 to 8% in 2017. Although the survey results indicate a drop in daily use, of 2 percentage points since 2016, this may be a result of sample variation. For more information on this, please see our confidence intervals index page.
Nôl i'r tabl cynnwys6. Nearly 8 out of 10 adults access the internet “on the go”
In 2017 in Great Britain, 78% of adults had used the internet “on the go” (that is, away from home or work) using a mobile or smartphone, portable computer or other handheld device. While almost all adults aged 16 to 24 years (98%) had accessed the internet “on the go”, only 39% of those aged 65 years and over had done so.
The most common type of device used to access the internet “on the go” was a mobile or smartphone, used by 73% of adults, followed by portable computer such as a laptop or tablet (43%). Other handheld devices (for example, MP3 or e-book reader) were used to access the internet by 14% of adults.
The use of mobile or smartphones to access the internet “on the go” has continued to increase (from 70% in 2016 to 73% in 2017) and the use of portable computers has also increased (from 36% in 2016 to 43% in 2017).
Figure 3: Internet use on the go by device, 2013 to 2017, Great Britain
Source: Office for National Statistics
Notes:
- "On the go" refers to accessing the internet away from home or work.
- Base: Adults (aged 16 and over) in Great Britain.
Download this chart Figure 3: Internet use on the go by device, 2013 to 2017, Great Britain
Image .csv .xls7. Email remains the most common internet activity
In 2017, the most popular internet activity was sending or receiving emails (82% of adults), up 3 percentage points from 79% in 2016. Finding information about goods and services was the second most popular at 71% of adults, up from 58% in 2007.
There has been growth over time in how people use the internet for a range of everyday activies. There has been a rise in the proportion of adults carrying out all the internet activities that were surveyed in 2007 and again in 2017.
Reading online news, newspapers or magazines has tripled from 20% in 2007 to 64% of adults in 2017. Internet banking rose by 33 percentage points since 2007, to 63% in 2017.
Figure 4: Internet activities by age group, 2017, Great Britain
Source: Office for National Statistics
Notes:
- Base: Adults (aged 16 and over) in Great Britain.
Download this chart Figure 4: Internet activities by age group, 2017, Great Britain
Image .csv .xlsUse of the internet for social networking rose from 45% in 2011, to 66% in 2017. There was little difference in the proportion of men and women carrying out the activities surveyed.
Nôl i'r tabl cynnwys8. Online shopping continues to grow
In 2017 in Great Britain, 77% of adults had bought goods or services online in the last 12 months. This was unchanged from 2016, but a rise of 24 percentage points since 2008.
Younger people tend to be more active shopping on the internet than older people, but older people are catching up in their shopping activity.
The largest rise in adults buying online was in those aged 55 to 64 years, where there has been a rise of 30 percentage points since 2008, to 75% in 2017. The age group with the smallest rise in online shopping was those aged 25 to 34 years, with growth of 17 percentage points, to 89% in 2017.
Clothes or sports goods were still the most popular online purchase in 2017, bought by 56% of adults. Household goods (for example, furniture and toys) were the next most popular items, purchased by 50% of adults, while holiday accommodation was purchased by 44% of adults.
Younger adults bought online more often than older adults. While 26% of adults aged 25 to 34 years bought online 11 or more times in the last 3 months, only 7% of those aged 65 and over also did so. Similarly, 24% of adults aged 25 to 34 years bought online 6 to 10 times, compared with 8% of those aged 65 and over.
Figure 5: Frequency of online shopping, by age group, 2017, Great Britain
Source: Office for National Statistics
Notes:
- Base: Adults (aged 16 and over) in Great Britain.
Download this chart Figure 5: Frequency of online shopping, by age group, 2017, Great Britain
Image .csv .xlsIn 2017, 93% of adults who had bought online in the last 12 months, had done so from online sellers in the UK, while 31% had bought from sellers in other EU countries and 31% had bought from the rest of the world. Since 2008, there has been growth of only 6 percentage points in adults buying from UK sellers online, from 87% to 93% in 2017. However, there has been growth of 19 percentage points in those buying from other EU sellers, increasing from 12% in 2008 to 31% in 2017.
In 2017 in Great Britain, 27% of adults bought physical goods from online sellers outside the UK. Those aged 25 to 34 years were most likely to buy these products (37%) with those aged 65 and over being the least likely (12%). Men were more likely to purchase online from outside the UK than women. For example, 15% of men purchased products that were downloaded or accessed from websites or apps, compared with 6% of women.
Figure 6: Products bought or ordered over the internet from outside the UK by age group, 2017, Great Britain
Source: Office for National Statistics
Notes:
- Base: Adults (aged 16 and over) in Great Britain.
- Such as electronics, clothes, toys, food, groceries, books, CDs or DVDs.
- Such as films, music, e-books, e-newspapers, games, paid apps.
- Such as tickets and documents by mail or printed by yourself.
- Such as tickets for events received via mail, telecom subscriptions.
Download this chart Figure 6: Products bought or ordered over the internet from outside the UK by age group, 2017, Great Britain
Image .csv .xlsAdults who had bought or ordered goods or services online were asked whether they had encountered any problems with this. The most common problem encountered was the speed of delivery being slower than indicated, experienced by 29% of adults who had bought online in the last 12 months. This was followed by 27% who had experienced a technical failure of a website during the ordering or payment process. However, 44% of those who had bought online had not encountered any problems.
Information was collected for the first time in the 2017 survey about activities that are considered part of the “sharing economy”. This is generally regarded as the use of the internet for sharing assets that were previously unused, or under used, although precise definitions vary. The activities that were surveyed relate to the use of the internet to arrange accommodation and transport from another private individual. The most common of these activities was the use of intermediary websites or “apps” to arrange accommodation; an activity carried out by 28% of adults. This was followed by use of intermediary websites or “apps” to arrange transport services, at 22%. Those aged 25 to 44 years were more likely to use relatively new ways of arranging such services.
Figure 7: Use of the internet to arrange accommodation or transport from another individual, by age group, 2017, Great Britain
Source: Office for National Statistics
Notes:
- Base: Adults (aged 16 and over) in Great Britain.
- Such as Airbnb, HomeAway, Onefinestay, SpareRoom etc.
- Such as Uber, Lyft, BlaBlaCar, Liftshare etc.
- Including Facebook, Twitter etc.
- Including Facebook, Twitter etc.
Download this chart Figure 7: Use of the internet to arrange accommodation or transport from another individual, by age group, 2017, Great Britain
Image .csv .xls9. Quality and methodology
The voluntary nature of the survey means that people who do not wish to take part in the survey can refuse to do so.
The Internet Access Households and Individuals Quality and Methodology Information report contains important information on:
- the strengths and limitations of the data and how it compares with related data
- uses and users of the data
- how the output was created
- the quality of the output including the accuracy of the data