1. Main points
In 2013, 36 million adults (73%) in Great Britain accessed the Internet every day, 20 million more than in 2006, when directly comparable records began
Access to the Internet using a mobile phone more than doubled between 2010 and 2013, from 24% to 53%
In 2013, 72% of all adults bought goods or services online, up from 53% in 2008
In Great Britain, 21 million households (83%) had Internet access in 2013
Broadband Internet connections using fibre optic or cable were used by 42% of households, up from 30% in 2012
2. Summary
This release explores the use of the Internet by adults in Great Britain and draws attention to how households connected to the Internet in 2013. It provides useful information for those interested in what adults use the Internet for, the type of purchases made online and how homes in Great Britain connected to the Internet.
The Internet has changed the way people go about their daily lives. Almost three quarters of adults in Great Britain used the Internet everyday (73%) in 2013, with 6 out of every 10 adults (61%) using a mobile phone or portable computer to access the Internet 'on the go'.
In 2013, more people than ever before used the Internet for reading newspapers or magazines (55%), to access their bank accounts (50%), to seek health information (43%) or to buy groceries (21%). This release highlights that activities previously carried out on the high street, are now increasingly being carried out online.
This release reveals that adults aged 25 to 34 used the Internet more than any other age group to carry out a wide range of established ‘every day’ activities, such as purchasing goods or services online (92%), Internet banking (76%) and selling goods online (45%).
The results in this release are derived from the Opinions and Lifestyle Survey. On 14 August 2013, ONS will publish the latest quarterly statistics on adults who have ever or never used the Internet within the Internet Access Quarterly Update, Q2 2013 statistical bulletin. The quarterly estimates are derived from the Labour Force Survey (LFS). The LFS has a much larger sample than the Opinions and Lifestyle survey and therefore allows for more detailed socio-demographic analysis to be undertaken. The Quarterly Update should be used as ONS’ official source for the number of individuals in Great Britain accessing the Internet.
ONS first collected statistics on Internet access in 1998. Since then, a number of changes have been made to the Internet Access survey, including the publication of annual results since 2006. Where possible, comparisons over time are made in this release. However, the available coverage for time series comparisons varies, because the questions included in the survey vary each year.
Nôl i'r tabl cynnwys3. User engagement
We are constantly aiming to improve this release and its associated commentary. We would welcome any feedback you might have, and would be particularly interested in knowing how you make use of these data to inform your work. Please contact us via email: esociety@ons.gov.uk or telephone David Matthews on +44 (0)1633 456756.
Nôl i'r tabl cynnwys4. Computer and internet use
On 15 May 2013, as part of the Internet Access Quarterly Update, ONS reported that 42.4 million people in Great Britain had used the Internet, representing approximately 86% of the adult population. Use of a computer is inextricably linked to the ability of an individual to use the Internet. In 2013, 70% of adults in Great Britain used a computer every day, up from 45% in 2006.
Figure 1: Daily computer use by age group, 2006 and 2013
Source: Office for National Statistics
Download this chart Figure 1: Daily computer use by age group, 2006 and 2013
Image .csv .xlsA sizable increase in daily computer use, by age, in the past seven years has been for adults aged 65 and over. In 2006, just 9% reported that they used a computer every day, this compares to 37% in 2013.
Nôl i'r tabl cynnwys5. Frequency of internet use
In 2013, 36 million adults in Great Britain used the Internet every day, or almost every day. This represented 73% of those aged 16 and over and was more than double the number of adults (16 million) that used the Internet daily in 2006 (when directly comparable records began). Daily Internet use has increased by 2.5 million since 2012.
Figure 2: Daily Internet use, 2006 to 2013
Source: Office for National Statistics
Download this chart Figure 2: Daily Internet use, 2006 to 2013
Image .csv .xlsUse of the Internet on a daily basis has increased markedly in a short space of time, from 35% of all adults in 2006 to 73% in 2013. Correspondingly, there has been a drop in the number of adults who use the Internet on a weekly basis, from 16% in 2006 to just 9% in 2013.
Nôl i'r tabl cynnwys6. Internet activities
There are distinct differences in how individuals make use of the Internet when analysed by age. As ‘early-adopters’, it is of little surprise that those adults in the two youngest age groups (16 to 24 and 25 to 34) are proportionately the largest users of many of the Internet activities surveyed.
In 2013, adults aged 16 to 24 were most likely to engage in online activities that focused on leisure or recreation; especially new activities such as social networking (93%), consulting wikis (60%), downloading software (55%) and telephoning or making video calls over the Internet via a webcam (40%).
Adults aged 25 to 34 reported the highest level of use in many of the activities surveyed, in particular day-to-day activities such as sending emails (89%) and finding information about goods and services (77%). This trend is particularly evident when considering online banking where over three quarters (76%) of those aged 25 to 34 accessed their bank accounts over the Internet. This compares to only half of all adults (50%).
The Internet provides a popular alternative to many of the traditional ways of completing every day tasks. For example, in 2007, approximately only one in five adults (18%) used the Internet to access health information using websites such as NHS direct. In 2013, 43% of all adults had used the Internet to find health information online. Among those aged 25 to 34 the rate of use increased to nearly 6 in 10 (59%).
Figure 3: Internet activities, 2007 and 2013
Source: Office for National Statistics
Download this chart Figure 3: Internet activities, 2007 and 2013
Image .csv .xlsIn 2013, with reports of decreased physical newspaper readership, there has been media interest in how people will access the news in the future. Over half of all adults (55%) used the Internet to read or download the news, newspapers or magazines in 2013, compared to only 20% of adults in 2007. Those aged 25 to 34 (72%) were most likely to read or download news online. Almost half (49%) of 55 to 64 year olds reported that they now access news online.
Social networking has been one of the major success stories of the Internet age and its use continues to grow. In 2013, over half (53%) of all adults participated in social networking, up from 48% in 2012. Almost all adults aged 16 to 24 (93%) have used social networks, but it is important to note that its use is not solely confined to the youngest age groups, with one in every two adults (50%) aged 45 to 54 year olds now reporting that they partake in social networking.
There has been significant growth, in the last six years, in adults selling goods or services online. In 2007, only 1 in 10 adults (12%) used sites such as eBay or Gumtree to sell goods online. This had more than doubled by 2013, with 28% of adults selling goods over the Internet. Of those aged 25 to 34, just under half (45%) reported that they had now sold goods or services online.
Using services related to travel and travel related accommodation is one of only three activities favoured by those aged 55 to 64 to a greater degree than the youngest age group aged 16 to 24; at 51% and 46% respectively. In total, one in every two adults (50%) indicated that they used the Internet for this activity.
Figure 4: Internet activities by age group, 2013
Source: Office for National Statistics
Download this chart Figure 4: Internet activities by age group, 2013
Image .csv .xls7. Unemployment and the use of the internet
The Internet has become a key tool for those looking for work.
In 2013, two thirds (67%) of unemployed adults had looked for a job or submitted a job application online. Just over half of unemployed adults (54%) reported that they had looked on the Internet for information about education, training or courses.
Approximately two thirds (67%) of those who were unemployed indicated that their computer skills were sufficient if they needed to start a new job. This figure compares to 72% of adults currently in employment.
Figure 5: Using the Internet to seek employment or training by economic status, 2013
Source: Office for National Statistics
Notes:
- Base: Adults (aged 16+) in Great Britain.
Download this chart Figure 5: Using the Internet to seek employment or training by economic status, 2013
Image .csv .xls8. Internet shopping
The convenience of Internet shopping has proved very popular for consumers. The Eurostat report ‘Internet use in households and by individuals in 2012’ which published data relating to UK residents aged 16 to 74 (rather than for all adults, including those aged over 74 years, in Great Britain which is the basis of this statistical bulletin), compared rates of online shopping across the EU. It reported that the UK had the highest rate of online purchasing, with 82% of Internet users buying online, slightly ahead of Norway at 80%, followed by Denmark and Sweden both at 79%.
Map 1: Internet purchasing by individuals in the last 12 months by country, 2012
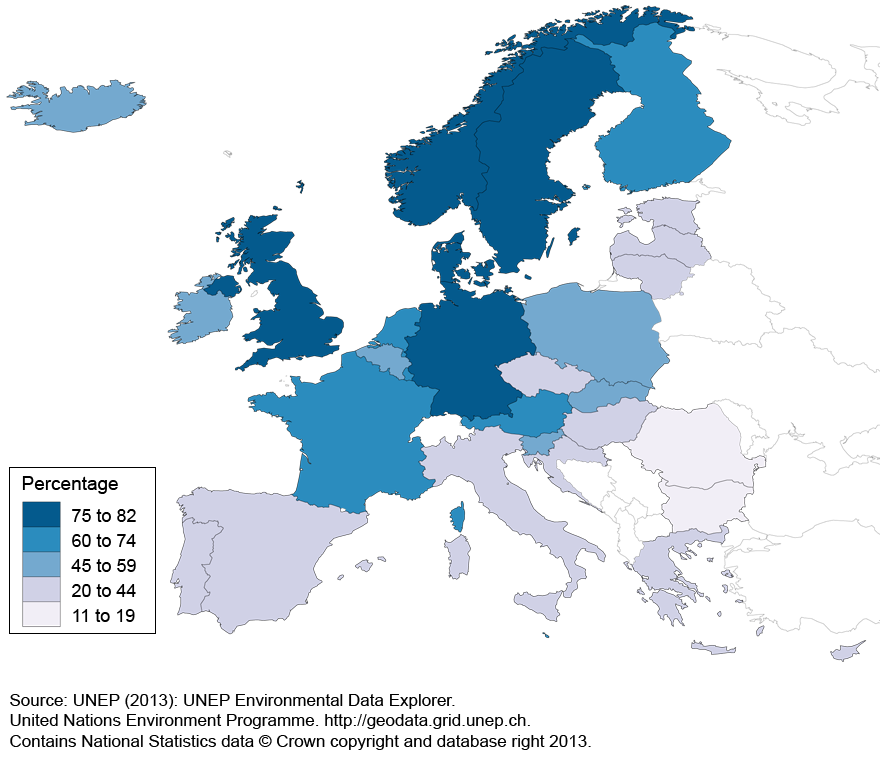
Download this image Map 1: Internet purchasing by individuals in the last 12 months by country, 2012
.png (198.7 kB)
In 2013, as regular stories appear in the media reporting the decline of the high street, it is interesting to note that almost three quarters (72%) of all adults reported buying goods or services online. This has risen from 53% since 2008. While younger age groups have traditionally embraced Internet shopping (92% of 25 to 34 year olds), there has been significant growth in the rate of online purchasing by those aged over 65. Over a third of those aged 65 and over bought online (36%) in 2013, more than double the 2008 estimate of 16%.
Clothes were the most popular online purchase in 2013, bought by 47% of all adults. Those aged 25-34 were most likely to buy these items (68%). In 2013, half of all women (50%) bought clothes online, compared with 45% of men.
There is a noticeable difference in the type of goods bought online, when analysed by age. In 2013, for example, only 15% of those aged 16 to 24 bought food and groceries online, compared with 34% of those aged 35 to 44.
Figure 6: Purchases made over the Internet by age group, 2013
Source: Office for National Statistics
Download this chart Figure 6: Purchases made over the Internet by age group, 2013
Image .csv .xls9. Downloads
In 2013, one in every two adults (50%) who bought films or music online downloaded the content or accessed it via a streaming website such as Lovefilm or Netflix. Men (53%) were more likely to do this than women (47%).
Over half of all adults (52% of both men and women) who bought reading material online, such as books, magazines, newspapers or e-learning material, did so via download or bought eBooks for readers such as Kindle or Nook.
Nôl i'r tabl cynnwys10. Mobile internet
In October 2012, the UK’s first 4G network was launched, offering faster mobile broadband than the existing 2G and 3G networks previously provided. In 2013, the 4G network is set to expand, with more providers due to launch 4G services. Recent developments have not only been limited to mobile broadband, with the availability of wireless (wifi) hotspots increasing at a rapid rate. Leading companies provide thousands of hotspots across the country. These are now regularly seen at locations such as pubs, cafes and hotels. The availability of both mobile broadband and wifi networks means the mobile Internet is now used by more people than ever before.
In 2013, 6 in 10 adults (61%) had used a device such as mobile phone or portable computer (a tablet or laptop) to access the mobile Internet, away from home or work. Almost all those aged 16 to 24 (94%) had used a mobile phone or portable device to access the Internet “on the go”, compared with only 17% of those aged 65 or above.
The most popular device used to access the Internet ‘on the go’ was a mobile phone, with over half of all adults (53%) accessing the Internet this way. This has more than doubled since the 2010 estimate of 24%.
Figure 7: Internet use, 'on the go', 2013

Download this image Figure 7: Internet use, 'on the go', 2013
.png (56.0 kB)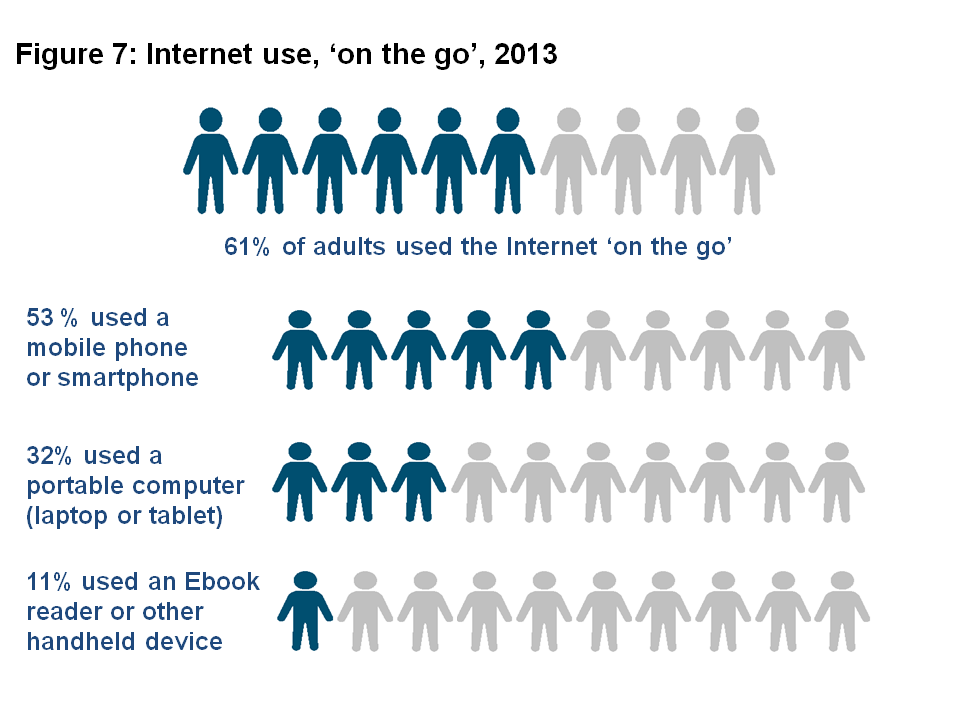
Almost 9 in 10 (89%) adults aged 16 to 24 used their mobile phone to access the Internet. However, this type of access is not solely limited to the early-adopting, younger age groups with just over half (51%) of those aged 45 to 54 accessing the mobile Internet on their mobile phone.
Figure 8: Internet use on a mobile phone by age group, 2010 and 2013
Source: Office for National Statistics
Download this chart Figure 8: Internet use on a mobile phone by age group, 2010 and 2013
Image .csv .xlsAccessing the Internet using portable computers such as tablets or laptops was popular with almost one third of all adults (32%). The three youngest age groups (16 to 24; 25 to 34 and 35 to 44) all reported similar rates of use, with those aged 25 to 34 leading the way at 43%. Of those aged 65 and over, 1 in 10 adults (11%) used a tablet or portable computer to access the Internet “on the go” in 2013.
One fifth (21%) of 16 to 24 year olds reported using a device such as a games console or eBook reader to access the Internet away from home or work. This type of access was heavily favoured by the younger age groups, with just 10% of 45 to 54 year olds accessing the Internet over these devices and only 11% of all adults.
Nôl i'r tabl cynnwys12. Household internet access
In 2013, 21 million households in Great Britain had an Internet connection. This represented 83% of households, up from 80% in 2012 and 57% in 2006.
There were 4 million households in Great Britain without Internet access in 2013, compared with 10 million in 2006. Figure 9 clearly shows that Internet access by households has increased dramatically since ONS first began collecting these statistics in 1998.
There were changes in the survey source, periodicity and coverage over the period 1998 to 2005; consequently these estimates (from 1998 to 2005) are not directly comparable with the annual estimates from 2006 onwards, but have been provided as our best indication of growth over this period.
Figure 9: Households with Internet access, 1998 to 2013

Source: Office for National Statistics
Notes:
- UK estimates from 1998 to 2004, Great Britain estimates from 2005 to 2013.
Download this image Figure 9: Households with Internet access, 1998 to 2013
.png (11.4 kB) .xls (20.0 kB)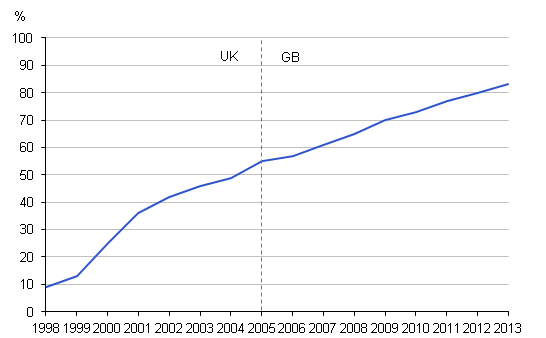
Internet access varies depending on household composition. The majority of households with children have an Internet connection (97%). This is the same figure as households made up of three or more adults (including homes of multiple occupancies such as student accommodation).
Access to the Internet by single adult households varies considerably depending on age. Where the adult is aged 65 or over, only 40% of households had an Internet connection. In contrast, 74% of households had an Internet connection where the adult was aged 16 to 64 years.
The way households connect to the Internet has changed considerably in recent years. In 2006, 31% of households made use of a dial-up connection over a standard telephone line. Seven years on and dial-up Internet has almost entirely disappeared from the Great Britain Internet map, with less than 1% of households still connecting this way. Therefore, for the vast majority of households an Internet connection now means a broadband connection over a Digital Subscriber Line (DSL), fibre optic or cable line.
Households accessing broadband, via fibre optic or cable connections, increased by 12 percentage points since 2012 (30%), to 42% in 2013. This is likely, as mentioned earlier, to be a result of increased investment into the availability of fibre optic connections. In comparison, DSL broadband is beginning to lose its dominance. In 2013, only 45% of households reported using a DSL connection, down from 57% in 2012.
Figure 10: Household Internet connection by type, 2012 and 2013
Source: Office for National Statistics
Download this chart Figure 10: Household Internet connection by type, 2012 and 2013
Image .csv .xlsReasons for no household Internet access
Of the 4 million households without Internet access, the majority (59%) said that they didn’t have a connection because they 'did not need it'. This is compared with 34% in 2006. While this may suggest that many households without the Internet are actively choosing not to subscribe, there is still a large and important minority who state that barriers prevent them from connecting to the Internet. Approximately, one in five households (20%) indicated that they did not have the Internet in their household due to a lack of computer skills. Further barriers included equipment costs and access costs being high at 13% and 12% of households without Internet access respectively.
Nôl i'r tabl cynnwys