Cynnwys
- Main points
- Overview of the self-funding population data for care homes
- Care Quality Commission provider information returns data
- Care Quality Commission Care directory data
- Data cleaning
- Data linkage
- Weighting the data
- Analysing the data
- Strengths and limitations of the data
- Future developments
- Glossary
- Related links
1. Main points
This methodology article provides detail around the methods, definitions and data sources used in the new experimental Care homes and estimating the self-funding population, England: 2019 to 2020 publication. This analysis estimates the proportion of the self-funding population in relation to several care home characteristics and relevant geographical attributes.
The term "self-funders" includes all individuals living in a care home setting (including care homes with or without nursing care); a "self-funder" is defined as an individual who contributes to or pays the entirety of their own care privately (either organised by themselves or through the local authority) or their care is provided by a charity. Self-funders may also be eligible for NHS-funded nursing care (see Glossary).
To explore the self-funding population in care homes, we used provider information returns (PIR) collected by the Care Quality Commission (CQC) between August 2019 and February 2020, which was a curtailed census of care homes in England. PIR returns that were sent and received after this time period were removed because of the impact on care homes from the coronavirus (COVID-19) pandemic. Between August 2019 and February 2020, 7,416 care homes were sent a PIR form.
There were 6,599 responses from care homes that could be linked to the CQC's Care directory with registered beds, which is a response rate of 89.0%. Care homes that were not present in the Care directory two months after the PIR had been returned, for example, because of deregistration, could not be linked (28 care homes). After validating, cleaning and editing the data to ensure they were of sufficient quality for analysis (see Figure 1), the sample was 6,099 care homes.
The PIR data were then linked to the CQC's Care directory by a unique ID assigned by CQC to each care provider. Main characteristics can be obtained for each individual care home from the Care directory including the size of the care home, care home rating and the type of care provided.
To ensure the most up-to-date geographical boundaries were used during the analysis, the PIR data were linked to the most recently published National Statistics Postcode Lookup File (NSPL) (August 2021) using the postcode for each individual care home. Geographic variables, such as Rural and Urban Indicators and Index of Multiple Deprivation were derived from the NSPL.
Weighting methods have been used to create an annual estimate of the population of self-funders from incomplete data on care homes in England. The region, care home type, latest rating and number of care home beds variables were used to calibrate the weighting, which follows a standard approach for Office for National Statistics (ONS) surveys.
This is the first iteration of a method that will undergo an informal consultation process, and feedback received on the data and analysis methods will be considered as part of future developments to the methods (see Future developments).
Nôl i'r tabl cynnwys2. Overview of the self-funding population data for care homes
The Office for Statistics Regulation highlighted that the lack of official data on self-funders makes it difficult to estimate the size and expenditure of the self-funding population in care homes (PDF, 347KB). The methods used to produce the data in the Care homes and estimating the self-funding population, England: 2019 to 2020 release can therefore help improve knowledge and understanding of the volume and value of privately funded provision of adult social care. An accurate measurement of the self-funding market in care homes can help plan workforce and services for future demand and inform current and future policies.
The analysis presented in Care homes and estimating the self-funding population, England: 2019 to 2020 can be used by government departments, public sector organisations, care providers, and the public to better understand the size and certain care home characteristics of the self-funding population. The care home resident population used in the analysis is an estimate based on weighted data, there is currently no up-to-date accurate count of care home residents in England.
The analysis was carried out using data from the provider information return (PIR), which is collected by the Care Quality Commission (CQC), alongside the CQC's Care directory – which provides details such as the characteristics and postcodes of individual care homes – and the National Statistics Postcode Lookup file, which relates current and terminated postcodes in the UK to a range of geographies. These data sources will be discussed in more detail in the following sections (3 to 6).
Nôl i'r tabl cynnwys3. Care Quality Commission provider information returns data
This section focuses on the main data source used in the Care homes and estimating the self-funding population, England: 2019 to 2020 release, the provider information returns (PIR) collected by the Care Quality Commission (CQC).
Provider information returns: data collection
The adult social care (ASC) PIR for residential services (care homes with or without nursing care) is a mandatory return. The CQC invites all registered residential ASC services to complete and submit a PIR every 12 months, providing a snapshot of the service provided. Invitations are sent in the anniversary month of the first site visit and, in the period covered by the report, services with no site visit were not invited to complete a PIR. The information is used by CQC to help monitor the quality of care provided, understand how services are performing between inspections and assist in decision making.
The PIR data are collected under Regulation 17(3) of the Health and Social Care Act 2008 (Regulated Activities) Regulations 2014. An extract of data relating to the people who use the service was shared with the Office for National Statistics (ONS) under Article 6(1)(c) and (e) and Article 9(2)(h) and (i) of the General Data Protection Regulation (GDPR), which is specified in the CQC Adult Social Care PIR guidance (PDF, 327KB). The CQC has agreed to share the data with the ONS in line with data sharing agreements.
The aim of the ASC PIR for residential services data collection was to have a census of care homes that are registered and have been inspected by CQC any time prior to or during the year collection period, with approximately 1 in 12 providers sent a PIR each month, meaning all eligible care homes are invited to return a PIR within the year. However, the data collection included in this release began in August 2019 and was suspended in March 2020 because of the impact of the coronavirus (COVID-19) pandemic and is therefore a curtailed census. Consequently, this experimental method is based on a sample of care homes that completed the PIR between August 2019 and February 2020, which has been weighted to provide an England-level annual estimate (see Weighting the data). A new PIR collection has begun as of March 2021.
Different ASC PIRs are sent to care homes and community care providers. For this article we only analyse the residential ASC PIR responses (responses from care homes). The definition of a care home used by CQC is as follows:
"A care home is a place where personal care and accommodation are provided together. People may live in the service for short or long periods. For many people, it is their sole place of residence and so it becomes their home, although they do not legally own or rent it. Both the care that people receive and the premises are regulated."
Where we refer to care homes, we mean all those people receiving care services in line with this definition (including care homes with and without nursing support). Additionally, where we refer to PIRs throughout the rest of the methodology article, we mean residential ASC PIRs.
Invitations to complete a PIR are emailed to providers, which include: the questions; guidance; frequently asked questions; code of practice on confidential personal information; and a privacy statement. The email also outlines the purpose and legal basis for collection, data sharing and use of personal data.
Data collection is conducted via an online self-completion questionnaire and the provider is given four weeks to complete the return. The individual filling in the PIR can either be the registered manager or a nominated individual, who is an appropriate person nominated by the organisation and is responsible for supervising the management of the regulated activity provided.
Questions on the PIR cover topics related to the types of service offered and the people who use the service. Of interest to this release are the data that care homes complete in relation to the numbers of "self-users" (self-funders), "state-users" (state-funded residents) and total users in a care home.
The PIR questions relevant for this analysis are related to Section 2 of the PIR: "People who use your service".
Relevant questions and guidance from the PIR used in this analysis
Question 2.10
Question: How many people are currently receiving support with regulated activities as defined by the Health and Social Care Act from your service?
Guidance: Number
Funding: Not applicable
Question 2.26
Question: How many of the people who use your service (i) are funded in full or in part by their local authority, or (ii) receive NHS Continuing Health Care?
Guidance: Include people here even if they pay user charges towards local authority funded care, pay using a local authority personal budget, or have someone paying a third-party top-up on their behalf
Funding: State-funded
Question 2.27
Question: How many other people use your service?
Guidance: These people will be self-funded or charity funded, including those in receipt of NHS Funded Nursing Care, and those paying the full cost through their local authority
Funding: Self-funder
Note: For Question 2.27, care homes may know that a resident's care is being arranged through the local authority, but not whether the resident is funded by the local authority, or self-funded and paying the full cost through their local authority.
For additional information on what is included in each definition please see Glossary.
Provider information returns: data quality
The data included in the report were collected between August 2019 and February 2020. Before data cleaning, the sample size was 6,630 care homes from a total of 15,581 care homes. For more information about the return sample, please see the Sampling error sub-section.
Data were collected for March 2020, however, there were fewer PIRs distributed and returned than expected because of the pandemic. We analysed the March 2020 data and compared this with August 2019 to February 2020 returns and while we did not see any immediate difference there is potential for unquantifiable bias, for example:
a care home that returned a PIR in March 2020 amongst the pressures of the pandemic may be more organised than those that did not
care homes in certain areas may have been impacted by COVID-19 to different extents during March 2020; this may have been dependent on whether the location of the care home was an initial hotspot of the virus and the extent of community transmission in those areas at that time
guidance from Department of Health and Social Care (since withdrawn) published on 19 March 2020 stated that patients who did not need to be in hospital must not remain in an NHS bed (PDF, 918KB); this may have resulted in patients being discharged to care homes and an atypical care home population
Moreover, the inclusion of the March 2020 data would not provide an accurate pre-pandemic baseline. For these reasons, any data that were returned during or after March 2020 were excluded from the analysis.
Response rate
The overall response rate of the PIR was 83.2%; however, this response rate includes PIR forms sent and received by CQC after February 2020. These data were excluded from the analysis because of the impact of the coronavirus pandemic on PIR responses (see the Provider information returns: data quality sub-section).
The response rate of the PIR between August 2019 and February 2020 was 89.0% for care homes. This was calculated using the number of care homes that returned a residential ASC PIR between August 2019 and February 2020 (6,599 care homes) and the total number of care homes that were invited to complete a residential ASC PIR to complete in the same time period (7,416 care homes). In situations where more than one PIR was returned by the same care provider, the response requested in the month of the anniversary of the care provider's inspection was included in the response rate and analysis.
Of the care homes that returned a residential ASC PIR between August 2019 and February 2020, 854 (12.9%) responses needed further investigation. More information relating to the processing and validation can be found in Data cleaning.
Sample bias
The return was distributed to providers based on the first inspection date and therefore could be impacted by sampling bias. There are multiple factors that influence when a care home is first inspected, these include:
when there is a change in a care provider's circumstances, for example, a merge or takeover by another organisation
CQC receives information suggesting the service has improved
a new care provider is registered with CQC
Sampling error
The PIR is a curtailed census, so estimates are subject to sampling variability because of the suspension of the distribution of questionnaires before a full census was completed.
To understand whether there was sampling error in the data, we analysed the distributions of characteristics of care homes in the PIR data, by linking them to the Care directory and National Statistics Postcode Lookup File (see Data linkage), and compared the distributions of the linked data with the distributions of the other care homes in the Care directory that did not return a PIR within our time period.
We selected the following variables available from the Care directory to analyse the differences in distribution: CQC quality rating; size of care home; and type of care home. We also selected a geography variable, region, based on care home postcodes available from the Care directory.
Table 1 shows the percentage differences in these variables only differ slightly between care homes that completed a PIR and care homes that did not complete a PIR between August 2019 and February 2020, therefore there is likely to be minimal bias in these data because of the selection method. Where there are differences in the distributions, these are minimised once the data has been weighted, as this process aligns the sample with the population (see Weighting the data).
| Care homes that completed a PIR (N=6,599) | All other care homes (N=8,982) | Absolute percentage difference | |
|---|---|---|---|
| Percentage of care homes by region (%) | |||
| East Midlands | 9.8 | 10.0 | 0.2 |
| East of England | 11.5 | 10.3 | 1.3 |
| London | 8.9 | 9.1 | 0.2 |
| North East | 5.1 | 4.6 | 0.5 |
| North West | 11.8 | 12.8 | 1.0 |
| South East | 20.4 | 18.7 | 1.7 |
| South West | 13.0 | 13.3 | 0.3 |
| West Midlands | 10.4 | 11.3 | 0.9 |
| Yorkshire and The Humber | 9.1 | 9.9 | 0.8 |
| Percentage of care homes by latest quality rating (%) | |||
| Outstanding | 4.2 | 4.0 | 0.2 |
| Good | 80.2 | 72.6 | 7.6 |
| Requires improvement | 14.5 | 17.2 | 2.7 |
| Inadequate | 1.1 | 1.5 | 0.4 |
| Percentage of care homes by care home size (%) | |||
| 1 to 19 beds | 43.9 | 41.8 | 2.1 |
| 20 to 39 beds | 27.3 | 27.5 | 0.2 |
| 40 to 59 beds | 16.7 | 16.5 | 0.2 |
| 60 beds and over | 12.2 | 14.2 | 2.0 |
| Percentage of care homes by care home type (%) | |||
| Care homes for older people | 14.3 | 12.6 | 1.7 |
| Care homes providing dementia care | 45.9 | 49.7 | 3.8 |
| Care homes for younger adults | 13.1 | 13.1 | 0.1 |
| Other types of care homes | 26.8 | 24.5 | 2.2 |
Download this table Table 1: Distribution by English region, care home size, care home rating and care home type for the uncleaned provider information return (PIR) data and all other care homes in the May 2020 Care directory
.xls .csvAny estimate based on a sample contains some uncertainty as to whether it accurately reflects the broader population of interest. A confidence interval gives an indication of the degree of uncertainty of an estimate, showing the precision of a sample estimate. We calculated 95% confidence intervals; this means if we repeated the study multiple times, 95% of the time the estimate of proportion of self-funders would lie between the lower and upper confidence limits. A wider interval indicates more uncertainty in the estimate. Overlapping confidence intervals indicate that there may not be a true difference between two estimates. Confidence intervals for the analysis can be found in the datasets accompanying the article.
Following analysis of the distributions of the care homes that returned a PIR, compared with all care homes in England, we conclude that the return sample is representative of the population. Confidence intervals were created alongside the estimates to provide certainty around the estimates produced.
Non-sampling error
The ONS was supplied with the raw responses data from CQC, which was then validated using data cleaning techniques. For example, we identified that for some PIR returns the total number of users reported on the form is not equal to the sum of self- and state-funders (affecting 854 (12.9%) care homes). There are many possible reasons for this such as human error when inputting data and care homes being unsure of a resident's funding status, and so not including them in the self- or state-funded breakdown but counting them in total users. We therefore implemented robust editing and cleaning steps to reduce non-sampling errors (see Data cleaning).
Strengths and limitations
The main strengths of the PIR include:
completion of the return is mandatory and has a high response rate, enabling a good coverage of data across care providers and reducing the impact of bias; more information about the sanctions imposed on a care provider if a PIR is not completed can be found on the CQC website
standardised questions enable reliable comparisons to be made across different regions and care homes in England
CQC offer extensive guidance for completing the PIR to ensure consistency in responses
as the PIR will be repeated annually, the longitudinal-style data collection will allow trends to be monitored over time
Limitations of the PIR include:
the data do not contain reasons as to why an individual is a self-funder (no further disaggregation relating to the type of self-funder or how much a self-funder pays for their care is available)
there is no further information relating to how care is funded or the reasons why people are self-funding
small sample size (6,099 care homes returned a residential ASC PIR after data cleaning); this is 39.1% of all care homes who were registered with CQC in the relevant time period (see Care Quality Commission Care directory data)
the PIR is not sent to care homes that register with CQC during the collection period; in the relevant time period (see Care Quality Commission Care directory data), approximately 412 care homes registered with CQC and therefore may still not have been sent a PIR to complete if the collection period had not been disrupted by the coronavirus pandemic
lack of other data sources relating to self-funders in care homes makes it difficult to quality assure PIR estimations
4. Care Quality Commission Care directory data
The Care Quality Commission's (CQC) Care directory is a publicly available dataset updated monthly and made available to download on the CQC website. The directory contains a list of every provider in England that is regulated by CQC.
The information contained in the Care directory is obtained via the registration process of every "person" (an individual, partnership or organisation) who provides regulated activity in England, as specified in the Health and Social Care Act (2008). For a care home to be registered with CQC, they must provide information about the number of care home beds they have. Care providers then must notify CQC when there are any changes in the information that is supplied.
We have used the Care directory to identify characteristics of care homes.
Variables used from the Care directory in the analysis and how they were derived
1) Care home beds, derived directly from the Care directory and split into categories of:
1 to 19 beds
20 to 39 beds
40 to 59 beds
60 or more beds
2) Care home rating, derived directly from the Care directory.
3) Whether the care home is run by a provider that runs at least one other care home, or by a provider that only runs one care home (provider size).
4) Care home type, derived using multiple variables from the Care directory. Four mutually exclusive categories were identified:
Dementia
older people (includes all people who have reached their 65th birthday onwards)
younger adults (includes people from their 18th birthday to the day before their 65th birthday)
other (all care homes not included in the above)
These allocations are hierarchical, and care homes that provide multiple types of care are categorised into one group only, with dementia care taking precedence. For example, a care home that both provides services for dementia and supports older people would be part of the dementia care home type.
Care homes were also split by those that provide nursing care and those that do not for our analysis. These are defined using the Care directory where "Service type – Care home service with nursing" is equal to "Y". All other care homes are then classed as those that do not provide nursing care.
Derivation of care home type
Care home type was created by specifying whether a care home provides care to the groups mentioned previously, each care home is only included within one category. The "Other" care home type category would capture care homes that are not encompassed by the three care home categories: "Dementia", "Older People", "Younger Adults". A care home can only be counted once, therefore this category may include care homes that provide care for the whole population, to children and to both "Older People" and "Younger Adults".
There are 12 Service User band (DOC, 113KB) variables, and a care home can provide care to multiple user groups, therefore some other user types will be included in the groupings listed previously. For example, there could be care homes providing support for people who misuse drugs and alcohol within the older people category. Care homes that provide services to children may also be included. More information about how providers identify which user groups they provide care is published by CQC in their CQC guidance.
The care home type categories and service user bands used to define them are the following.
Dementia (all ages):
- Dementia = "Y"
Older people (65 years and over):
- Sub-user Older People = "Y", Sub-user Younger Adult = blank, Dementia = blank
Younger adults (18 to 64 years):
- Sub-user Younger Adults = "Y", Sub-user Older People = blank, Dementia = blank
Other (all ages)
- All other care homes that do not meet the previous criteria
A variable that combines the "Older People" and "Dementia" care home type categories has also been created. This contains an estimate of the proportion of self-funders in care homes that provide care to older people, provide dementia care, and care homes that provide both.
Where a variable is "blank" this indicates that the care home does not provide services for this group. These variables can be found in the Care directory.
Missingness
For care home rating, there were initially 419 care homes without a rating. However, these were re-labelled so that there were no missing data in this variable, see Weighting the data for more information. As all care homes had at least one care home bed after cleaning, no data were missing from the care home size variable (see the following sub-section). For care home type and provider size, all care homes were able to be categorised as a type of care home, and as being run by a provider with single or multiple care homes, so there were no missing data for these variables. There were no missing geographic data as all care homes had a postcode associated with them on the Care directory.
Linking provider information returns and Care Quality Commission Care directory
The provider information return (PIR) data are linked to the Care directory via a unique location ID present in both datasets. The location ID for each care home is already included in the PIR sent by CQC, which prevents care homes inputting an incorrect ID by accident when completing the return.
If care providers did not have any care home beds (identified using the "Care homes beds" variable) then they were removed from the Care directory. This stage removed five care providers that were labelled as "care homes", in the Care directory, but did not have any care home beds.
For our analysis, we used directories between October 2019 and May 2020 so that each PIR could be linked to the directory two months in the future. The reasoning for this is to:
remove care homes that were on the verge of becoming deregistered or changing provider (that is, within two months) as these may be atypical and therefore introduce bias into the sample
retain care homes that were de-registered at a later point in the PIR data collection period (for example, after two months) to reduce valid PIR returns lost because of future de-registrations
ensure that any changes to the care home captured in the directory after the PIR are longer-term
Where a care home unique identifier is not present in the Care directory we are linking to, because of de-registration or change in provider, it is removed from the sample. This removes 28 care homes (see Data cleaning).
A care home that had returned a PIR may not be included in the linked Care directory because it has been deregistered, and therefore removed from the corresponding directory. The linked PIR and Care directory data does not include care homes that returned a PIR but deregistered within the two-month period before the next Care directory, as the care home population may be "atypical" and disproportionally impact the weighting methods.
Nôl i'r tabl cynnwys5. Data cleaning
Cleaning and editing
Robust cleaning and editing steps have been used on the linked provider information return (PIR) and Care Quality Commission (CQC) Care directory data to ensure the quality of the data (see Figure 1 and Figure 2).
Figure 1: Cleaning and editing stages implemented for the provider information return (PIR) data
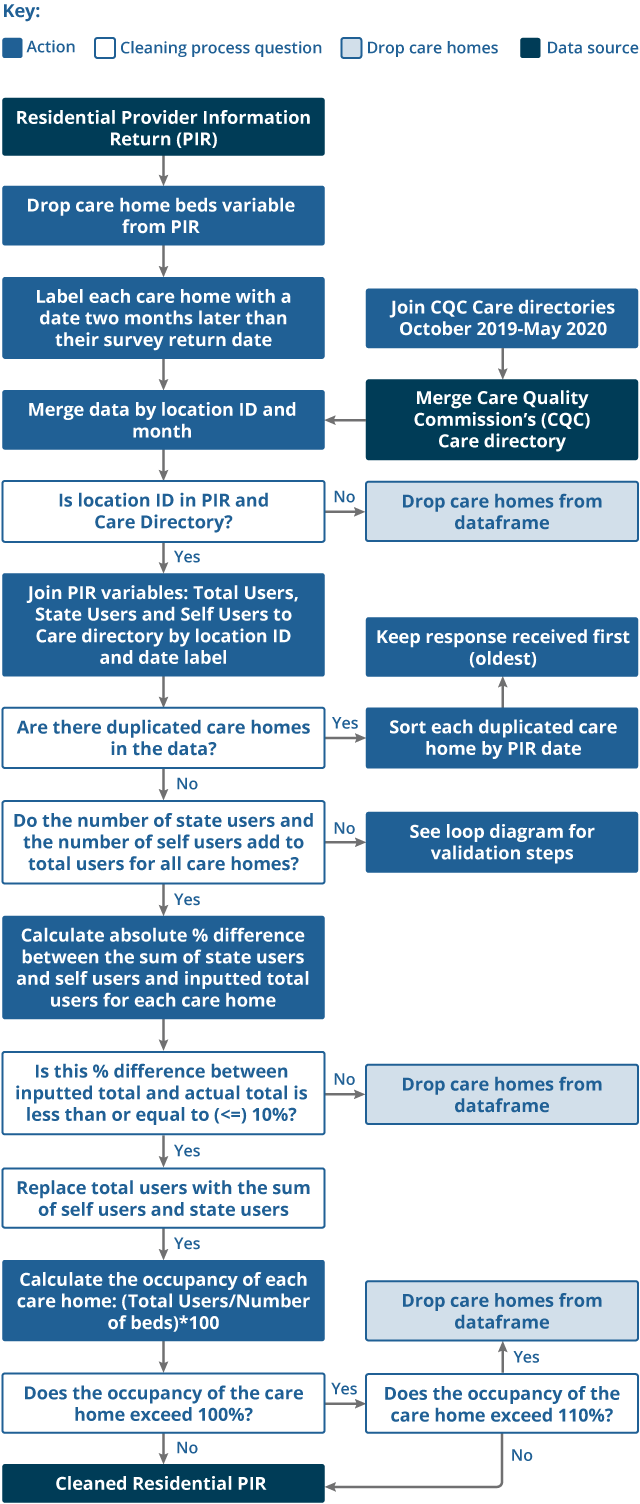
Source: Office for National Statistics
Download this image Figure 1: Cleaning and editing stages implemented for the provider information return (PIR) data
.png (157.0 kB)
Figure 2: Detailed view of the validation loop stage
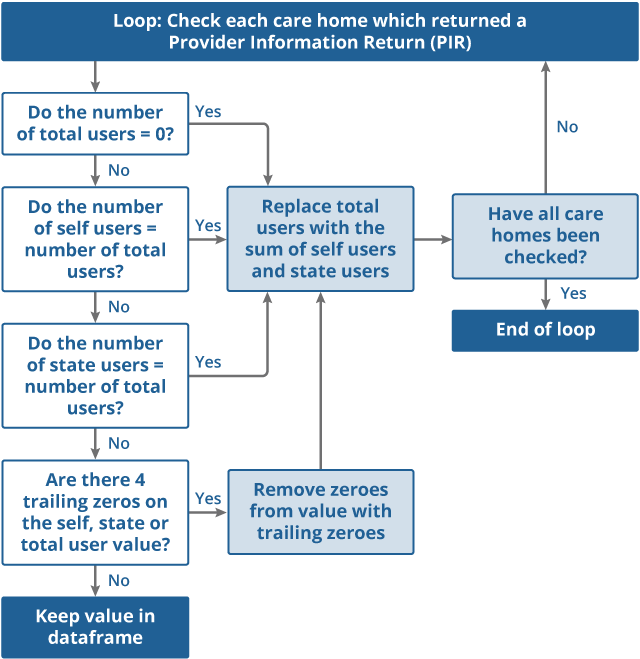
Source: Office for National Statistics
Download this image Figure 2: Detailed view of the validation loop stage
.png (63.7 kB)
Summary of the editing and cleaning undertaken
Link updated care home beds variable from CQC to PIR data.
Create an additional variable for month and year that corresponds to two months after the PIR (see the Linking provider information returns and Care Quality Commission Care directory sub-section in Section 4 for explanation).
Label the CQC data with the month and year released.
Merge the Care directories onto the PIR data, using the care home unique ID and month label, drop care homes that do not appear on the directory.
If there are duplicates, keep only the record with the earliest PIR date (this method was implemented to ensure consistency of which version of the PIR we would use where multiple responses were received).
Check that self- and state-users sum to the total users. If they do not sum to the total users, apply rules for obvious errors (see Table 2).
Drop rows where the sum of self- and state-funded users is different to total users by more than 10%. When the difference is less than this, keep the rows and edit total users to be the sum.
Calculate the occupancy of each care home using total users from the PIR and care home beds from the Care directory.
Remove rows where the occupancy exceeds 110%.
| Test | Edit | Percentage of care homes edited at each stage (%) |
|---|---|---|
| Total users filled in as 0 | Edit total users to equal the sum of state-funded residents and self-funders. | 0.2 |
| Total users = self-funders | Edit total users to equal the sum of state-funded residents and self-funders. | 1.2 |
| Total users = state-funded residents | Edit total users to equal the sum of state-funded residents and self-funders. | 1.2 |
| Trailing zeros | Remove trailing zeros (more than or equal to four zeros at the end of number), then edit total users to equal the sum of state-funded residents and self-funders. | 0 |
Download this table Table 2: Provider information return (PIR) errors and resulting editing steps
.xls .csvOnce all cleaning and editing steps have been completed our sample reduces from 6,630 care homes to 6,099 care homes (92.0% of the original sample). See Table 3 for a breakdown of each stage and the impact on the number of care homes kept and dropped from the sample.
| Cleaning step | Percentage of care homes dropped (%) | Percentage of care homes changed from previous step (%) | Number of care homes dropped | Number of care homes kept |
|---|---|---|---|---|
| Uncleaned sample | 0.0 | 0.0 | 0 | 6,630 |
| Merge with CQC Care directories | 0.4 | 0.0 | 28 | 6,602 |
| Remove care homes that have zero beds in the Care directory | 0.0 | 0.0 | 3 | 6,599 |
| Remove duplicated care homes | 0.0 | 0.0 | 0 | 6,599 |
| Edit obvious errors in total users | 0.0 | 2.6 | 0 | 6,599 |
| Remove care homes where sum of self- and state-funders is not within 10% of the total users | 3.8 | 0.0 | 251 | 6,348 |
| Remove care homes where the calculated occupancy exceeds 110% | 3.9 | 0.0 | 249 | 6,099 |
Download this table Table 3: Number of care homes kept, percentage of care homes edited and number and percentage of care homes dropped from sample after cleaning and editing steps
.xls .csvAfter cleaning the sample, we re-analysed the distributions of the care homes to ensure the cleaning was not disproportionately impacting care homes with certain characteristics (see Table 4). We can see from Table 4 that the differences between the distributions between the cleaned care homes and all other care homes in the Care directory overall remain minimal, and the weighting of the data (see Weighting the data) is designed to account for any differences between the sample and the population.
| Cleaned care homes that completed a PIR (N=6,099) | All other care homes (N=9,482) | Absolute percentage difference | |
|---|---|---|---|
| Percentage of care homes by region (%) | |||
| East Midlands | 9.8 | 10.0 | 0.2 |
| East of England | 11.6 | 10.3 | 1.3 |
| London | 8.6 | 9.3 | 0.7 |
| North East | 5.1 | 4.7 | 0.5 |
| North West | 11.8 | 12.8 | 0.9 |
| South East | 20.5 | 18.6 | 1.9 |
| South West | 13.2 | 13.1 | 0.1 |
| West Midlands | 10.3 | 11.3 | 1.1 |
| Yorkshire and The Humber | 9.1 | 9.9 | 0.8 |
| Percentage of care homes by latest quality rating (%) | |||
| Outstanding | 4.2 | 4.2 | 0.0 |
| Good | 80.0 | 76.4 | 3.6 |
| Requires improvement | 14.6 | 17.8 | 3.2 |
| Inadequate | 1.1 | 1.6 | 0.5 |
| Percentage of care homes by care home size (%) | |||
| 1 to 19 beds | 42.2 | 43.0 | 0.9 |
| 20 to 39 beds | 28.2 | 26.9 | 1.3 |
| 40 to 59 beds | 17.1 | 16.3 | 0.8 |
| 60 beds and over | 12.6 | 13.8 | 1.2 |
| Percentage of care homes by care home type (%) | |||
| Care homes for older people | 14.6 | 12.5 | 2.2 |
| Care homes providing dementia care | 46.8 | 49.0 | 2.2 |
| Care homes for younger adults | 12.6 | 13.4 | 0.9 |
| Other types of care homes | 26.0 | 25.1 | 0.9 |
Download this table Table 4: Distribution by English Region, care home size, care home rating and care home type for the cleaned provider information return (PIR) data and all other care homes in the May 2020 Care directory
.xls .csv6. Data linkage
To provide geographic care home characteristics of the distribution of self-funders we used the National Statistics Postcode Lookup File (NSPL) and the HM Land Registry UK House Price Index data.
National Statistics Postcode Lookup File
The National Statistics Postcode Lookup File (NSPL) relates current and terminated postcodes in the UK to a range of geographies and is released quarterly by the Office for National Statistics (ONS) Open Geography Portal. These data are open source and are subject to the Open Government Licence v.3.0 and contain Ordnance Survey data (Crown copyright and database right 2021), Royal Mail data (Royal Mail copyright and database right 2021) and National Statistics data (Crown copyright and database rights 2021). For this release, the August 2021 NSPL was used as this is the most recent postcode file available at time of analysis. For more information relating to the Postcode Look Up File please refer to the latest NSPL User Guide (August 2021).
Rural and urban Classification
The rural and urban classification of postcodes is based on the 2011 Rural-Urban classification of Output Areas (OA). OAs are treated as "urban" if most of their population live within settlements with a population of 10,000 or more. The remaining "rural" OAs are grouped into three other broad morphological types based on the predominant settlement component. The classification also categorises OAs based on context – that is, whether the wider surrounding area of a given OA is sparsely populated or less sparsely populated. For a full summary of the rural and urban classifications used in this publication, please refer to the latest NSPL User Guide (August).
Index of Multiple Deprivation
National deciles of area deprivation are created through ranking small geographical populations known as Lower layer Super Output Areas (LSOAs) based on their deprivation score from most to least deprived and grouping them into 10 divisions based on the subsequent ranking.
The Index of Multiple Deprivation (IMD) is a score based on the area as a whole, and not everyone within an LSOA necessarily experiences the same level or type of deprivation. For example, some unemployed individuals live in less deprived LSOAs, while some higher-income individuals live in more deprived LSOAs. Similarly, deciles are a broad grouping and the levels of deprivation and the underlying factors determining the LSOA-level deprivation score will vary within the decile. Those LSOAs at the higher and lower end of each specific decile may vary considerably from each other.
The IMD deciles reported here are based on the 2019 IMD for England, ranging from 1 (most deprived) to 10 (least deprived). The IMD deciles were linked onto the NSPL to determine the IMD for the area each care home is located at the time of the return.
Processing the National Statistics Postcode Lookup File
There are three different versions of the "postcode" variable included in the NSPL. In the analysis, the seven-character unit postcode variable is used as that is the version of postcode which most closely matches the Care directory and can be processed using cleaning steps (see the following). For more information on postcode levels please refer to the latest NSPL User Guide (August 2021).
Prior to completing the linkage we employed multiple processing steps. The NSPL is processed to extract and format the main variables to allow the data to be linked with other data sources. The following steps are applied to the data to prepare the postcode variable for linking:
Blank spaces are removed from the postcode column, for example, "NP10 8XG" would be converted to "NP108XG".
The characters in the postcode are capitalised, for example, "pO155rR" would be converted to "PO155RR".
For care providers with an "Unspecified" region or local authority in the Care directory, a manual check was carried out to confirm that the postcode in the Care directory was correct; where an error in the provider's postcode was identified, a new, correct postcode was manually added to the Care directory to replace the incorrect postcode.
Using the supporting documents in the NSPL, we replaced the codes in the raw comma-separated values (csv) file with the equivalent label before linking.
The region and local authority of each care home is obtained from the NSPL after linking to the provider information returns (PIR) and Care Quality Commission (CQC) Care directory. The reasons why we are using this data source to obtain geographical information (as opposed to the variables in the Care directory) are to:
label care homes that do not have a specified location in the Care directory with the correct region and local authority
allow comparisons to be made using the most up-to-date geographical boundaries at the time of the analysis and accounts for changes that have been implemented since the PIR return date; this follows agreed ONS practice when comparing geographies
The NSPL is then linked to the PIR and Care directory linked file by postcode. This means we can assign a region, local authority, Index of Multiple Deprivation and an Urban and Rural Classification label for each care home based on their location.
To provide context for our analysis of regions, we also calculated the average house price for a region based on the HM Land Registry UK House Price Index (UK HPI). The UK HPI is an administrative dataset that captures changes in the value of residential properties and uses sales data collected on residential housing transactions; for more information please refer to their UK HPI Quality and methodology. These data are open source and are subject to the Open Government Licence v.3.0 and contain HM Land Registry data (Crown copyright and database right 2021). Estimates for the most recent months are provisional and are likely to be updated as more data are incorporated into the index. However, our publication uses the most up-to-date data for the PIR data collection period (August 2019 to February 2020) that are available at the time of analysis (September 2021).
The most up-to-date Lower Tier Local Authority to Upper Tier Local Authority (UTLA) Lookup was also used so that the analysis could also include a breakdown of self-funders by UTLA. The most up-to-date lookup at the time of analysis was March 2021. The UTLA was determined through linkage with the lower tier local authority from the NSPL.
Nôl i'r tabl cynnwys7. Weighting the data
The provider information returns (PIR) collection was suspended in March 2020 because of the coronavirus (COVID-19) pandemic, therefore we have weighted the data to estimate the number of self-funders in England. This involves applying a weight to each unit on the dataset so that it represents a number of non-sampled care homes at England-level.
Care homes without a rating
As the PIR was sent to care homes on the anniversary month of their first inspection by the Care Quality Commission (CQC), the rating of each care home was unequally distributed when comparing the PIR responses and the Care directory. The care homes without a rating underwent separate processing prior to weighting:
manual validation: care providers without a rating were quality assured using the Care directory; where an equivalent rating could be found, the Care directory was manually updated for that particular care home with the new rating
Care directory rating distribution: care homes without a rating after the manual validation were randomly assigned a rating label based on the distribution of ratings of care homes in the Care directory
After this process, each care home had been assigned a rating, either through manual validation or based on the Care directory distributions. The analysis includes the proportion of self-funders in care homes by rating but cannot distinguish between care homes that have been given a rating and have not been given a rating as care providers with no rating were less likely to be sent a PIR and would have introduced a bias into the results.
Weighting method
The weighting for the PIR collection follows the standard weighting approach for Office for National Statistics (ONS) surveys. A design weight is first calculated as the inverse of the probability of selection, this is then calibrated to population totals (which will help adjust for non-response) to give a final weight.
The allocation of care homes to months (which care homes were sent a PIR in each month) was based on the order that they had first been inspected, which is dependent on a multitude of different factors (see Care Quality Commission provider information returns data) therefore the data have been assumed as a simple random sample. The weighting was done at a provider level with the design weight calculated as the inverse of the probability of selecting that provider. Since selection was at a care home level, the probability of selection was higher for larger providers, and so the resulting design weight was smaller. The weighting was integrated meaning that each care home run by a provider was given the same weight (and that same weight was also the weight for the provider).
The Care directory contains detailed information about the population, which therefore provides many options for the calibration weighting. Regression analysis of the main variable of interest using the available information as predictors indicated that several were highly significant. Using expert opinion and considering the impact these had on the weighting the following variables were used for the weighting:
region
care home type
CQC rating
number of beds (care home size)
For the purposes of weighting, number of beds was turned into a categorical variable. Please refer to the Care Quality Commission Care directory data section for detail on the Care Home Type variable was derived.
Using the R package "ReGenesees" written by Statistics Italy (Istat) (PDF, 422KB), the design weights were calibrated to the population totals for these variables. The resulting weights have low variance and are approximately normally distributed. Total counts and proportions with confidence intervals were created using the "svystatTM" and "svystatR" functions respectively in the "ReGenesees" package.
Nôl i'r tabl cynnwys8. Analysing the data
Once cleaned, linked and weighted the data can then be analysed. For this publication, we investigated the differences in the self-funding population by the following characteristics:
region of the care home (source: National Statistics Postcode Lookup File (NSPL) see Data linkage)
local authority of the care home (source: NSPL, see Data linkage)
care home rating (source: directly from Care directory, see Care Quality Commission Care directory data)
care home type (source: derived from Care directory, see Care Quality Commission Care directory data)
care home size (source: derived from Care directory, see Care Quality Commission Care directory data)
provider size (source: derived from Care directory, see Care Quality Commission Care directory data)
nursing care provision in care home (source: derived from Care directory, see Care Quality Commission Care directory data)
urban and rural indicator (source: NSPL, see Data linkage)
Index of Multiple Deprivation (source: NSPL, see Data linkage)
We performed two types of analysis using these variables.
1. Aggregating the total number of self-funders, state-funders and total users of care in care homes in England (estimate).
2. Calculating the percentage of self-funders in each individual group. For example, to calculate the percentage of self-funders in a region out of all users in that region we used the following equation:
- percentage of Self-funders in region = (Number of self-funders in care homes located in the specified region divided by Total number of individuals in care homes located in the specified region) multiplied by 100
We also calculated the percentage of residents who were self-funding and state-funded across four different care home types (derived from Care directory, see Care Quality Commission Care directory data). For example, to calculate the proportion of self-funders across different care home types:
- percentage of Self-funders across care home types = (Number of self-funders in specified care home type divided by Total number of self-funders in population) multiplied by 100
9. Strengths and limitations of the data
The main strengths of our analysis to estimate the size of the self-funding population in care homes in England include:
this analysis fills a significant evidence gap to understand the social care system as a whole, as there are very limited data sources relating to funding in care homes at a care provider level; the aggregated figures can be used as a "baseline estimation"
validation steps have been applied after the collection period to remove responses that have been identified as containing errors and inaccuracies
robust weighting strategies are adopted to produce an England-level estimation and limit the impact of bias
data linkage has enabled us to understand more about the link between care home characteristics and the presence of self-funders within them
this is impactful work that can be used by government departments, public sector organisations, care providers and the public to better understand the size of the self-funding population in care homes
this is the first step in a programme of work being undertaken at the Office for National Statistics (ONS) to investigate this under-researched population
The main limitations of the data are:
the current release focuses only on the characteristics of care homes in relation to the self-funding population; it will also be important to understand the characteristics of individuals who self-fund their care (see Future developments)
at present we are not able to present equivalent estimates for community care; however, we recognise that understanding this is important for a fuller picture of the self-funding population and social care as a whole (see Future developments)
the errors in the data (see Data cleaning and Weighting the data) mean some of the sample is lost because of cleaning
10. Future developments
Following the suspension of the provider information return (PIR) in March 2020 the collection has since been restarted. The PIR will continue to select care providers based on the first inspection date. By March 2022 a census of care providers will have been undertaken, however, there is a small number of care homes that would be missed if they were registered during the data collection period. Therefore, once a full year has been collected, it is possible for us to repeat and improve our analysis with a full and updated sample.
Community care
Understanding the size and characteristics of the population that privately fund their community care is a significant data gap. We aim to gain more insight into the PIR data from community care providers that are registered with the Care Quality Commission (CQC). This may only cover a proportion of self-funders in the community, because not all community care providers are registered with CQC.
Individual characteristics of self-funders
With future iterations of the publication, we aim to use census data and more administrative data to gain insight into the individual characteristics of people who self-fund their care such as sex and age. We are interested in investigating the following characteristics and data sources in the future:
whether the individual is a homeowner (Census 2011 data)
whether an individual has a partner (Census 2011 data)
whether an individual's partner is still alive (death registrations data)
whether the individual is still alive (death registrations data)
age (Census 2011 data)
sex (Census 2011 data)
disability status (Census 2011 data)
previous employment (Census 2011 data)
educational attainment (Census 2011 data)
When available, future iterations will be able to link the PIR data to the more up-to-date Census completed in 2021.
We will also research any influence that owner-occupation rates could have on the self-funding population.
For more detail on our future plans for the self-funders work please refer to our blog release.
This is the first publication the Office for National Statistics (ONS) has released on the self-funding population and a public feedback survey was launched on the date of publication to invite feedback from potential users to help with the development of this work.
Nôl i'r tabl cynnwys11. Glossary
Self-funder
The provider information return (PIR) defines a self-funder as an individual who pays for their own care privately, this can be:
organised by themselves or through the local authority: this is where an individual is over the saving and/or income threshold and therefore organises their care themselves or requests the local authority to arrange their care for them, but the individual still funds the full cost
provided by a charity: individuals who receive care in a charity-run care home are also defined as self-funders, as the term charity refers to the organisation running the care home, but individuals who do not meet the eligibility criteria for state-funding will still be self-funding
NHS-funded nursing care: if an individual is in receipt of NHS-funded nursing care in a care home, they will have an amount paid for by the NHS, deemed to be the cost of the nursing care they receive; however, the rest of the cost could be self-funding, depending on their financial situation, therefore have been included in this definition
it is important to note that not all individuals in receipt of NHS-funded nursing care will be self-funding, they could also be in receipt of local authority support; NHS-funded nursing care should not be used to directly measure the size of the self-funding population
State-funded
The PIR defines a state-funder as an individual whose care is funded in full or in part by the local authority and/or NHS, this includes:
paying user charges when funded by local authority: this is where the local authority has assessed an individual as having care and support needs and the individual has savings and/or income below the required savings and/or income threshold and is funded by a local authority; however, the individual may pay additional cost to the local authority (a user charge)
NHS continuing healthcare: this is where an individual's needs have primarily been deemed as health-based, as per the decision support tool, and therefore care is fully funded by the NHS (state)
personal budget: this is where an individual has been assessed via the local authority as having care and support needs and has savings or income below the threshold, so is given a budget to arrange care themselves, for example, through a personal assistant; however, care is still funded through the local authority
third-party top up: this is where an individual has been assessed via the local authority as having care and support needs and has savings or income below the threshold, therefore is state funded; however, their care may be more expensive than the local authority is willing to pay, so a third party pays an additional cost (this is not categorised as a self-funder, as this cannot be paid for by the individual)