1. Main points
In 2010 to 2012, newborn males and females in the UK could expect to live 78.8 years and 82.6 years respectively.
If they experienced the same health status rates as observed between 2010 and 2012, newborn males could expect to live 63.2 years (or 80.3% of their lives) in “Very good or good” health. Females could expect to live 64.6 years (or 78.2% of their lives) in “Very good or good” health.
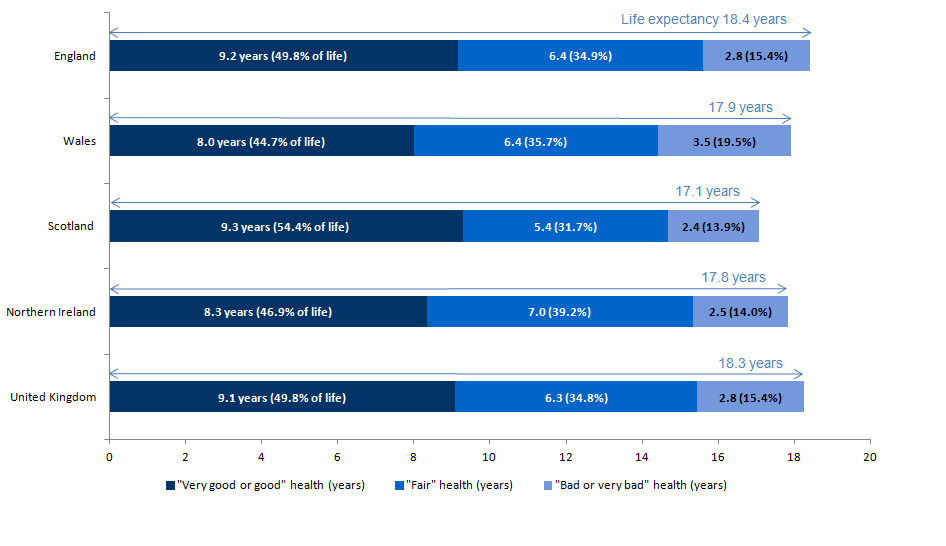
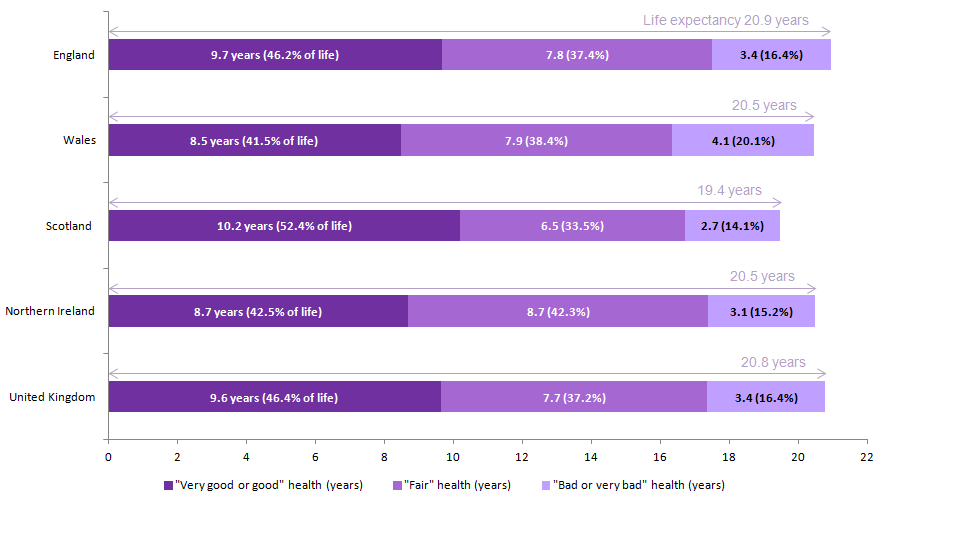
If surviving to age 65, men and women could expect to live a further 18.3 years and 20.8 years respectively, of which around half would be in “Very good or good” health (9.1 years and 9.6 years respectively).
Of the constituent countries, England had the largest within-country inequality regarding remaining years spent in “Very good or good” health at birth and at age 65 and Northern Ireland had the smallest.
Men and women at age 65 in Scotland could expect to live the longest in “Very good or good” health (9.3 years and 10.2 years respectively) even though their life expectancies were the shortest (76.5 years and 80.7 years respectively).
Men and women at age 65 in Wales could expect to live the smallest proportions in “Very good or good” health at 44.7% and 41.5% respectively; they could expect to spend the highest proportions in “Bad or very bad” health (19.5% and 20.1% respectively).
In Northern Ireland, men and women at age 65 could expect to spend the largest proportions in “Fair” health at 39.2% and 42.3% respectively.
Across the local areas in the UK, the lowest number of years individuals could expect to live in “Very good or good” health at birth stood at 55.8 years for males in Manchester and 55.9 years for females in Tower Hamlets; both in England.
At age 65, the lowest number of years individuals could expect to live in “Very good or good” health in the UK was in Blaenau Gwent for men at 5.5 years and Merthyr Tydfil for women at 5.9 years; both in Wales.
Nôl i'r tabl cynnwys2. Statistician’s quote
“There is large variation in how many years people can expect to live in good health across the UK. Differences in education, employment opportunities, lifestyle behaviours, social mobility and the wider local environment all have a major impact with males and females in some parts of the UK living 14.1 years and 15.0 years longer in “Very good or good” health than others.”
Jodie Withers, Health Analysis and Life Events, Office for National Statistics
Nôl i'r tabl cynnwys3. Things you need to know
As life expectancy (LE) is increasing in the UK, health expectancies can add a quality of life dimension by estimating how much lifetime can be expected to be spent in “Very good or good” health or free from a limiting long-term illness or disability. Both health expectancies are high-level summary measures of population health and are important indicators of the well-being of society, providing context to the impact of policy changes and interventions at both national and local levels. Health expectancies are used across public, private and voluntary sectors, in the assessment of healthy ageing, fitness for work, monitoring health improvement, fairness in extension to the State Pension age (SPa), future pension provision and health and social care need.
For the purpose of this analysis, 2011 Census health and disability prevalence have been used so that comparable and consistent health expectancy data could be produced for the UK, its 4 constituent countries and their sub-national populations. The census would also provide more robust analysis due to its large coverage. The household surveys used by the individual constituent countries to calculate health expectancies are not comparable. For example, we have previously published figures on healthy life expectancy (expected years in “Very good or good” health) and disability-free life expectancy (expected years without a limiting long-term illness or disability) by upper tier local authorities in England, with the most recent time period being 2012 to 2014 using health and disability prevalence from the Annual Population Survey (APS).
It is worth noting that the estimates in this analysis are not comparable with previously published 2010 to 2012 estimates because of differences in sources and methodology, some of which are explained in the rest of this section with further detail in the Methods section. Further information on official health expectancies for the other constituent countries can be found on Public Health Wales, The Scottish Public Health Observatory and Department of Health, Social Services and Public Safety for Northern Ireland.
In this analysis, figures are presented for the period 2010 to 2012 centred on a single year of data for self-assessed health and disability prevalence from the 2011 Census and 3 years of aggregated mid-year population and deaths registration estimates. Estimates measure the average years spent in each health state. This analysis will examine expected years in “Very good or good” health, “Fair” health and “Bad or very bad” health at birth and at age 65 by sex for the UK, its 4 constituent countries and their sub-national areas.
Usually, expected years in “Very good or good” health correspond to healthy life expectancy (HLE) as used in our previous publications and “Fair” health is aggregated with “Bad and very bad” health and referred to as “Not good” health. For this analysis we have separated out “Fair” health which is justified by the link between usual residents reporting “Fair” health and the prevalence of limiting long-term illness or disability, which differs markedly, both from those reporting their general health as “Very good” or “Good” and those reporting their general health as “Bad” or “Very bad”. For example, it was found in the 2011 Census for England and Wales that around 61.5% of the population who reported their general health as “Fair” were restricted by day-to-day activities, either a lot or a little, while being restricted in daily activities is rare among those reporting their general health as “Very good or good” (see Annex A). Therefore, there is an argument for calculating a distinct LE spent in “Fair” general health, which is why we have conducted this for policy colleagues in the Department for Work and Pensions (DWP). Although there is no commentary, all corresponding data for activity limitation life expectancy (“Day-to-day activities not limited”, “Day-to-day activities limited a little” and “Day-to-day activities limited a lot”) and by national deciles of area deprivation can be found in the data section accompanying this analysis.
The age-band structure used in this analysis was changed to one with a final age band of aged 90 and over, as opposed to the previous convention of closing it at aged 85 and over for sub-national analyses. This is a new age-band structure; for our previous HLE publications the age-band structure was closed at 85 and over. The main justification for moving to a final age band of aged 90 and over is because people in the UK are living longer. There is growing evidence to suggest that improvements in LE leading to a greater number of people living to aged 85 and over is causing LE to be misrepresented using such a broad upper age interval. It has been shown that partitioning the life table age-band structure into age 85 to 89 and 90 and over improves the validity of LE estimates and thereby health expectancies. We will be releasing a paper in the near future which looks at changes to the age 90 and over age band.
Further information is available in the Background, What are health expectancies? and Methods sections.
Nôl i'r tabl cynnwys4. General health state life expectancies at birth in the UK
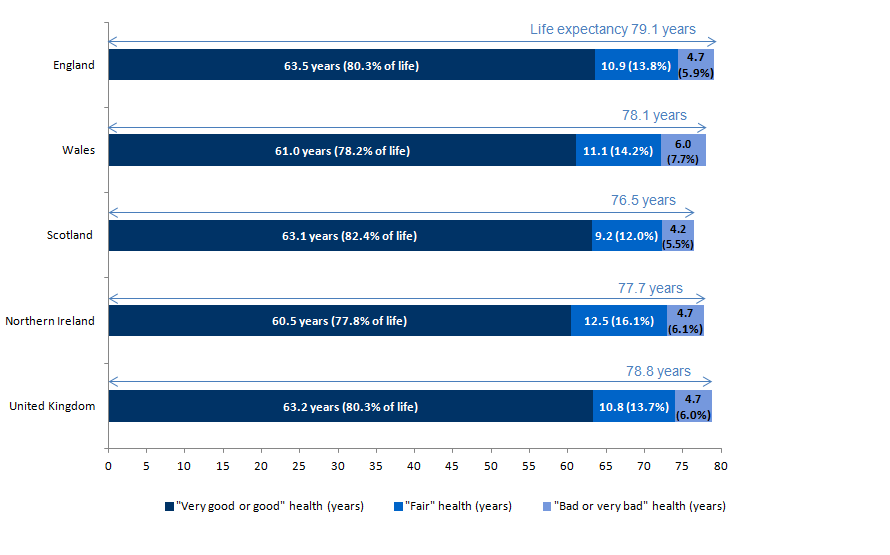
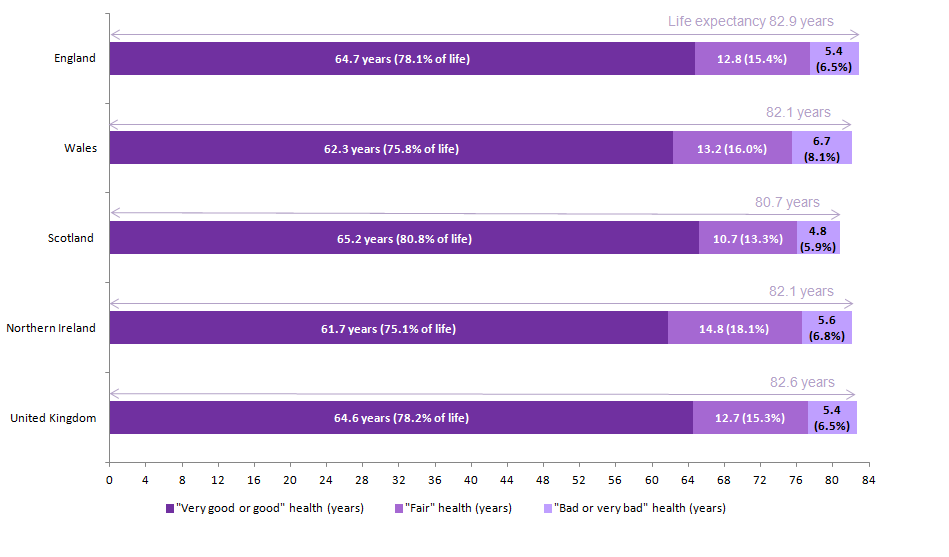
For the UK as a whole, on the basis of mortality and health status rates in 2010 to 2012, males at birth could expect to live for 78.8 years, of which they could expect to spend 63.2 years or 80.3% of their lives in “Very good or good” health. Females could expect to live 82.6 years, of which they could expect to spend 64.6 years or 78.2% of their lives in “Very good or good” health. The gender gap between the number of years males and females could expect to spend in “Very good or good” health was narrower at 1.3 years compared with life expectancy (LE) at 3.8 years (see Figures 1 and 2). Males and females could expect to spend more than twice the number of years in “Fair” health compared with “Bad or very bad”. As females have a longer life expectancy, they could also expect to spend more years in “Fair” health and “Bad or very bad” health compared with males.
Across the constituent countries of the UK between 2010 and 2012, LE was higher in England than Scotland for both males and females. The gap between England and Scotland was 2.6 years for males (79.1 years and 76.5 years respectively) and 2.1 years for females (82.9 years and 80.7 years respectively).
Males in England could expect to live the longest in “Very good or good” health at 63.5 years, which was 3.0 years higher than Northern Ireland (60.5 years), which was the lowest. Interestingly, although females in Scotland had the lowest LE, they could expect to live the longest in “Very good or good” health at 65.2 years, 0.7 years higher than the UK average. This was 3.5 years higher than Northern Ireland, which also had the lowest for females at 61.7 years. For Wales, males and females could expect to live slightly longer in “Very good or good” health than Northern Ireland, but were also lower than the UK average.
The largest difference between males and females within a constituent country who could expect to live in “Very good or good” health was in Scotland with a gap of 2.1 years (63.1 years and 65.2 years respectively). The smallest difference was in Wales (61.0 years for males and 62.3 years females) and Northern Ireland (60.5 years for males and 61.7 years for females), with a gap of 1.2 years. For the remainder of life, the years spent in “Fair” health was around twice that spent in “Bad or very bad” health, but this varied across the constituent countries. Males and females in Northern Ireland reported the highest number of years in “Fair” health (12.5 years and 14.8 years respectively), which may explain why they have the lowest number of years spent in “Very good or good” health.
In the UK as a whole, males could expect to spend around four-fifths (80.3%) of their lives in “Very good or good” health and females could expect to spend around three-quarters (78.2%). Across the 4 constituent countries, males could expect to spend higher proportions than females in “Very good or good” health. Males and females at birth in Scotland could expect to live the largest proportion of their lives in “Very good or good” health at 82.4% and 80.8% respectively, even though they have the shortest life expectancies. As a result, they could expect to live the smallest proportions in “Fair” and “Bad or very bad” health.
In contrast, males and females in Northern Ireland could expect to spend the smallest proportions of their lives in “Very good or good” health at 77.8% and 75.1% respectively; they could expect to spend the highest proportions in “Fair” health (16.1% and 18.1% respectively). In Wales, males and females could expect to spend the highest proportions in “Bad or very bad” health (7.7% and 8.1% respectively) in comparison to the other constituent countries.
Figure 1. General health state life expectancy for males at birth, 2010 to 2012
Source: Office for National Statistics; National Records Scotland; Northern Ireland Statistics and Research Agency
Notes:
Includes all usual residents enumerated on the day of the 2011 Census in England. For the 2011 Census purposes, a usual resident of the UK is anyone who, on 27 March 2011, was in the UK and had stayed or intended to stay in the UK for a period of 12 months or more, or had a permanent UK address and was outside the UK and intended to be outside the UK for less than 12 months.
Figures may not sum due to rounding.
Download this image Figure 1. General health state life expectancy for males at birth, 2010 to 2012
.png (31.2 kB) .xls (64.0 kB)
Figure 2. General health state life expectancy for females at birth, 2010 to 2012
Source: Office for National Statistics; National Records Scotland; Northern Ireland Statistics and Research Agency
Notes:
Includes all usual residents enumerated on the day of the 2011 Census in England. For the 2011 Census purposes, a usual resident of the UK is anyone who, on 27 March 2011, was in the UK and had stayed or intended to stay in the UK for a period of 12 months or more, or had a permanent UK address and was outside the UK and intended to be outside the UK for less than 12 months.
Figures may not sum due to rounding.
Download this image Figure 2. General health state life expectancy for females at birth, 2010 to 2012
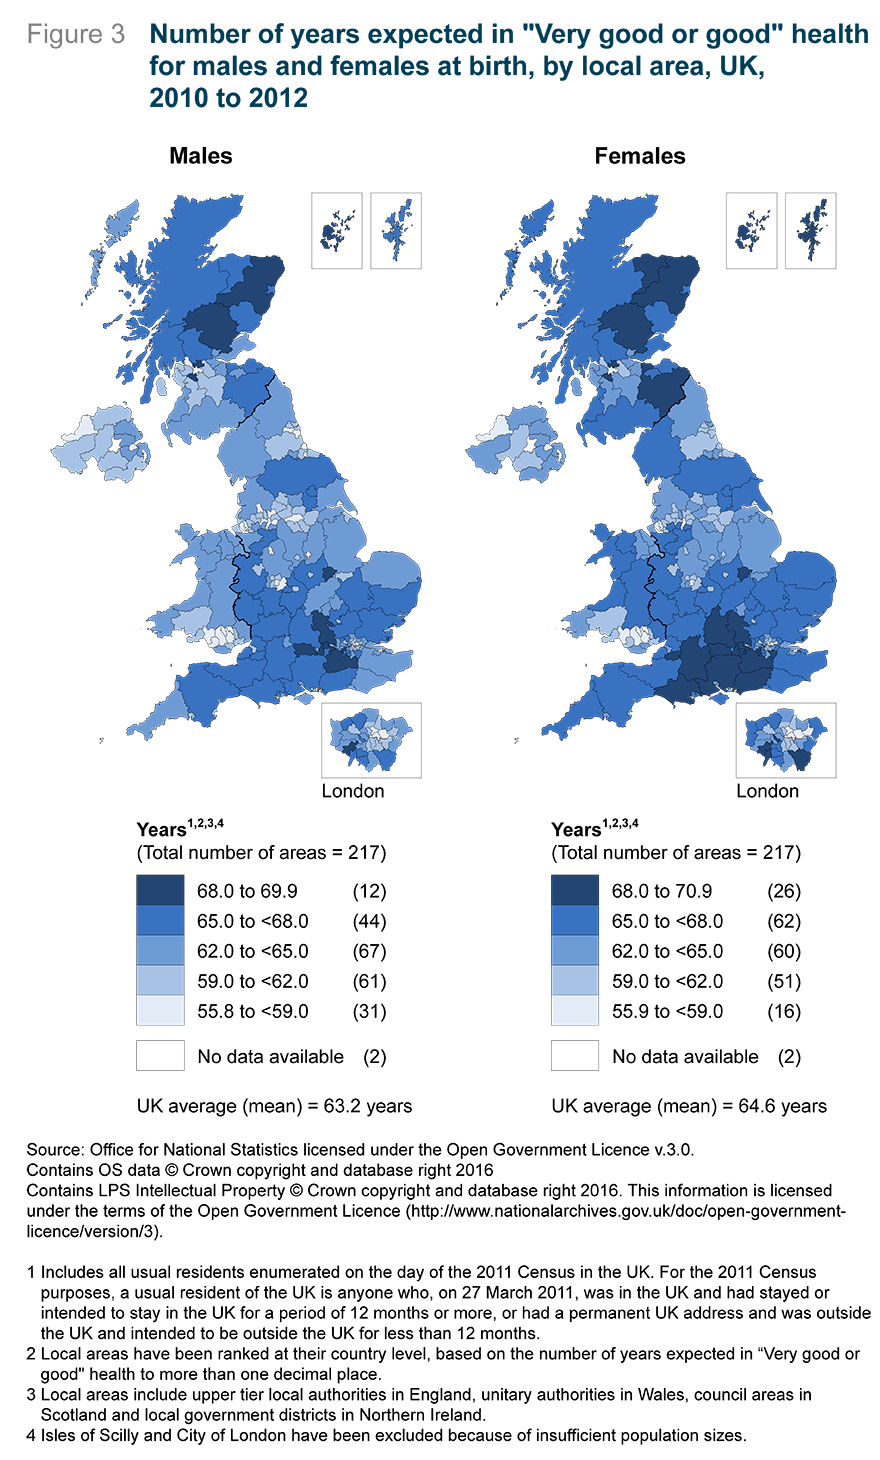
.png (32.4 kB) .xls (63.5 kB)Figure 3 illustrates the number of years from birth that males and females could expect to spend in “Very good or good” health by local areas in the UK. The figure shows that across the majority of local areas, females could expect to spend a larger number of years in “Very good or good” health. The largest overall gender gap was 3.9 years in Inverclyde in Scotland, where females could expect to live 63.3 years in “Very good or good” health compared with 59.4 years for males. For LE, females could expect to live longer than males across all local areas with the smallest gap in the Orkney Islands in Scotland, where females could expect to live 2.4 years longer (81.8 years compared with 79.5 years). The largest gap was in Inverclyde in Scotland, where females could expect to live 79.9 years and males could expect to live 73.7 years; a gap of 6.3 years.
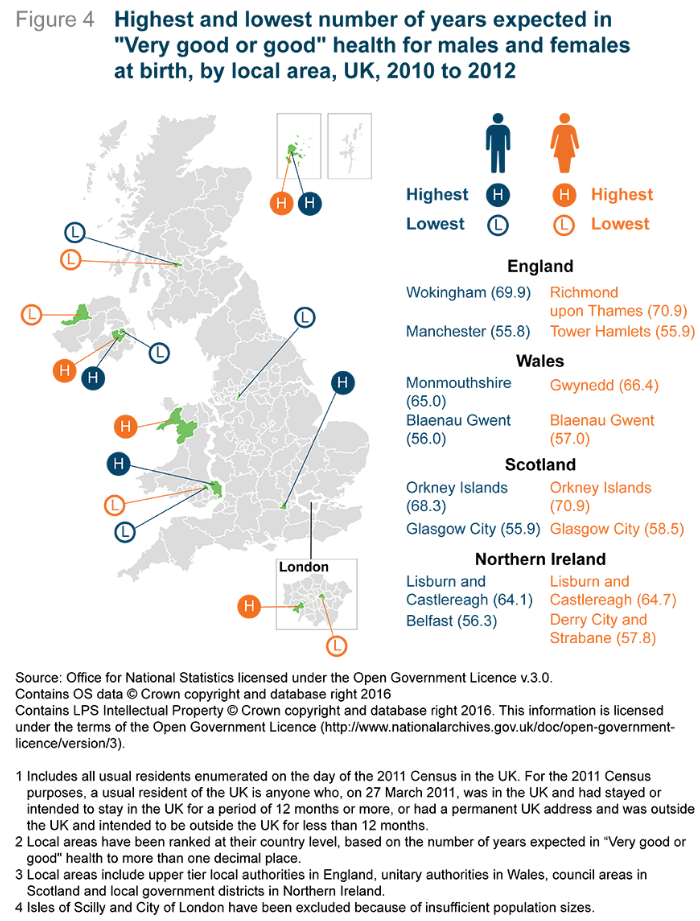
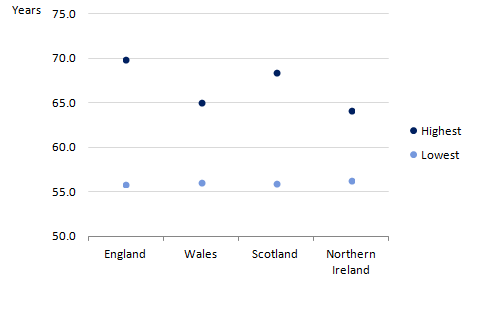
Figure 4 illustrates the local areas in each country where males and females at birth could expect to live the highest and lowest number of years in “Very good or good” health. Males in Wokingham could expect to live the longest in “Very good or good” health at 69.9 years (or 85.8% of their lives), whereas males in Manchester could expect to live the lowest at 55.8 years (or 74.6% of their lives); a gap of 14.1 years. The gap between LE was narrower at 6.7 years. Interestingly, the gap in years spent in “Very good or good” health between Wokingham and Manchester was the widest in the UK as a whole for males.
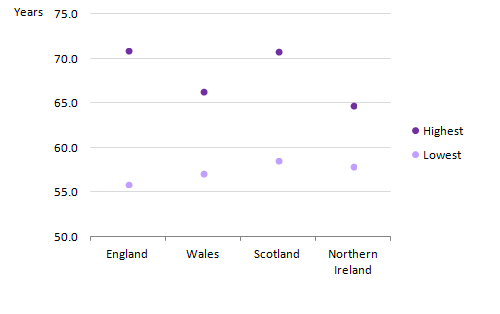
For females, the largest inequality was between 2 local areas in the region of London. Females in Richmond upon Thames could expect to live the longest in “Very good or good” health at 70.9 years (or 82.9% of their lives), which was 15.0 years longer than Tower Hamlets at 55.9 years (or 68.4% of their lives). The gap between LE was much narrower at 3.8 years. The gap between these local areas was the widest across the whole of the UK for females.
In Wales, the gap for males was 9.0 years between Blaenau Gwent and Monmouthshire at 56.0 years and 65.0 respectively (74.0% and 81.3% of their lives). Males in Monmouthshire could also expect to live 4.3 years longer than those in Blaenau Gwent. For females, the lowest number of years expected to be spent in “Very good or good” health was also for Blaenau Gwent at 57.0 years (or 71.4% of their lives), which was 9.3 years less than Gwynedd at 66.4 years (or 80.1% of their lives). Females in Gwynedd could also expect to live 3.0 years longer than those in Blaenau Gwent.
In Scotland, the largest inequality for males and females at birth was between Glasgow City and the Orkney Islands. Males in the Orkney Islands could expect to live the longest in “Very good or good” health at 68.3 years (86.0% of their lives) compared with Glasgow City at 55.9 years (77.0% of their lives); a gap of 12.4 years. This gap was almost twice as wide as life expectancy, where the gap between these 2 Scottish Councils was 6.9 years. Females in the Orkney Islands could expect to live the longest in “Very good or good” health at 70.9 years (86.6% of their lives) compared with Glasgow City at 58.5 years (74.5% of their lives) ; a gap of 12.5 years. The gap was more than 3 times wider compared with LE, where the gap was 3.4 years.
The largest inequality for males at birth in the number of years spent in “Very good or good” health was a difference of 7.8 years between Belfast and Lisburn and Castlereagh at 56.3 years and 64.1 years respectively (74.6% and 81.1% of their lives respectively). Males in Lisburn and Castlereagh could also expect to live 3.6 years longer. For females, the largest inequality was 6.9 years where those in Derry City and Strabane could expect to live 57.8 years (71.4% of their lives) in “Very good or good” health and females in Lisburn and Castlereagh could expect to live 64.7 years (78.3% of their lives) in “Very good or good” health; a difference of 6.9 years. The LE difference between these 2 local government districts was much smaller at 1.7 years. The inequality between local government districts within Northern Ireland was less than half the inequality experienced in England.
Across all of the local areas in the UK, females could expect to live longer than males and in the majority of local areas, spend more years in “Very good or good” health. The largest gender gap between local areas in the UK regarding LE and years spent in “Very good or good health” was in Inverclyde, Scotland. Females could expect to live 6.3 years longer and 3.9 years longer in “Very good or good” health compared with males. There were only 6 local areas in the UK, which were all based in England (5 were in London and 1 in the South East), where males could expect to spend more years in “Very good or good” health compared with females.
Figures 5 and 6 further illustrates the gap between the highest and lowest local areas within each country regarding years expected in “Very good or good” health. For both males and females at birth, England had the largest within-country inequality between local areas and was followed closely by Scotland. This gap was the largest compared with the other constituent countries, followed closely by Scotland. Northern Ireland had the smallest within-country inequality between local areas for both males and females. The lowest number of years expected in “Very good or good” health appears similar across the constituent countries for both males and females. However, the highest number of years demonstrates variation with a split between England and Scotland and Wales and Northern Ireland. This could be because England and Scotland encompass more diverse populations compared with Wales and Northern Ireland, for example, in terms of deprivation.
Figure 5. Highest and lowest number of years expected in "Very good or good" health for males at birth by country, 2010 to 2012
Source: Office for National Statistics; National Records Scotland; Northern Ireland Statistics and Research Agency
Notes:
Includes all usual residents enumerated on the day of the 2011 Census in England. For the 2011 Census purposes, a usual resident of the UK is anyone who, on 27 March 2011, was in the UK and had stayed or intended to stay in the UK for a period of 12 months or more, or had a permanent UK address and was outside the UK and intended to be outside the UK for less than 12 months.
Local areas have been ranked at their country level, based on the number of years expected in "Very good or good" health to more than one decimal place.
Local areas include upper tier local authorities in England, unitary authorities in Wales, council areas in Scotland and local government districts in Northern Ireland.
Isles of Scilly and City of London have been excluded because of insufficient population sizes.
Download this image Figure 5. Highest and lowest number of years expected in "Very good or good" health for males at birth by country, 2010 to 2012
.png (6.9 kB) .xls (40.4 kB)
Figure 6. Highest and lowest number of years expected in "Very good or good" health for females at birth by country, 2010 to 2012
Source: Office for National Statistics; National Records Scotland; Northern Ireland Statistics and Research Agency
Notes:
Includes all usual residents enumerated on the day of the 2011 Census in England. For the 2011 Census purposes, a usual resident of the UK is anyone who, on 27 March 2011, was in the UK and had stayed or intended to stay in the UK for a period of 12 months or more, or had a permanent UK address and was outside the UK and intended to be outside the UK for less than 12 months.
Local areas have been ranked at their country level, based on the number of years expected in "Very good or good" health to more than one decimal place.
Local areas include upper tier local authorities in England, unitary authorities in Wales, council areas in Scotland and local government districts in Northern Ireland.
Isles of Scilly and City of London have been excluded because of insufficient population sizes.
Download this image Figure 6. Highest and lowest number of years expected in "Very good or good" health for females at birth by country, 2010 to 2012
.png (6.7 kB) .xls (39.9 kB)Although females tend to live longer and can expect to spend more years in “Very good or good” health, males generally expect to live a larger proportion of their lives in “Very good or good” health. This is because the gap between life expectancy and number of years spent in “Very good or good” health are narrower compared with females. Overall, the inequality regarding number of years spent in “Very good or good” health was much larger compared with LE for both males and females.
Nôl i'r tabl cynnwys5. General health state life expectancies at age 65 in the UK
General health state life expectancy (LE) at age 65 gives an indication of how long men and women, at the point of retirement age, could expect to live their remaining years in “Very good or good” health. This information is important as it indicates the feasibility of extending working lives up to the new State Pension age (SPa) already legislated for and further extensions.
In the UK, on the basis of mortality and health status rates in 2010 to 2012, women at age 65 could expect to live longer than men with a gap of 2.5 years (20.8 years and 18.3 years respectively). However, because women can expect to live longer, they can also expect to live longer in “Fair” health and “Bad or very bad” health than men (see Figures 5 and 6).
Men at age 65 in the UK could expect to live a further 9.1 years in “Very good or good” health, equivalent to 49.8% of their remaining lives. Women on the other hand, could expect to live a further 9.6 years in “Very good or good” health, equivalent to 46.4% of their remaining lives.
Men and women at age 65 in Scotland could expect to live the longest in “Very good or good” health at 9.3 years and 10.2 years respectively, which is 1.3 and 1.7 years longer than in Wales, which had the lowest at 8.0 years and 8.5 years.
Generally, men at age 65 could expect to spend higher proportions of life in “Very good or good” health compared with women across the 4 constituent countries if in the future they experienced the same mortality and health status rates experienced between 2010 and 2012.
As found at birth, men and women at age 65 in Scotland could expect to live the largest proportion of their LE in “Very good or good” health at 54.4% and 52.4% respectively, even though they have the shortest life expectancies. On the other hand, men and women at age 65 in England, Wales and Northern Ireland could expect to spend less than half their remaining lives in “Very good or good” health.
Men and women in Wales could expect to spend the smallest proportions of their remaining lives in “Very good or good” health at 44.7% and 41.5% respectively; they could also expect to spend one-fifth in “Bad or very bad” health (19.5% and 20.1% respectively).
Men and women in Northern Ireland could expect to spend the largest proportion of their remaining lives in “Fair” health (39.2% and 42.3% respectively). For women in Northern Ireland, the amount of years they could expect to spend in “Very good or good” health and “Fair” health amounted to the same at 8.7 years.
Figure 7. General health state life expectancy for men at age 65, 2010 to 2012
Source: Office for National Statistics; National Records Scotland; Northern Ireland Statistics and Research Agency
Notes:
Includes all usual residents enumerated on the day of the 2011 Census in England. For the 2011 Census purposes, a usual resident of the UK is anyone who, on 27 March 2011, was in the UK and had stayed or intended to stay in the UK for a period of 12 months or more, or had a permanent UK address and was outside the UK and intended to be outside the UK for less than 12 months.
Figures may not sum due to rounding.
Download this image Figure 7. General health state life expectancy for men at age 65, 2010 to 2012
.png (30.9 kB) .xls (61.4 kB)
Figure 8. General health state life expectancy for women at age 65, 2010 to 2012
Source: Office for National Statistics; National Records Scotland; Northern Ireland Statistics and Research Agency
Notes:
Includes all usual residents enumerated on the day of the 2011 Census in England. For the 2011 Census purposes, a usual resident of the UK is anyone who, on 27 March 2011, was in the UK and had stayed or intended to stay in the UK for a period of 12 months or more, or had a permanent UK address and was outside the UK and intended to be outside the UK for less than 12 months.
Figures may not sum due to rounding.
Download this image Figure 8. General health state life expectancy for women at age 65, 2010 to 2012
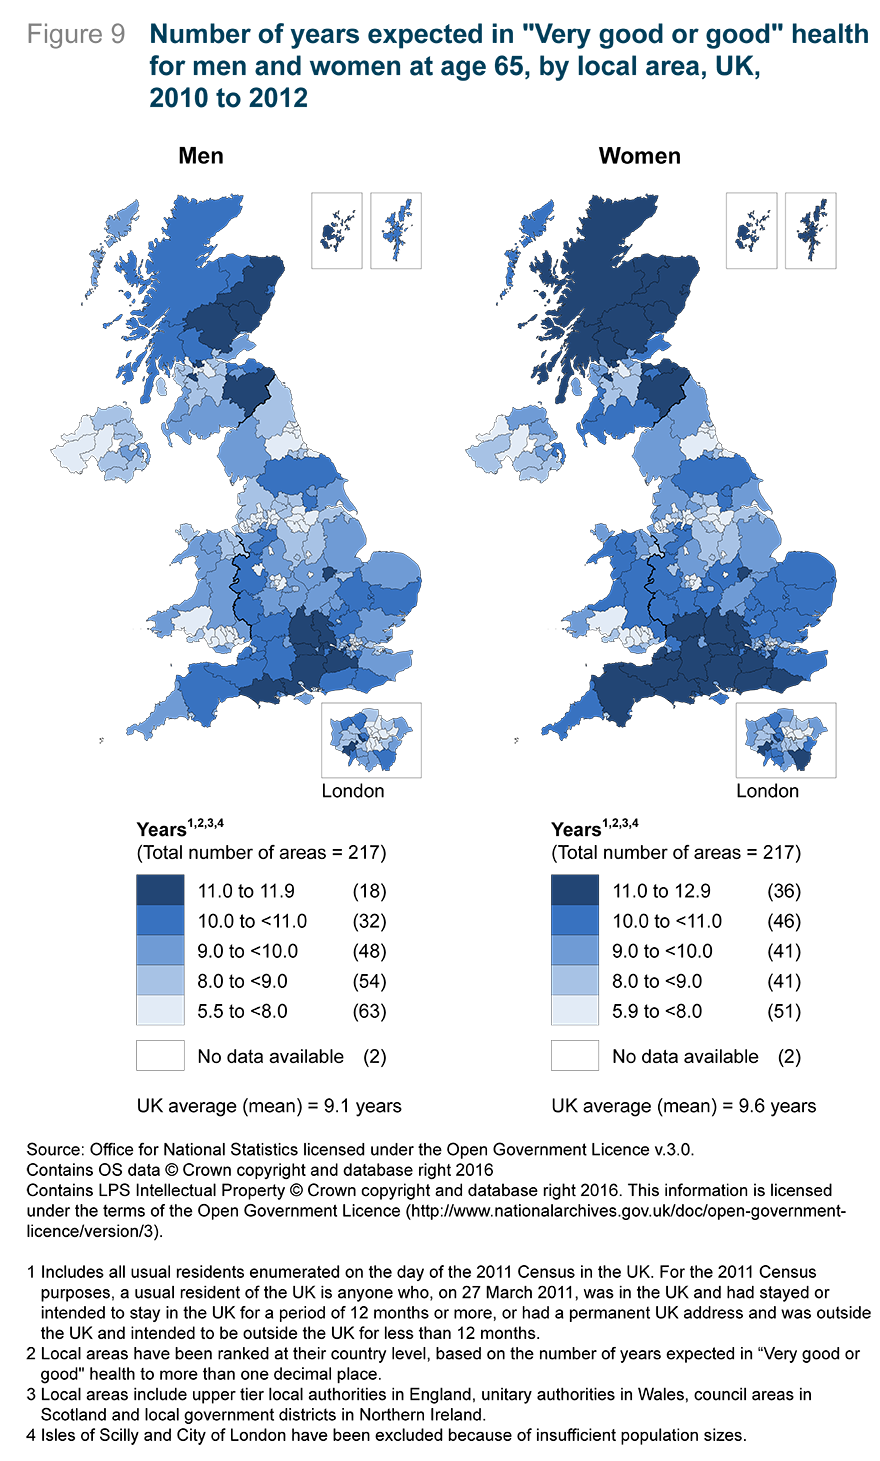
.png (30.5 kB) .xls (52.2 kB)Figure 9 illustrates the number of years that men and women at age 65 could expect to spend in “Very good or good” health by local areas in the UK. The figure shows that across the majority of local areas, women could expect to spend longer in “Very good or good” health compared with men. The largest gap in years spent in “Very good or good” health was in Na h-Eileanan Siar, Scotland, where women could expect to live 1.5 years longer in “Very good or good” health compared with men.
There were 4 local areas in England where men could expect to live longer than women in “Very good or good” health; 3 were in London and 1 was in the East Midlands. For LE, women could expect to live longer than men across all local areas in the UK with the largest gap in Na h-Eileanan Siar at 3.9 years and the smallest gap in the Orkney Islands at 0.9 years, both situated in Scotland.
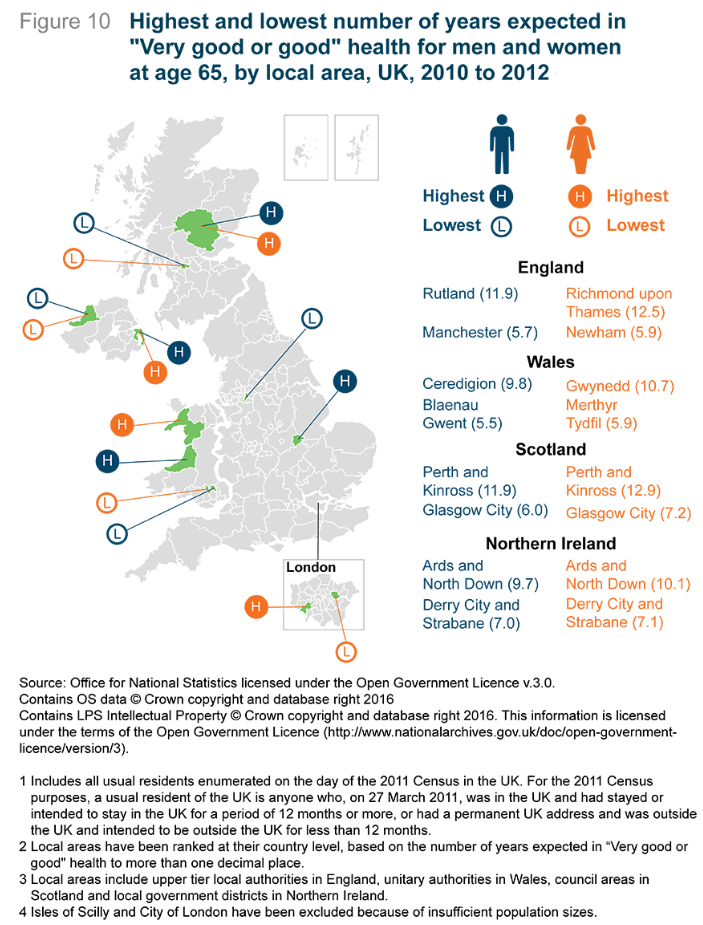
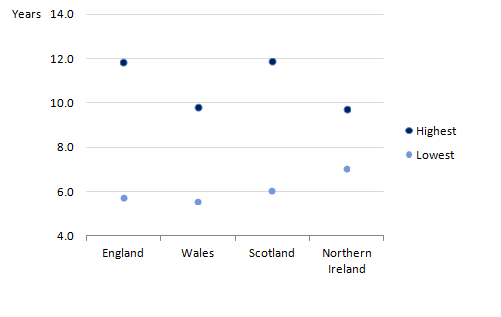
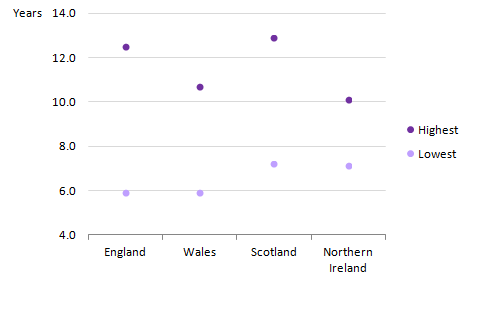
Figure 10 illustrates the local areas in each country where men and women at age 65 could expect to live the highest and lowest number of years in “Very good or good” health. For England, in Rutland, men at age 65 could expect to spend 11.9 years in “Very good or good” health (59.6% of their lives), which was 6.2 years longer and more than double the number of years compared with men in Manchester at 5.7 years (36.4% of their lives). Men in Rutland could also expect to live 4.2 years longer. For women, those in Richmond upon Thames could expect to live a further 6.6 years longer in “Very good or good” health compared with Newham, again this was more than double at 12.5 years (54.4% of their lives) compared with 5.9 years (28.4% of their lives). The life expectancy gap was much smaller at 2.3 years.
In Wales, men in Ceredigion could expect to live a further 9.8 years (or 51.1% of their remaining lives) in “Very good or good” health, which was 4.3 years longer than for men in Blaenau Gwent at 5.5 years (or 33.8% of their remaining lives). The gap between life expectancy was smaller at 2.8 years. For women at age 65, the inequality was larger at 4.8 years between Gwynedd and Merthyr Tydfil at 10.7 years and 5.9 years respectively (50.3% and 30.5% of their lives), with a life expectancy gap of 2.0 years. Overall, Blaenau Gwent and Merthyr Tydfil could expect to live the smallest number of years in “Very good or good” health across all local areas within the UK.
In Scotland, life expectancy spent in “Very good or good” health for men and women was highest in Perth and Kinross (11.9 years and 12.9 years respectively), which were also the overall highest within the UK; it was lowest in Glasgow City (6.0 years and 7.2 years respectively). Consequently, the gaps between council areas amounted to 5.8 years for men and 5.7 years for women. Men at age 65 in Perth and Kinross could expect to spend 64.0% of their remaining lives in “Very good or good” health while for women it was 61.9%; in Glasgow City it was 40.5% for men and 39.4% for women. The life expectancy gaps between council areas were smaller, 3.7 years for men and 2.6 years for women.
The largest inequality for men and women at age 65 was between Ards and North Down and Derry City and Strabane, Northern Ireland. Men in Ards and North Down could expect to live 9.7 years in “Very good or good” health (53.3% of their remaining lives) compared with Derry City and Strabane at 7.0 years (39.8% of their remaining lives); amounting to a 2.7 year gap. Women in Ards and North Down could expect to live 10.1 years in “Very good or good” health (48.8% of their remaining lives) compared with Derry City and Strabane at 7.1 years (35.6% of their remaining lives); amounting to a 3.0 year gap. The life expectancy gaps between local areas were much narrower compared with other constituent countries at 0.6 and 0.7 years.
Unlike at birth, the widest inequality in the UK for men and women at age 65 regarding years spent in “Very good or good” health were not between local areas within England but between local areas in Scotland and Wales.. The widest inequality between men at age 65 and years spent in “Very good or good” health were between Perth and Kinross and Blaenau Gwent at 6.3 years; and for women it was between Perth and Kinross and Merthyr Tydfil at 7.0 years.
Figures 11 and 12 further illustrates the gap between the highest and lowest local areas within each country regarding years expected in “Very good or good” health. As seen at birth, the gap between local areas for both men and women at age 65 were largest in England and closely followed by Scotland, with the smallest gap in Northern Ireland. The gap was more than twice as wide in England compared with Northern Ireland. Overall, there was a slightly larger variation among the highest number of years compared with the lowest number of years in “Very good or good” health.
Figure 11. Highest and lowest number of years expected in "Very good or good" health for men at age 65 by country, 2010 to 2012
Source: Office for National Statistics; National Records Scotland; Northern Ireland Statistics and Research Agency
Notes:
Includes all usual residents enumerated on the day of the 2011 Census in England. For the 2011 Census purposes, a usual resident of the UK is anyone who, on 27 March 2011, was in the UK and had stayed or intended to stay in the UK for a period of 12 months or more, or had a permanent UK address and was outside the UK and intended to be outside the UK for less than 12 months.
Local areas have been ranked at their country level, based on the number of years expected in "Very good or good" health to more than one decimal place.
Local areas include upper tier local authorities in England, unitary authorities in Wales, council areas in Scotland and local government districts in Northern Ireland.
Isles of Scilly and City of London have been excluded because of insufficient population sizes.
Download this image Figure 11. Highest and lowest number of years expected in "Very good or good" health for men at age 65 by country, 2010 to 2012
.png (7.3 kB) .xls (41.0 kB)
Figure 12. Highest and lowest number of years expected in "Very good or good" health for women at age 65 by country, 2010 to 2012
Source: Office for National Statistics; National Records Scotland; Northern Ireland Statistics and Research Agency
Notes:
Includes all usual residents enumerated on the day of the 2011 Census in England. For the 2011 Census purposes, a usual resident of the UK is anyone who, on 27 March 2011, was in the UK and had stayed or intended to stay in the UK for a period of 12 months or more, or had a permanent UK address and was outside the UK and intended to be outside the UK for less than 12 months.
Local areas have been ranked at their country level, based on the number of years expected in "Very good or good" health to more than one decimal place.
Local areas include upper tier local authorities in England, unitary authorities in Wales, council areas in Scotland and local government districts in Northern Ireland.
Isles of Scilly and City of London have been excluded because of insufficient population sizes.
Download this image Figure 12. Highest and lowest number of years expected in "Very good or good" health for women at age 65 by country, 2010 to 2012
.png (6.7 kB) .xls (37.4 kB)Overall, the gaps between local areas are much larger regarding years expected in “Very good or good” health than years lived. When considering the fairness of State Pension age (SPa) increases, with its consequence of extending working lives to a higher future SPa (and taking into account improvements in LE), the large gaps in general health state LE between local areas suggests that this expectation will be more challenging for the population in those areas with lower LE in “Very good or good” general health than the national average. This is especially difficult considering that just over half of the local areas for men and women at age 65 have a lower “Very good or good” health state than the UK average.
Nôl i'r tabl cynnwys6. Background
John Cridland CBE is leading the government-sponsored independent review of the State Pension age (SPa). The aim of the review is to present a set of recommendations to the Secretary of State for Work and Pensions to consider when deciding future SPa arrangements. The official review of the SPa will have the remit to “consider changes in life expectancy, wider changes in society and help ensure the State Pension remains sustainable”. The review will submit its recommendations to government by May 2017.
SPa has been linked to projections of UK cohort life expectancy1, which allow projected life expectancy (LE) at any age to be calculated. As LE continues to increase in the UK, it is important to understand whether increasing longevity is accompanied by longer periods in favourable health states (compression of morbidity), longer periods in unfavourable health states (expansion of morbidity) or follows a balanced course where mortality reductions are accompanied by delayed the onset of more serious disability conditions. Thus, health expectancies (general health and activity limitation) are a means to track LE gains in the context of population health improvement. They are important to consider because of the sizeable variations across administrative areas within the UK and the widening inequalities between deprived and affluent areas.
To assist John Cridland with his interim report, which is due to be published in autumn 2016, we have conducted analysis on health expectancies across the whole of the UK.
Notes
- Cohort life expectancies are calculated using age-specific mortality rates that allow for known or projected changes in mortality in later years and are thus regarded as a more appropriate measure of how long a person of a given age would be expected to live, on average, than period life expectancy.
7. What are health expectancies?
Health expectancies add a quality of life dimension to estimates of period life expectancy1 (LE) by dividing expected lifespan into time spent in different states of health; general health and activity limitation. We routinely publish 2 types of health expectancies: healthy life expectancy (HLE) and disability-free life expectancy (DFLE). Generally in our HLE publications, expected years in “Very good or good” health correspond to HLE and “Fair” health is aggregated with “Bad and very bad” health and referred to as “Not good” health. However, for this analysis, if a respondent answered “Very good” or “Good”, they were classified as having “Very good or good” health, “Fair” health was dichotomised and if a respondent answered “Bad” or “Very bad”, they were classified as having “Bad or very bad” health. DFLE, on the other hand, estimates a lifetime free from a limiting persistent illness or disability.
The health and disability prevalence data used in calculating the health expectancies were a single year of data and obtained from questions asked in the 2011 Census on self-rated general health and activity limitation because of health problems. Health expectancy estimates are, in part, subjective and for this analysis were based upon the following 2011 Census survey questions for England and Wales, Scotland and Northern Ireland (see Figures 13 and 14).
Figure 13. General health status question in the 2011 Census (Q13 for England and Wales, Q19 for Scotland and Q24 for Northern Ireland)

Download this image Figure 13. General health status question in the 2011 Census (Q13 for England and Wales, Q19 for Scotland and Q24 for Northern Ireland)
.png (7.1 kB)
Figure 14. Disability status question in the 2011 Census (Q23 for England and Wales, Q21 for Scotland and Q22 for Northern Ireland)

Download this image Figure 14. Disability status question in the 2011 Census (Q23 for England and Wales, Q21 for Scotland and Q22 for Northern Ireland)
.png (16.1 kB)The 2010 to 2012 health expectancy figures in this publication represent the expected life years in different states of health, assuming 2010 to 2012 mortality and health status rates apply throughout that individual’s life. Therefore, the estimates reported in this analysis provide a snapshot of the health status of the population(s) in the UK during 2010 to 2012. The mortality and health status rates of a population change year on year due to exposure to different risks and treatments affecting health, and also through inward and outward migration. So the estimates reported in this analysis should not be interpreted as the actual number of years a person will live in particular health states. Overall, health expectancies are a likely estimate should the mortality and health status rates remain fairly stable over the life course.
Notes
- Period life expectancy at a given age for an area is the average number of years a person would live, if he or she experienced the particular area’s age-specific mortality rates for that time period throughout his or her life. It makes no allowance for any later actual or projected changes in mortality. In practice, death rates of the area are likely to change in the future, so period life expectancy does not therefore give the number of years someone could actually expect to live. Also, people may live in other areas for at least some part of their lives.
8. Methods
The health prevalence data used in calculating the health expectancies by sex and 5-year age bands were a single year of data obtained from questions asked in the 2011 Census form. The questions were about general health and activity limitation due to a health problem or disability (see Figures 13 and 14).
Health expectancies were calculated using the Sullivan method. This method combines health prevalence data with mid-year population estimates (MYPE) and mortality data from interim life tables, over the same period and geographical coverage, to calculate life expectancy (LE) and health expectancies (ONS Life Table Template, Jagger et al. (2007). Mortality data is based on deaths registrations with England and Wales data excluding non-usual residents. However, Scotland includes non-usual residents who die in Scotland and do not have an area of residence within Scotland and imputation is used to assign to geography of ‘residence’ (see section 1.3.1 in the following Healthy life expectancy: technical paper for more detail). Northern Ireland also includes non-usual residents whom are allocated to place of death (see Life Expectancy for Northern Ireland Information Paper & Methodology Guide for more detail). Figures were based on 3 years of data on populations and death registrations covering the period 2010 to 2012 and were centred on the 2011 Census health and disability prevalence data.
Health expectancies among usual residents in the UK were compared across constituent countries and their corresponding local areas. Local areas used for England were upper tier local authorities (UTLAs) but this excludes the City of London and the Isles of Scilly due to insufficient population size. For the other constituent countries, local areas for Wales were unitary authorities, council areas for Scotland and local government districts for Northern Ireland.
The prevalence of general health and activity limitation among males and females were also compared across aggregations of lower super output areas (LSOAs) to deprivation deciles in both England and Wales using the English Index of Multiple Deprivation (2015) and Welsh Index of Multiple Deprivation (2014). For Scotland, data zones were aggregated to deprivation deciles using the Scottish Index of Multiple Deprivation (2012). For Northern Ireland, super output areas (SOAs) were aggregated to deprivation deciles using the Northern Ireland Multiple Deprivation Measure (2010). The data used for Northern Ireland was based on usual residents in private households.
The national deciles of area deprivation are based on deprivation scores for each small area which were ranked using these scores. They were then aggregated into 10 groups or “deprivation deciles”, based on their ranking, with approximate equality in the number of small areas populating each decile.
It must be noted that the indices of deprivation for each constituent country are not directly comparable, but each index is based on the concept that distinct dimensions of deprivation such as income, employment, education and health can be identified and measured separately.
The age-band structures used to calculate health expectancies in this analysis were age 0 to 4, quinary until 85 to 89, 90 and over (0 to 4 was used because of restrictions in providing health prevalence data for ages lower than 1 in some local areas).
The results in this publication will differ from previously published health expectancy estimates for the same time period (2010 to 2012) due to differences in sources and age bands. An official time series using Annual Population Survey (APS) data will be published in November 2016 for the most recent time period of 2013 to 2015, with the inclusion of a back series based on a new child imputation method at national level and by local areas for England.
Nôl i'r tabl cynnwys9. Quality and methodology
The Health Expectancies Quality and Methodology Information document contains important information on:
the strengths and limitations of the data
the quality of the output: including the accuracy of the data, how it compares with related data
uses and users
how the output was created
10. References
Department for Work and Pensions (2013) Autumn Statement announcement on a core principle underpinning future State Pension age rises: DWP background note
Department for Work and Pensions (2016) State Pension age review: terms of reference
Department for Work and Pensions (2016) State pension age review
Jagger C, Cox B, Le Roy S and EHEMU (2007) Health Expectancy Calculation by the Sullivan Method: A Practical Guide Third Edition
Nôl i'r tabl cynnwys

