Cynnwys
- Main points
- Latest indicators at a glance
- Business impact of the coronavirus
- Social impacts of the coronavirus on Great Britain
- Company incorporations and voluntary dissolution applications
- Online job adverts
- Online price change in food and drink basket
- Energy Performance Certificates
- Footfall
- Roads and traffic camera data
- Shipping
- Data
- Glossary
- Measuring the data
- Strengths and limitations
- Related links
1. Main points
According to the latest Business Impact of Coronavirus (COVID-19) Survey, nearly half (47%) of currently trading UK businesses reported that their turnover had decreased below what is normally expected for this time of year. See Section 3.
According to the latest Opinions and Lifestyle Survey, the proportion of British adults who worked from home increased to 29%, the highest since the beginning of July. See Section 4.
Between 16 and 23 October 2020, total online job adverts increased for the seventh consecutive week from 66% to 70% of their 2019 average, the highest recorded level since 27 March 2020. See Section 6.
Prices of items in the food and drink basket decreased by 0.1% in the latest week, with vegetables being the main driver of the change. See Section 7.
In the week ending 25 October 2020, the number of Energy Performance Certificates across England and Wales was 2% higher for existing dwellings and 13% higher for new dwellings than the same week the previous year. See Section 8.
On the weekend 24 to 25 October 2020, footfall in Wales fell to a quarter of its level in the same period a year ago. See Section 9.
On Monday 26 October 2020, the volume of all motor vehicle traffic was 13 percentage points below the levels seen on the first Monday of February 2020. See Section 10.
In the week ending 25 October 2020, counts for all categories of traffic camera activity decreased across London, Greater Manchester and Northern Ireland from the previous week. See Section 10.
Results presented throughout this bulletin are experimental and may be subject to revision.
2. Latest indicators at a glance
Embed code
Source: Office for National Statistics - Faster indicators (Hover over indicator column for source)
Nôl i'r tabl cynnwys5. Company incorporations and voluntary dissolution applications
Incorporations
Figure 2: In the week ending Friday 23 October 2020, there were 15,268 company incorporations, which was higher than the same week in the previous year (12,487)
Total weekly company incorporations, UK, from week ending Friday 4 January 2019 to week ending Friday 23 October 2020
Source: Companies House and Office for National Statistics
Notes:
- Week 1 refers to the period week ending 4 January 2019 and week ending 3 January 2020. Week 43 refers to the period week ending 25 October 2019, and week ending 23 October 2020.
- The dip in December 2019 is explained by two bank holidays in the week ending Friday 27 December 2019.
- Weekly data are for week commencing Saturday to Friday, as incorporation requests received on Saturdays and Sundays are typically processed on subsequent weekdays. For more information, see the accompanying Companies House methodology page.
Download this chart Figure 2: In the week ending Friday 23 October 2020, there were 15,268 company incorporations, which was higher than the same week in the previous year (12,487)
Image .csv .xlsVoluntary dissolution applications
Figure 3: In the week ending Friday 23 October 2020, there were 4,528 voluntary dissolution applications, its lowest since 4 September 2020 and lower than the same week in the previous year (5,045)
Total weekly company voluntary dissolution applications, UK, from week ending Friday 4 January 2019 to week ending Friday 23 October 2020
Source: Companies House and Office for National Statistics
Notes:
- Week 1 refers to the period week ending 4 January 2019 and week ending 3 January 2020. Week 43 refers to the period week ending 25 October 2019, and week ending 23 October 2020.
- The dip in December 2019 is explained by two bank holidays in the week ending Friday 27 December 2019.
- Weekly data are weeks from Saturday to Friday, as voluntary dissolution requests received on Saturdays and Sundays are typically processed on subsequent weekdays. For more information, see the accompanying Companies House methodology page.
Download this chart Figure 3: In the week ending Friday 23 October 2020, there were 4,528 voluntary dissolution applications, its lowest since 4 September 2020 and lower than the same week in the previous year (5,045)
Image .csv .xlsFor more information on other measures of company closures not presented here, see Weekly indicators of company creations and closures from Companies House methodology: August 2020.
Nôl i'r tabl cynnwys6. Online job adverts
These figures use job adverts provided by Adzuna, an online job search engine, and include experimental estimates of online job adverts by Adzuna category and by UK country and Nomenclature of Territorial Units for Statistics: NUTS1 region. The number of job adverts over time is an indicator of the demand for labour. The Adzuna categories used do not correspond to Standard Industrial Classification (SIC) categories, so these values are not directly comparable with the Office for National Statistics (ONS) Vacancy Survey.
Figure 4: Between 16 and 23 October, total online job adverts increased for the seventh consecutive week from 66% to 70% of their 2019 average, the highest recorded level since 27 March 2020
Total weekly job adverts on Adzuna, UK, 4 January 2019 to 23 October 2020, index 2019 average = 100
Embed code
Notes:
- The observations were collected on a roughly weekly basis; however, before June 2020 they were not all observed at the same point in each week, leading to slightly irregular gaps between some observations.
- These series have a small number of missing weeks, mostly in late 2019, and the latest is in January 2020. These values have been imputed using linear interpolation. The data points that have been imputed are clearly marked in the accompanying dataset.
- Further category breakdowns are included in the Online job adverts dataset, and more details on the methodology can be found in using Adzuna to derive an indicator of weekly indices.
In the latest week, total online job adverts increased by 4 percentage points to 70% of their 2019 average. However, there may be a seasonal component to this increase, as it is consistent with the previous year’s trend. Online job adverts increased in 21 of the 28 Adzuna categories.
There was an 11 percentage point increase in the healthcare and social care category to 106% of its 2019 average, which is currently at the highest percentage of the categories in Figure 4. Transport, logistics and warehouse decreased by 19 percentage points to 156% of its 2019 average, although this category has seen high volatility.
Figure 5: The volume of online job adverts increased in every country and region of the UK
Total weekly job adverts on Adzuna, UK, 4 January 2019 to 23 October 2020, index 2019 average = 100, percentage points
Embed code
Notes:
- There is a level shift in the Northern Ireland series from 17 October 2019 due to a large source of Northern Ireland job adverts being removed, and another level shift from 7 August 2020 because of a new source being included.
The volume of online job adverts increased in every country and English region (NUTS1) of the UK. The largest increase was in Northern Ireland, where the volume of job adverts increased by 8 percentage points to 79% of its 2019 average.
The region with the highest volume of job adverts compared with its 2019 average was the East Midlands at 89%, followed by the North East at 88% of its 2019 average. London remains the region with the lowest volume of job adverts for the ninth consecutive week, at 57% of its 2019 average volume; however, like the rest of the UK it has also seen a steady increase in the volume of online job adverts over the previous two months.
Nôl i'r tabl cynnwys7. Online price change in food and drink basket
A timely indication of weekly online price change for a selection of food and drink products from several, large UK retailers has been developed, covering the period 1 June to 25 October 2020. Details of the methodology used for these indicators can be found in Online price changes methodology. This analysis is experimental and should not be compared with our regular consumer price statistics.
The data time series, weekly growth rates and contributions to the weekly change for all individual food and drink items along with sample sizes are published in a dataset alongside this release.
Online prices of items in the food and drink basket decreased by 0.1% overall between Week 20 and Week 21. Figure 6 presents the contributions to this weekly change from each of the main categories of items.
Price changes seemed relatively muted in the latest week, with most categories either showing a small downward movement or no movement at all. The largest contribution to the downward weekly change was identified in the category of vegetables (negative 0.03 percentage points). The only positive contribution to the weekly change was identified in the category of milk, cheese and eggs (0.01 percentage points).
Figure 6: Prices of items in the food and drink basket decreased by 0.1% in the latest week, with vegetables being the main driver of the change
Contributions to online price change of a selection of food and drink products, UK, percentage point contributions to the percentage change between Week 20 (12 October to 18 October) and Week 21 (19 October to 25 October), 2020
Source: Office for National Statistics - Online price collection
Notes:
- Contributions may not always sum to the weekly change, as a result of rounding.
Download this chart Figure 6: Prices of items in the food and drink basket decreased by 0.1% in the latest week, with vegetables being the main driver of the change
Image .csv .xlsThe price of vegetables decreased by 0.3% between Week 20 and Week 21. This was attributable to a general downward contribution of several items in the category, with the largest contributions from onions (negative 0.07 percentage points) and potatoes (negative 0.04 percentage points) partly offset by the positive contribution of crisps (0.04 percentage points).
Prices for milk, cheese and eggs increased by 0.1% in the latest week, primarily driven by cheese (0.13 percentage points). This was partially offset by small price decreases for a few products, the largest being yogurt, which alone contributed negative 0.04 percentage points.
Figure 7, with the data time series for the all-item index and some of the leading categories of the weekly change, shows that the prices for oil and fats have consistently decreased over the last 21 weeks. Whereas the pattern of the other categories in the chart has been more similar to the all-item index with a downward trend up to Week 16, followed by a slow increase. In recent weeks the all-item index has been stable, slightly below its starting point 21 weeks ago.
Figure 7: The all-item index has remained below its Week 1 level (1 June 2020) for the entire data time series
Online price change of selected food and drink products 1 June to 25 October 2020: index Week 1 (1 to 7 June) = 100, UK
Source: Office for National Statistics - Online price collection
Notes:
- Week 1 refers to the period 1 to 7 June 2020, and Week 21 refers to the period 19 October to 25 October.
- The time series for all individual food and drink items are published in a dataset alongside this release.
Download this chart Figure 7: The all-item index has remained below its Week 1 level (1 June 2020) for the entire data time series
Image .csv .xls8. Energy Performance Certificates
Energy Performance Certificates (EPCs) are used as a timely indicator for the number of completed constructions (new EPCs) and number of transactions (existing EPCs). More detailed statistics split by Nomenclature of Territorial Units for Statistics: NUTS1 English region are published weekly by the Ministry of Housing, Communities and Local Government (MHCLG).
This release includes weekly EPCs data for new and existing domestic properties in England and Wales from 24 February 2019 up to the week ending 25 October 2020. This section analyses the percentage change compared with the same week the previous year. For example, the latest week ending 25 October 2020 was compared with the week ending 27 October 2019.
Figure 8: In the week ending 25 October 2020, Energy Performance Certificate levels across England and Wales were higher for both existing and new dwellings compared with the same week in 2019
Existing and new EPC lodgements for England and Wales combined, non-seasonally adjusted, year-on-year percentage change between EPCs on the same equivalent week in 2019, February to October 2020
Source: Ministry of Housing, Communities and Local Government (MHCLG) - Domestic Energy Performance Certificate Register
Notes:
- Further notes and a regional breakdown are available in the weekly Energy Performance Certificates (EPCs) for domestic properties dataset (Excel, 61KB).
- More information on the EPC methods, strengths and limitations is available in the accompanying methodology article.
- In response to the coronavirus (COVID-19) pandemic, the UK government introduced social distancing measures for the property market from 26 March 2020. Restrictions were eased from 13 May 2020, allowing market activity in England to re-commence under restricted conditions. Further guidance is available.
Download this chart Figure 8: In the week ending 25 October 2020, Energy Performance Certificate levels across England and Wales were higher for both existing and new dwellings compared with the same week in 2019
Image .csv .xlsThe latest week shows that all NUTS1 regions except Yorkshire and The Humber and East of England had higher levels of existing and new dwellings EPCs compared with the same period last year.
The percentage change of new dwelling EPCs compared with the same week a year ago continues to show a slower recovery relative to existing dwelling EPCs since May 2020. A reduction in construction would contribute to the delay in EPC assessments of new dwellings.
Nôl i'r tabl cynnwys9. Footfall
These figures are provided by Springboard, a provider of data on customer activity. They measure the volume of footfall compared with the same day the previous year at the overall level and across the categories of high streets, retail parks and shopping centres. For example, Tuesday 14 July 2020 was compared with Tuesday 16 July 2019.
Figure 9: For the second consecutive week, overall footfall remained at around two-thirds of the level of the previous year
Volume of footfall, percentage change from the same day the previous year, UK, 1 March to 25 October 2020

Source: Springboard and the Department for Business, Energy and Industrial Strategy
Notes:
- “PM announcement” refers to the advisory announcement on 16 March 2020 to avoid non-essential travel, bars, restaurants and other indoor leisure venues, and to work from home if possible.
- The spike on Monday 24 August was caused by the comparison with 26 August 2019 last year, which was bank holiday Monday with good weather. The bank holiday this year was a week later, on 31 August.
Download this image Figure 9: For the second consecutive week, overall footfall remained at around two-thirds of the level of the previous year
.png (80.4 kB)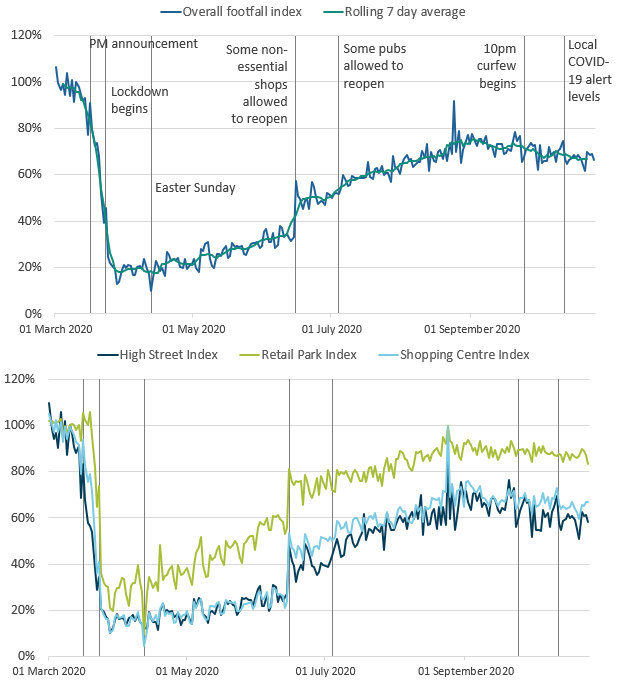
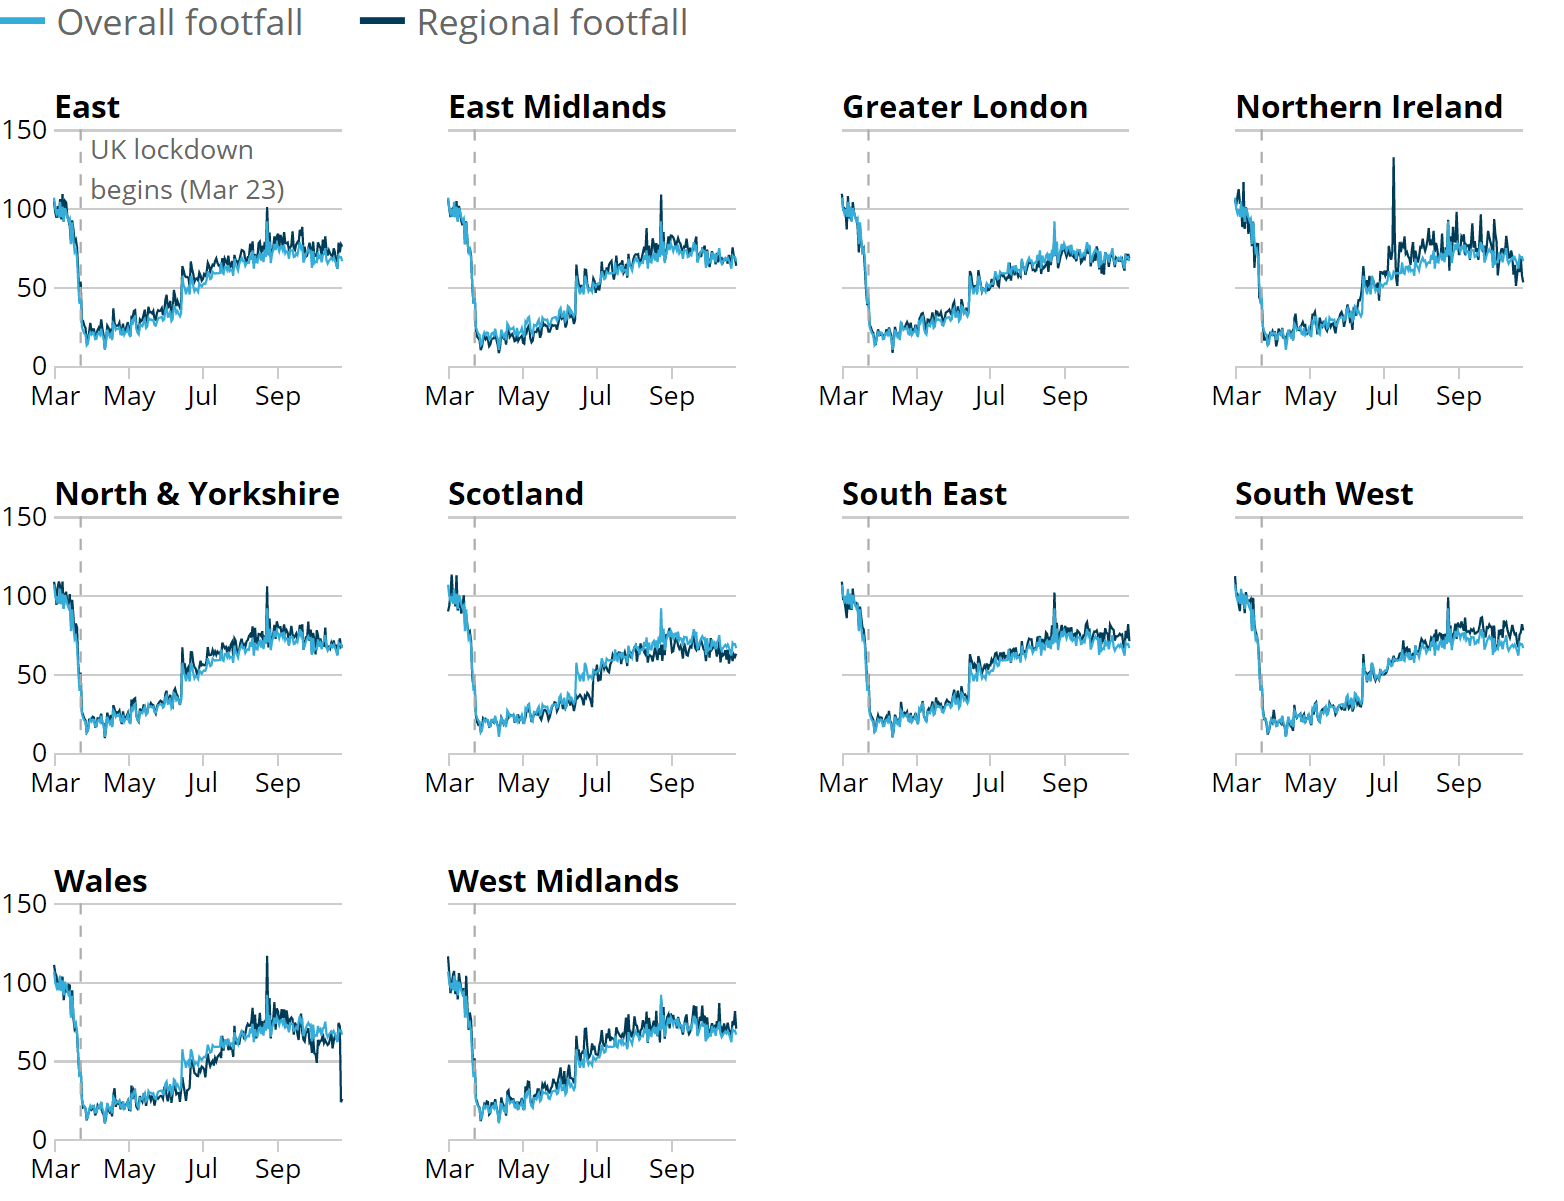
Figure 10: On the weekend 24 to 25 October 2020, footfall in Wales fell to a quarter of the level compared with the same period a year ago
Overall volume of daily footfall, percentage change from the same day the previous year, UK, 1 March to 25 October
Source: Springboard and the Department for Business, Energy and Industrial Strategy
Notes:
- The spike on Monday 24 August was caused by the comparison with 26 August 2019, which was bank holiday Monday with good weather. The bank holiday this year was a week later, on 31 August.
- Many non-essential shops were allowed to open on 15 June 2020 in England, 12 June 2020 in Northern Ireland and 22 June 2020 in Wales. In Scotland, some non-essential shops were allowed to reopen from 29 June 2020 and more from 13 to 15 July 2020.
- Pubs were allowed to reopen on 4 July in both England and Northern Ireland, with beer gardens allowed to reopen on 6 July in Scotland and 13 July in Wales. Pubs were also allowed to reopen indoors in Scotland on 15 July.
- Hospitality venues were required to close by 10pm from 24 September in England and Wales, and 25 September in Scotland. In Northern Ireland they were required to close by 11pm from 30 September.
- On Monday 12 October new local COVID Alert Levels were announced in England introducing a new three-tier system. Tighter restrictions came into force in Northern Ireland on Friday 16 October. This included the temporary closure of schools, pubs and restaurants. A national lockdown for Wales was introduced on Friday 23 October.
Download this image Figure 10: On the weekend 24 to 25 October 2020, footfall in Wales fell to a quarter of the level compared with the same period a year ago
.png (188.9 kB)
Figure 10 shows the volume of footfall in each English region and UK country compared with the same day the previous year.
The weekly average footfall for the week ending 25 October fell in 6 of the 10 regions, with the largest decreases in Northern Ireland (which introduced additional restrictions on 16 October) and Wales (which introduced a national lockdown on 23 October). On the weekend of 24 to 25 October, footfall in Wales fell to a quarter of that seen a year ago.
Average weekly footfall for the week ending 25 October increased marginally in three regions: the West Midlands, East Midlands, and Greater London.
At the time of publication, local lockdowns were in force in several of the affected regions. A full list of local lockdowns is available from the Department of Health and Social Care for England, from the Scottish Government for Scotland, the Welsh Government for Wales and from nidirect for Northern Ireland. Note that other factors may influence footfall including poor weather.
Nôl i'r tabl cynnwys10. Roads and traffic camera data
Road traffic in Great Britain
The Department for Transport (DfT) produces daily road traffic estimates using data from around 275 automatic traffic count sites across Great Britain covering all road types, which are published weekly.
The daily DfT estimates are indexed to the first week of February 2020 and the comparison is to the same day of the week. The data provided are useful as an indication of traffic change rather than actual traffic volumes. More information on the methods, quality and economic analysis for these indicators can be found in the methodology article.
Figure 11: On Monday 26 October 2020, the volume of all motor vehicle traffic was 13 percentage points below the levels seen on the first Monday of February 2020
Daily road traffic index: 100 = same traffic as the equivalent day of the week in the first week of February, 1 March 2020 to 26 October 2020, non-seasonally adjusted
Source: Department for Transport - road traffic statistics: management information
Notes:
- Vertical lines indicate bank holidays.
Download this chart Figure 11: On Monday 26 October 2020, the volume of all motor vehicle traffic was 13 percentage points below the levels seen on the first Monday of February 2020
Image .csv .xlsFigure 11 shows total motor vehicle traffic has continued to fall slightly in recent weeks. On Monday 26 October, car traffic had fallen to 17 percentage points below levels seen in the first week of February 2020.
Heavy vehicle traffic remains slightly above traffic seen in the first week of February, whilst light commercial vehicle traffic is consistent with levels seen in the first week of February.
Traffic camera activity
Traffic cameras are a valuable source for understanding the level of activity in towns and cities as well as changing patterns of mobility. The UK has thousands of publicly accessible traffic cameras with providers ranging from national agencies to local authorities. Further information on the methodology used to produce these data is available in our methodology article and Data Science Campus blog.
In the accompanying dataset, the following categories are available as non-seasonally adjusted, seasonally adjusted and trend data: cars, motorbikes (only available for London and the North East), buses, trucks, vans, pedestrians and cyclists. The categories are available for the following regions, which give a broad coverage across the UK and represent a range of different-sized settlements in urban and rural settings: Durham, London, Greater Manchester, North East, Northern Ireland, Southend and Reading.
Figure 12: In the week ending 25 October 2020, counts for all categories of traffic camera activity decreased across London, Greater Manchester and Northern Ireland from the previous week
Activity in selected areas, daily counts of cars, buses, pedestrians and cyclists, seasonally and non-seasonally adjusted, UK, March to October 2020
Embed code
Notes:
- The regions shown here were selected to be representative of the regions available (see list in the previous text).
- 31 August was a bank holiday.
- Traffic camera images capture the appearance of buses, but they give no indication of the number of passengers using public transport.
- Pre-lockdown averages calculated from when the series started, 11 March to 22 March 2020 for London.
In the latest week ending 25 October 2020, all categories of traffic camera activity in London had decreased. Counts of cars, buses and pedestrians and cyclists in London decreased on the previous week to around 80% of the average level seen pre-lockdown. Please note that counts of buses give no indication of the number of passengers onboard.
In Greater Manchester, which moved into tier 3 "very high" coronavirus alert level on 23 October, counts of cars have decreased to 95% of the average level seen in the previous week, and pedestrians and cyclists' traffic decreased to 82%.
In Northern Ireland, which introduced additional restrictions on 16 October, counts of cars declined to 87% of the average level seen in the previous week, and pedestrians and cyclists' traffic has seen a sharp decline to 69%.
Nôl i'r tabl cynnwys11. Shipping
These shipping indicators are based on counts of all vessels and cargo and tanker vessels. As discussed in Faster indicators of UK economic activity: shipping, we expect the shipping indicators to be related to the import and export of goods.
Figure 13: The average number of daily ship visits remained stable throughout October, with 300 visits in the week ending 25 October 2020
Daily movements in shipping visits, UK, seasonally adjusted, 1 January 2020 to 25 October 2020
Source: exactEarth
Download this chart Figure 13: The average number of daily ship visits remained stable throughout October, with 300 visits in the week ending 25 October 2020
Image .csv .xls
Figure 14: The average number of daily cargo ship visits remained stable throughout October, with 97 visits in the week ending 25 October 2020
Daily movements in shipping visits, UK, seasonally adjusted, 1 January 2020 to 25 October 2020
Source: exactEarth
Notes:
- The vertical lines indicate key events. In order, the events are: Storm Ciara; FCO advises against all non-essential international travel; Lockdown begins; UK international travel quarantine begins; travel corridors to 59 countries come into force; Storm Ellen; Storm Francis; Storm Alex.
- The number of visits for Hull are included in these data from 1 June onwards.
- The seasonally adjusted and trend estimates are estimated using a modified version of the seasonal adjustment method TRAMO-SEATS. More information is available in the Coronavirus and the latest indicators for the UK economy and society methodology.
- The seasonal adjustment method may be limited as this is a short data time series.
- Daily and weekly shipping visits and unique visits are available by port in the dataset, along with non-seasonally adjusted aggregate series.
Download this chart Figure 14: The average number of daily cargo ship visits remained stable throughout October, with 97 visits in the week ending 25 October 2020
Image .csv .xls12. Data
Weekly and daily shipping indicators
Dataset | Released 29 October 2020
The weekly and daily shipping indicators dataset associated with the faster indicators of UK economic activity.
Online job advert estimates
Dataset | Released 29 October 2020
Experimental job advert indices covering the UK job market.
Traffic camera activity
Dataset | Released 29 October 2020
Experimental dataset for busyness indices covering the UK.
Online weekly price changes
Dataset | Released 29 October 2020
The online price changes for a selection of food and drink products from several large UK retailers. These data are experimental estimates developed to deliver timely indicators to help understand the impact of the coronavirus (COVID-19) pandemic.
13. Glossary
Company incorporations
Incorporations are when a company is added to the Companies House register of limited companies. This can also include where an existing business applies to become a limited company, where it was not one before.
Faster indicator
A faster indicator provides insights into economic activity using close-to-real-time big data, administrative data sources, rapid response surveys or Experimental Statistics, which represent useful economic and social concepts.
Voluntary dissolution applications
A voluntary dissolution application is when a company applies to begin dissolution proceedings. As such, they effectively chose to be removed from the Companies House register. For a company to be eligible to voluntarily dissolve, it should not have completed any trading activity for a period of three months.
Nôl i'r tabl cynnwys14. Measuring the data
Detailed information on the data sources, quality and methodology of the different indicators included in this bulletin is available in the Coronavirus and the latest indicators of the UK economy and society methodology.
We will summarise any crucial updates to the quality or methodology in this section in the future.
Nôl i'r tabl cynnwys15. Strengths and limitations
Detailed information on the strengths and limitations of the different indicators included in this bulletin is available in the Coronavirus and the latest indicators of the UK economy and society methodology.
We will summarise any crucial updates or warnings in this section in the future.
Nôl i'r tabl cynnwys
4. Social impacts of the coronavirus on Great Britain
This section includes some headline results from Wave 30 of the Opinions and Lifestyle Survey (OPN), which covers Great Britain, for the period 21 to 25 October 2020.
Travelling to work
In the week ending 25 October, the proportion of British adults who worked from home increased to 29%, the highest since the beginning of July. In contrast, both the proportions of adults who travelled to work and those who neither worked from home nor travelled to work each remained relatively stable, at 59% and 13% respectively.
Face coverings
The proportion of adults who had used a face covering in the previous week when leaving home rose slightly, by 2 percentage points to 98%. Further breakdowns such as the situations when a face covering was worn (for example, while shopping) and by the Great Britain countries, will be available in Coronavirus and the social impacts on Great Britain published on 30 October 2020.
Figure 1: The proportion of adults who worked from home increased to 29%, the highest since the beginning of July 2020
Proportion of adults, Great Britain, 14 May to 25 October 2020
Source: Office for National Statistics – Opinions and Lifestyle Survey
Notes:
Download this chart Figure 1: The proportion of adults who worked from home increased to 29%, the highest since the beginning of July 2020
Image .csv .xls