Cynnwys
- Main points
- Latest indicators at a glance
- UK spending on debit and credit cards
- Business impacts and insights
- Social impact of the coronavirus
- Shipping
- Footfall
- Company incorporations and voluntary dissolution applications
- Online job adverts
- Weekly online food and drink basket
- Roads and traffic camera data
- Data
- Glossary
- Measuring the data
- Strengths and limitations
- Related links
1. Main points
- According to the indicator derived from the Bank of England’s Clearing House Automated Payment System (CHAPS) data, aggregate debit and credit card purchases decreased by 3 percentage points from the previous week to 72% of their February 2020 average. See Section 3.
- According to initial results from the Business Insights and Conditions Survey (BICS), 20% of the workforce of all UK businesses were on furlough leave in Wave 24, a slight increase from 18% in the previous wave but considerably lower than during the first national lockdown where 30% of businesses' workforce were on furlough leave in early June 2020 (when comparable estimates began). See Section 4.
- According to the latest Opinions and Lifestyle Survey (week ending 14 February 2021), the proportion of working adults in Great Britain who in the last seven days travelled to work (either exclusively or in combination with working from home) has decreased by 3 percentage points when compared with the previous period to 44%. See Section 5.
- According to exactEarth, there was an average of 248 daily ship visits in the week ending 14 February 2021, a decrease from the previous week (275) and lower than the same period a year ago (319). See Section 6.
- According to Springboard, in the week ending Saturday 13 February 2021, overall UK retail footfall increased by 3 percentage points to 39% of its level when compared with the equivalent week of 2020. See Section 7.
- According to Companies House, in the week to 12 February 2021, there were 16,882 company incorporations in the UK, an increase from 15,974 in the previous week. See Section 8.
- According to Adzuna, in the week ending 12 February 2021, the volume of UK online job adverts increased slightly by 1 percentage point to 81% of the level seen in the same week last year; this was driven by increases in 10 of the 12 UK regions and countries. See Section 9.
- The overall price of items in the online food and drink basket decreased by 0.2% from the previous week; the main downward contributor to the overall price movement in the latest week was “sugar, jam, syrup, chocolate and confectionery”. See Section 10.
- According to the Department for Transport (DfT), on Monday 15 February 2021, the volume of all motor vehicle traffic saw a weekly increase of 8 percentage points to 68% of the level seen in the first week of February 2020. See Section 11.
Results presented throughout this bulletin are experimental and may be subject to revision.
2. Latest indicators at a glance
Embed code
Download the data
Nôl i'r tabl cynnwys3. UK spending on debit and credit cards
These data series are experimental faster indicators for estimating UK spending on credit and debit cards. They track the daily Clearing House Automated Payment System (CHAPS payments made by credit and debit card payment processors to around 100 major UK retail corporates. These payments are the proceeds of recent credit and debit card transactions made by customers at their stores, both via physical and via online platforms.
More information on the indicator is provided in the accompanying methodology article.
Companies are allocated to one of four categories based on their primary business:
- “staples” refers to companies that sell essential goods that households need to purchase, such as food and utilities
- “work-related” refers to companies providing public transport or selling petrol
- “delayable” refers to companies selling goods whose purchase could be delayed, such as clothing or furnishings
- “social” refers to spending on travel and eating out
Figure 1: In the week to 11 February 2021, the aggregate CHAPS-based indicator of debit and credit card purchases decreased by 3 percentage points from the last week to 72% of its February 2020 average
Index February 2020 = 100, a backward looking seven-day rolling average, 13 January 2020 to 11 February 2021, non-seasonally adjusted, nominal prices
Source: Office for National Statistics and Bank of England calculations
Notes:
- Users should note the daily payment data are the sum of card transactions processed up to the previous working day, so there is slight time lag when compared with real-life events on the chart.
- From this week onwards, there is a change in the presentation format, whereby the data shown will be as a percentage of the February 2020 average, rather than as a percentage change from this average. Note that this does not have an impact on the data.
Download this chart Figure 1: In the week to 11 February 2021, the aggregate CHAPS-based indicator of debit and credit card purchases decreased by 3 percentage points from the last week to 72% of its February 2020 average
Image .csv .xlsFigure 1 shows changes in the value of CHAPS payments received by large UK corporates from their credit and debit card processors, “merchant acquirers”.
Note that from this week onwards, the indexing method has been changed. This means that the data shown will be indexed as a percentage of its level in February 2020, rather than as a percentage change from the February 2020 average.
In the week to 11 February 2021, the CHAPS-based indicator of credit and debit card purchases in aggregate decreased 3 percentage points from the previous week to 72% of its February 2020 average. This was primarily driven by a fall in card spending on “staples”, which fell by 7 percentage points from the previous week. “Social” and “delayable” spending also saw a decline since the previous week, while “work-related” purchases were stable. In the latest week, card spending on “staples” was 106% of its February 2020 average. On the other hand, “delayable”, “social” and “work-related” purchases were 58%, 55% and 62% of levels seen in February 2020, respectively.
The full data time series available for data on UK spending on debit and credit cards can be found in the accompanying dataset.
More about coronavirus
- Find the latest on coronavirus (COVID-19) in the UK.
- Explore the latest coronavirus data from the ONS and other sources.
- All ONS analysis, summarised in our coronavirus roundup.
- View all coronavirus data.
- Find out how we are working safely in our studies and surveys.
4. Business impacts and insights
Based on user feedback, the Business Impact of Coronavirus (COVID-19) Survey has changed its name to the “Business Insights and Conditions Survey” (BICS) from Wave 24 onwards. The purpose remains the same, to collect real-time information on important issues such as the coronavirus (COVID-19) pandemic and the end of the EU transition period.
Initial results from Wave 24 of the Business Insights and Conditions Survey (BICS) covers the reference period 25 January to 7 February 2021, with a response rate of 22.9% (8,999 responses). The survey was live for the period 8 to 16 February 2021.
These dates should be kept in mind in relation to local and national lockdown measures in place during the reference period and the date when the business responded. All four nations within the UK were subject to lockdowns for the duration of the reference and survey live periods.
Figure 2: 20% of the workforce of all UK businesses (excluding those permanently ceased trading) were furloughed, a slight increase from 18% in the previous wave
Headline indicators from the Business Insights and Conditions Survey (BICS), 25 January to 16 February 2021
Embed code
Notes:
- Initial weighted results, Wave 24 of Office for National Statistics' (ONS') Business Insights and Conditions Survey (BICS).
- Businesses were asked for their experiences for the reference period (25 January to 7 February 2021). However, for questions regarding the last two weeks (furlough estimates), businesses may respond from the point of completion of the questionnaire (8 to 16 February 2021).
- A detailed description of the weighting methodology and the weights used for each variable is available in Business Insights and Conditions Survey (BICS) preliminary weighted results.
Download the data
The preliminary result of 20% of businesses’ workforce on furlough leave at the end of January and start of February 2021 equates to approximately 6.4 million people. This number is based on multiplying the BICS weighted furlough proportions by the Inter-Departmental Business Register (IDBR) total annual employment. This will not be consistent with employment estimates from Labour market statistics as these are based on different sources over different time periods but provides an indication. Additionally, the BICS proportion furloughed does not include the public sector, financial sector and parts of agriculture.
Across all UK industries in Wave 24:
- 71% of businesses had been trading for more than the last two weeks (broadly unchanged from 70% in Wave 23)
- 2% of businesses had started trading within the last two weeks after a pause in trading (unchanged from Wave 23)
- 3% of businesses had paused trading but intend to restart in the next two weeks (broadly unchanged from 4% in Wave 23)
- 22% of businesses had paused trading and do not intend to restart in the next two weeks (broadly unchanged from 21% in Wave 23)
- 3% of businesses had permanently ceased trading (unchanged from Wave 23)
Table 1 shows the financial performance of businesses currently trading.
| % | |
|---|---|
| Turnover has increased by more than 50% | <1% |
| Turnover has increased between 20% and 50% | 2% |
| Turnover has increased by up to 20% | 4% |
| Turnover has not been affected | 38% |
| Turnover has decreased by up to 20% | 21% |
| Turnover has decreased between 20% and 50% | 14% |
| Turnover has decreased by more than 50% | 12% |
| Not sure | 9% |
Download this table Table 1: Over 1 in 10 (12%) currently trading UK businesses said that turnover had decreased by more than 50% compared with what is normally expected for this time of year
.xls .csv6. Shipping
These shipping indicators are based on counts of all vessels, and cargo and tanker vessels. As discussed in Faster indicators of UK economic activity: shipping, we expect the shipping indicators to be related to the import and export of goods.
Figure 3: There was an average of 248 daily ships visits in the week ending 14 February 2021, a decrease from the previous week (275) and lower than the same period a year ago (319)
Daily movements in shipping visits, UK, seasonally adjusted, 1 December 2019 to 14 February 2021
Source: exactEarth
Download this chart Figure 3: There was an average of 248 daily ships visits in the week ending 14 February 2021, a decrease from the previous week (275) and lower than the same period a year ago (319)
Image .csv .xlsIn the week ending 14 February 2021, the seven-day average of all daily shipping visits was 248, down from 275 the previous week. This fall could be in part driven by the adverse weather conditions present in the UK as a result of Storm Darcy. The average number of all daily shipping visits remains at lower levels than the same period last year, with 319 visits recorded in the week ending 16 February 2020, despite seeing a decline in the number of ship visits in the same period of last year.
Figure 4: In the week ending 14 February 2021 there was an average of 96 cargo ship visits, a decrease on the previous week (100) but broadly unchanged from the same period a year ago (97)
Daily movements in shipping visits, UK, seasonally adjusted, 1 December 2019 to 14 February 2021
Source: exactEarth
Notes:
- The vertical lines indicate key events. In order, the events are: Storm Ciara; FCO advises against all non-essential international travel; Lockdown begins; UK international travel quarantine begins; travel corridors to 59 countries come into force; Storm Ellen; Storm Francis, Storm Alex; Storm Aiden; Storm Darcy.
- The number of visits for Hull are included in these data from 1 June 2020 onwards.
- The seasonally adjusted estimates are produced using a modified version of the seasonal adjustment method TRAMO-SEATS. More information is available in the Coronavirus and the latest indicators for the UK economy and society methodology.
- The seasonal adjustment method may be limited as this is a short time series.
- Daily and weekly shipping visits and unique visits are available by port in the dataset, along with non-seasonally adjusted aggregate series.
- The trend is now calculated as a rolling seven-day average of the number of daily ship and cargo ship visits. The presentation of the series has been shifted three days forward, this does not affect the calculation of the average.
- Users should note that a reduction in shipping activity has been observed over the Christmas periods in 2019 and 2020.
Download this chart Figure 4: In the week ending 14 February 2021 there was an average of 96 cargo ship visits, a decrease on the previous week (100) but broadly unchanged from the same period a year ago (97)
Image .csv .xlsIn the week ending 14 February 2021, the seven-day average of daily cargo ship visits was 96, a slight decrease from the previous week (100). As with the headline ships data, adverse weather conditions caused by Storm Darcy could be a contributing factor to this decrease. The average number of daily cargo ship visits remains at a marginally lower level than the same period last year, with 97 visits recorded in the same week of 2020, but continues to show signs of a return to pre-Christmas levels since reaching a low of 71 in December 2020.
Nôl i'r tabl cynnwys7. Footfall
National retail footfall
National footfall figures are supplied by Springboard, a provider of data on customer activity. They measure the following for overall UK retail footfall, as well as by high street, retail park, and shopping centre categories:
- daily retail footfall as a percentage of its level on the same day of the equivalent week of the previous year; for example, Sunday 14 February 2021 is compared with Sunday 9 February 2020
- total weekly retail footfall as a percentage of its level in the equivalent week of the prior year; for example, footfall in Week 6 of 2021 is compared with its level in Week 6 of 2020
- the percentage change in weekly footfall compared with the previous week; for example, Week 6 of 2021 is compared with Week 5 of 2021
- Springboard’s weekly data are defined over a seven-day period running from Sunday to Saturday; Week 6 of 2021 therefore refers to the period Sunday 7 to Saturday 13 February 2021
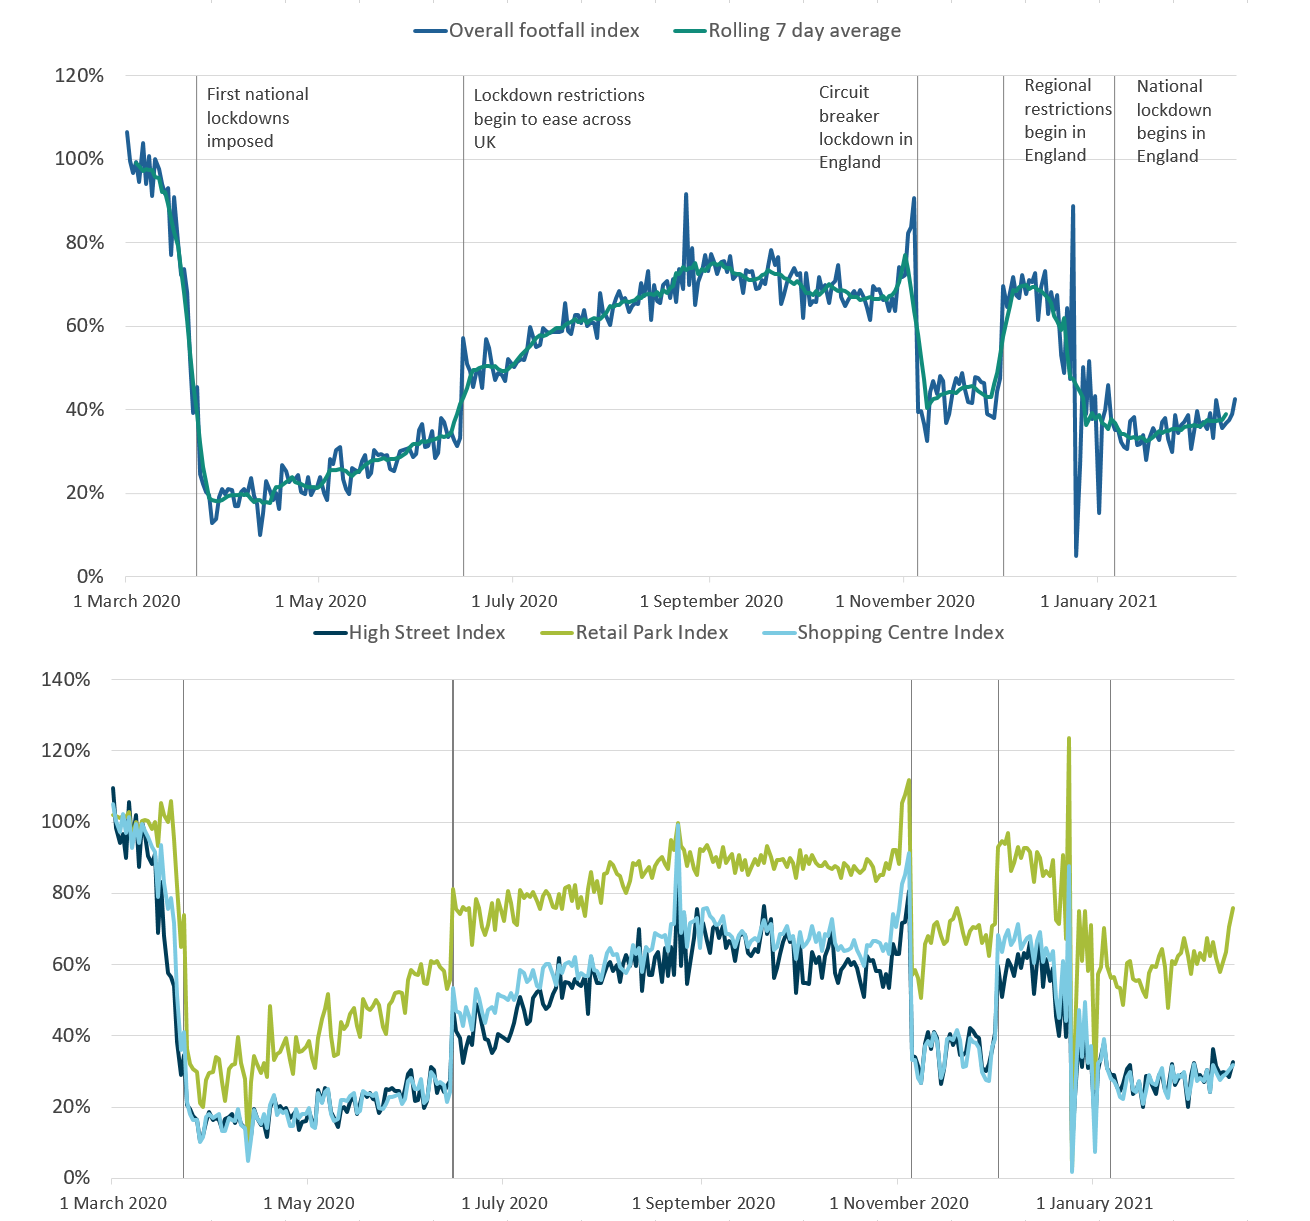
Figure 5: In the week to 13 February 2021, overall retail footfall in the UK was at 39% of its level in the equivalent week of 2020
Volume of retail footfall, percentage compared with the same day of the equivalent week of the previous year, UK, 1 March 2020 to 13 February 2021
Source: Springboard and the Department for Business, Energy and Industrial Strategy
Notes:
- The spike on Monday 24 August 2020 was caused by the comparison with 26 August 2019, which was bank holiday Monday with good weather. The bank holiday this year was a week later, on 31 August 2020.
- The spikes on 23 December and 30 December 2020 are because of the year-on-year comparison with 25 December 2019 and 1 January 2020 respectively, which were bank holidays.
Download this image Figure 5: In the week to 13 February 2021, overall retail footfall in the UK was at 39% of its level in the equivalent week of 2020
.png (177.2 kB)
According to Springboard, in the week ending Saturday 13 February 2021, overall UK retail footfall was at 39% of its level compared with the equivalent week of 2020. This is an increase of 3 percentage points when compared with the equivalent index in the previous week.
In the same seven-day period footfall at retail parks was at 66% of its level compared with the equivalent week of 2020. This is an increase of 4 percentage points compared with the previous week and is the highest figure recorded for the retail category since 2020. Footfall also rose at high streets and shopping centres, increasing by 3 and 2 percentage points respectively to 31% and 29% of its level in the equivalent week of 2020.
However, week-on-week changes in retail footfall between the weeks to 6 and 13 January 2021 were mixed across retail locations. Footfall at UK high streets fell by 2% between these periods, whereas it increased by 6% and 4% at retail parks and shopping centres respectively.
Regional retail footfall
Regional footfall figures are also supplied by Springboard and show the volume of overall retail footfall compared with the same day of the equivalent week of the previous year, by UK region.
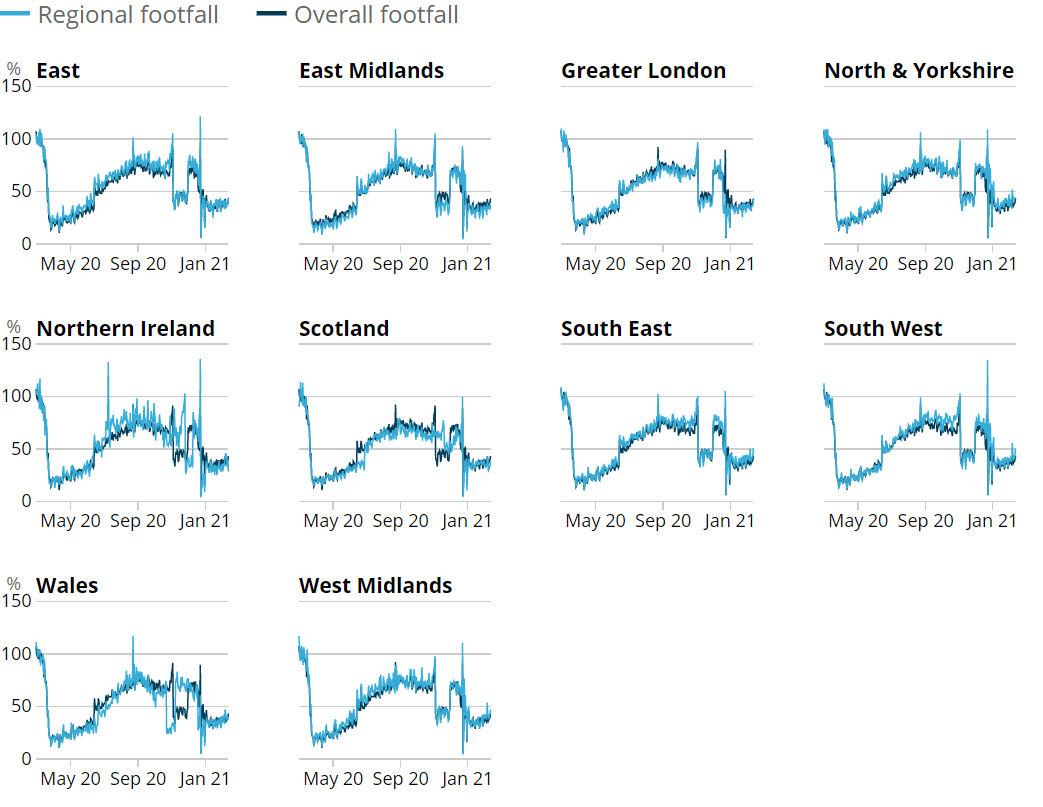
Figure 6: Retail footfall in all regions of the UK remains substantially below its level on the same day of the equivalent week of 2020
Volume of overall daily retail footfall, percentage of the level recorded on the same day of the equivalent week of the previous year, UK regions, 1 March 2020 to 13 February 2021
Source: Springboard and the Department for Business, Energy & Industrial Strategy
Download this image Figure 6: Retail footfall in all regions of the UK remains substantially below its level on the same day of the equivalent week of 2020
.PNG (99.7 kB)
Daily retail footfall in all regions of the UK remains substantially below its level in the equivalent period of 2020. In the week ending 13 February 2021, Greater London, Scotland and the East Midlands continue to experience particularly weak footfall compared with other areas of the UK. In contrast, retail footfall was relatively stronger in the South East, South West, as well as North and Yorkshire.
For example, on Saturday 13 February 2021, retail footfall in the East Midlands was at 37% of its level recorded on the Saturday of the equivalent week of 2020, whereas the corresponding figure for the South East and South West was 50%. Users should note that this comparison has been made using figures for Saturday as this is typically the busiest day of the week for retail locations.
Nôl i'r tabl cynnwys8. Company incorporations and voluntary dissolution applications
Incorporations
According to Companies House data, in the week to Friday 12 February 2021, there were 16,882 company incorporations in the UK, an increase from 15,974 seen in the previous week. This is higher than the number of incorporations seen in the seventh week of both 2019 and 2020, when 15,115 and 15,116 were registered respectively and marks the continuation of a trend of higher incorporations since the second half of last year.
Figure 7: In the week to 12 February 2021, there were 16,882 company incorporations in the UK, an increase from 15,974 in the week before
Total weekly company incorporations, UK, from week ending Friday 4 January 2019 to week ending Friday 12 February 2021
Source: Companies House and Office for National Statistics
Notes:
- Week 1 refers to the period week ending 4 January 2019, 3 January 2020 and 1 January 2021. Week 7 refers to the period week ending 15 February 2019, 14 February 2020 and 12 February 2021.
- The dips in December 2019 and December 2020 are explained by two bank holidays in the week ending 27 December 2019 and 25 December 2020.
- Weekly data are for week commencing Saturday to Friday, as incorporation requests received on Saturdays and Sundays are typically processed on subsequent weekdays. For more information, see the accompanying Companies House methodology page.
Download this chart Figure 7: In the week to 12 February 2021, there were 16,882 company incorporations in the UK, an increase from 15,974 in the week before
Image .csv .xlsVoluntary dissolution applications
In the week to Friday 12 February 2021, there were 5,367 voluntary dissolution applications, a slight decrease from 5,659 recorded in the previous week but broadly consistent with the levels seen in recent weeks. This is slightly lower than the number of voluntary company dissolutions observed in Week 7 of 2019 and 2020, when there were 5,525 and 6,140 respectively.
Figure 8: In the week to Friday 12 February 2021, there were 5,367 voluntary dissolution applications, lower than the level recorded in the same week of both 2020 and 2019
Total weekly company voluntary dissolution applications, UK, from week ending Friday 4 January 2019 to week ending Friday 12 February 2021
Source: Companies House and Office for National Statistics
Notes:
- Week 1 refers to the period week ending 4 January 2019, 3 January 2020 and 1 January 2021. Week 7 refers to the period week ending 15 February 2019, 14 February 2020 and 12 February 2021.
- The dips in December 2019 and December 2020 are explained by two bank holidays in the week ending 27 December 2019 and 25 December 2020.
- Weekly data are for week commencing Saturday to Friday, as incorporation requests received on Saturdays and Sundays are typically processed on subsequent weekdays. For more information, see the accompanying Companies House methodology page.
- Increased Companies House operational activity during week ending 8 November 2019 caused a spike in total weekly company voluntary dissolution applications. This data point should be treated with caution.
Download this chart Figure 8: In the week to Friday 12 February 2021, there were 5,367 voluntary dissolution applications, lower than the level recorded in the same week of both 2020 and 2019
Image .csv .xlsThe full data time series available for weekly company incorporations and voluntary dissolution applications can be found in the accompanying dataset.
Nôl i'r tabl cynnwys9. Online job adverts
These figures use job adverts provided by Adzuna, an online job search engine, and include experimental estimates of online job adverts by Adzuna category and by UK country and NUTS1 region. The number of job adverts over time is an indicator of the demand for labour. The Adzuna categories used do not correspond to Standard Industrial Classification (SIC) categories, so these values are not directly comparable with the Office for National Statistics (ONS) Vacancy Survey.
Figure 9: In the week ending 12 February 2021, the volume of UK online job adverts increased slightly by 1 percentage point to 81% of the level seen in the same week of last year
Total weekly job adverts on Adzuna, UK 4 January 2019 to 12 February 2021, percentage compared with the same week in the previous year
Embed code
Notes:
- The observations were collected on a roughly weekly basis; however, before June 2020 they were not all observed at the same point in each week, leading to slightly irregular gaps between some observations.
- These series have a small number of missing weeks, mostly in late 2019, and the latest is in January 2020. These values have been imputed using linear interpolation. The data points that have been imputed are clearly marked in the dataset.
- Further category breakdowns are included in the Online job advert estimates dataset, and more details on the methodology can be found in Using Adzuna data to derive an indicator of weekly vacancies.
Download the data
According to Adzuna, in the week ending 12 February 2021, the volume of UK online job adverts saw a slight increase of 1 percentage point from the previous week to 81% of the level seen in the same week of last year. This represents the continuation of a trend in increasing online job adverts, when compared with their level last year, since reaching a low of 34% in May 2020.
Excluding the “unknown” category, online job adverts increased in 11 of the 28 Adzuna categories. The most notable was “construction and trades”, which increased by 17 percentage points to 125% of its level seen in the same week of last year. This substantial increase was in part because of a large increase in vacancies from a single company.
The largest weekly fall came from “admin, clerical and secretarial”, which decreased by 10 percentage points to 57% of the level seen in the same week last year. This was followed by “transport, logistics and warehouse”, which saw a decrease of 7 percentage points. Despite this decrease, the volume of online job adverts for “transport, logistics and warehouse” remains high at 115% of its level seen in the same week last year.
Online job adverts for “graduate”, “HR and recruitment” and “catering and hospitality” remained unchanged from the previous week when comparing the volume for these categories with the same week of last year. The “catering and hospitality” category continues to have the lowest volume of online job adverts when compared with its level in the same period of last year at 23%.
Figure 10: In the week ending 12 February 2021, the volume of UK online job adverts increased in 10 of the 12 UK regions and countries
Total weekly job adverts on Adzuna, UK, 4 January 2019 to 12 February 2021, percentage compared with the same week in the previous year
Embed code
Notes:
- There is a level shift in the Northern Ireland series from 17 October 2019 because of a large source of Northern Ireland job adverts being removed, and another level shift from 7 August 2020 because of a new source being included.
Download the data
According to Adzuna, in the week ending 12 February 2021, 10 of the 12 UK regions and countries saw a higher proportion of online job adverts when compared with the same week last year, than that seen in the previous week. The volume of online job adverts in Wales remained broadly unchanged, whereas Northern Ireland fell by 5 percentage points; a continuation of the weekly decrease seen in the previous week.
The South West saw the largest weekly increase of 5 percentage points when compared with the previous week to 86% of the level last seen in the same week of last year, followed by the North East, which saw a weekly increase of 4 percentage points to 94% of its levels seen in the same period last year.
Nôl i'r tabl cynnwys10. Weekly online food and drink basket
A timely indication of weekly online price change for a selection of food and drink products from several large UK retailers has been developed, covering the period 1 June 2020 to 14 February 2021. Details of the methodology used for these indicators can be found in Online price changes methodology. This analysis is experimental and should not be compared with our regular monthly consumer price statistics.
The data time series, weekly growth rates, and contributions to the weekly change for all individual food and drink items, along with sample sizes, are published in a dataset alongside this release.
The overall prices of items in the online food and drink basket decreased by 0.2% between the week ending 14 February 2021 and the previous week, with three categories providing positive contributions to the overall price movement, eight providing negative contributions and three making a negligible contribution to the overall movement.
Figure 11: The overall price of items in the online food and drink basket decreased by 0.2% from the previous week
Percentage point contributions to online price changes for food and drink, UK, between the week ending 7 February 2021 and the week ending 14 February 2021
Source: Office for National Statistics – Online price collection
Notes:
- Contributions may not always sum to the weekly change, as a result of rounding.
Download this chart Figure 11: The overall price of items in the online food and drink basket decreased by 0.2% from the previous week
Image .csv .xlsThe main downward contributor to the overall price movement in the latest week was “sugar, jam, syrup, chocolate and confectionery”, which saw its price fall by 0.8% and contributed negative 0.07 percentage points to the overall price movement. This price fall was mostly because of the falling price of chocolate.
The main offsetting category was “vegetables including potatoes and tubers”, which experienced a 0.3% price increase and contributed positive 0.04 percentage points to the overall price rise. Crisps were the reason for the price increase of this category, contributing 0.38 percentage points.
Nôl i'r tabl cynnwys11. Roads and traffic camera data
Road traffic in Great Britain
According to Department for Transport (DfT) non-seasonally adjusted road traffic data, on Monday 15 February 2021, the volume of all motor vehicle traffic saw a weekly increase of 8 percentage points following the previous week's decline. Comparisons on last week’s figures are likely to be influenced by the impact of snowfall from Storm Darcy. However, it was still 32 percentage points below the level seen in the first week of February 2020. The overall volume of road traffic continues to remain below pre-Christmas levels.
All categories of road traffic showed increases on the previous week’s figures. The traffic volume of cars increased by 8 percentage points compared with the previous week to 61% of the level seen on the same day of the first week in February 2020, whilst light commercial vehicles and heavy goods vehicles (HGV) increased by 7 and 5 percentage points respectively.
Figure 12: On Monday 15 February 2021, the volume of all motor vehicle traffic increased by 8 percentage points when compared with the Monday of the previous week
Daily road traffic index: 100 = same traffic as the equivalent day of the week in the first week of February 2020, 1 March 2020 to 15 February 2021, non-seasonally adjusted, Great Britain
Source: Department for Transport – Road traffic statistics: management information
Notes:
- On 5 January 2021, mainland Scotland entered a full national lockdown, England followed on 6 January 2021.
- For full details on the dates when countries or regions entered their respective tiers and restrictions refer to Section 14: UK regional lockdown restrictions.
Download this chart Figure 12: On Monday 15 February 2021, the volume of all motor vehicle traffic increased by 8 percentage points when compared with the Monday of the previous week
Image .csv .xlsThe daily DfT estimates are indexed to the first week of February 2020 and the comparison is with the same day of the week. The data provided are useful as an indication of traffic change rather than actual traffic volumes. More information on the methods, quality and economic analysis for these indicators can be found in the methodology article.
Traffic camera activity
Traffic cameras are a valuable source for understanding the level of activity in towns and cities as well as changing patterns of mobility. The UK has thousands of publicly accessible traffic cameras with providers ranging from national agencies to local authorities. Further information on the methodology used to produce these data is available in our methodology article and Data Science Campus blog.
In the accompanying dataset, the following categories are available as non-seasonally adjusted, seasonally adjusted and trend data:
- cars
- motorbikes (only available for London and the North East)
- buses
- trucks
- vans
- pedestrians and cyclists
The categories are available for the following regions, which give a broad coverage across the UK and represent a range of different-sized settlements in urban and rural settings:
Figure 13: In the week ending 14 February 2021, in London average counts of traffic camera activity for all vehicle types except trucks increased compared with the previous week
Traffic camera activity in selected areas, daily counts of cars, buses, pedestrians and cyclists, UK, seasonally adjusted, March 2020 to February 2021
Embed code
Notes:
- The regions shown here were selected to be representative of the regions available.
- Traffic camera images capture the appearance of buses, but they give no indication of the number of passengers using public transport.
- Note that data for Durham have been excluded because of quality concerns.
- Note that because of a camera outage between 28 January 2021 and 3 February 2021, the traffic camera values for Greater Manchester have been imputed.
- Please also note that Reading had a larger than normal amount of imputation in the latest week (around 50% of the data was imputed from 10 February onwards).
Download the data
In London in the latest week (week ending 14 February 2021), average counts of traffic activity for all vehicle types except trucks increased when compared with the previous week. Pedestrians and cyclists increased by 7%, whilst cars and motorbikes both increased by 6%. However, counts of all vehicle types in London remain below the levels seen before the first lockdown in March 2020 with pedestrians and cyclists, and car traffic at 61% and 70% of the average level seen between 11 and 22 March 2020 respectively.
In Northern Ireland, average counts of all traffic camera activity except buses increased compared with the previous week. Vans, pedestrians and cyclists, and car traffic increased by 8%,7% and 6% respectively.
In the North East, counts of pedestrians and cyclists increased the most by 18% when compared with the previous week. Conversely, motorbike counts decreased substantially by 27% in the latest week.
In Greater Manchester, counts of all traffic except buses decreased compared with the previous week. Counts of buses increased by 8% while trucks, and pedestrians and cyclists decreased by 8% and 2% respectively.
Nôl i'r tabl cynnwys12. Data
UK spending on credit and debit cards
Dataset | Released 18 February 2021
These data series are experimental faster indicators for monitoring UK retail purchases derived from the Bank of England's Clearing House Automated Payment System (CHAPS) data.
Weekly and daily shipping indicators
Dataset | Released 18 February 2021
The weekly and daily shipping indicators dataset associated with the faster indicators of UK economic activity.
Traffic camera activity
Dataset | Released 18 February 2021
Experimental dataset for busyness indices covering the UK
Online weekly price changes
Dataset | Released 18 February 2021
The online price changes for a selection of food and drink products from several large UK retailers. These data are experimental estimates developed to deliver timely indicators to shed light on changes in prices at online retailers faced by consumers.
Online job advert estimates
Dataset | Released 18 February 2021
Experimental job advert indices covering the UK job market.
Company Incorporations and Voluntary Dissolutions
Dataset | Released 18 February 2021
Weekly dataset showing the number of Companies House Incorporations and Voluntary Dissolution applications accepted.
13. Glossary
Company incorporations
Incorporations are when a company is added to the Companies House register of limited companies. This can also include where an existing business applies to become a limited company, where it was not one before.
Faster indicator
A faster indicator provides insights into economic activity using close-to-real-time big data, administrative data sources, rapid response surveys or Experimental Statistics, which represent useful economic and social concepts.
Voluntary dissolution applications
A voluntary dissolution application is when a company applies to begin dissolution proceedings. As such, they effectively chose to be removed from the Companies House register. For a company to be eligible to voluntarily dissolve, it should not have completed any trading activity for a period of three months.
Nôl i'r tabl cynnwys14. Measuring the data
End of EU exit transition period
As the transition period ends and the UK enters into a new Trade and Cooperation Agreement with the EU, the UK statistical system will continue to produce and publish our wide range of economic and social statistics and analysis. We are committed to continued alignment with the highest international statistical standards, enabling comparability both over time and internationally, and ensuring the general public, statistical users and decision makers have the data they need to be informed.
UK regional lockdown restrictions
The following is a summary of coronavirus (COVID-19) restrictions in each of the four UK constituent countries between Monday 8 and Monday 15 February 2021.
A full list of national restrictions is available for:
- England from gov.uk
- Scotland from the Scottish Government
- Wales from the Welsh Government
- Northern Ireland from nidirect
UK
- All travel corridors were closed. With a few exceptions, arrivals must self-isolate for 10 days and those flying were required to present evidence of a negative COVID test before boarding the plane.
Scotland
- All of mainland Scotland and the Western Isles were under full lockdown restrictions. Orkney and the Shetland Islands were under Level 3 restrictions.
Wales
- All of Wales was in Tier 4 lockdown restrictions.
England
- England was under a full national lockdown.
Northern Ireland
- Northern Ireland was under a full national lockdown.
Detailed information on the data sources, quality and methodology of the different indicators included in this bulletin is available in the Coronavirus and the latest indicators of the UK economy and society methodology.
We will summarise any crucial updates to the quality or methodology in this section in the future.
Nôl i'r tabl cynnwys15. Strengths and limitations
Detailed information on the strengths and limitations of the different indicators included in this bulletin is available in the Coronavirus and the latest indicators of the UK economy and society methodology. We will summarise any crucial updates or warnings in this section in the future.
Nôl i'r tabl cynnwys
5. Social impact of the coronavirus
This section includes some provisional results from the Opinions and Lifestyle Survey (OPN) covering the period 10 February to 14 February 2021. The survey went out to 6,009 adults in Great Britain and had a response rate of 70%. Further information to help understand the impact of the coronavirus (COVID-19) pandemic on people, households and communities in Great Britain, will be available in Coronavirus and the social impacts on Great Britain published on 19 February 2021.
Travelling to work
In the week ending 14 February 2021, the proportion of working adults in Great Britain who in the last seven days:
Shopping
Of the 91% of adults that reported they had left home in the last seven days, the proportion that did so to shop for food and medicine remained broadly unchanged compared with the previous period at 76%. The proportion of these adults who shopped for things other than food and medicine in the last seven days remained unchanged from the previous week at 7%; the continued low level coincides with the ongoing lockdowns throughout the UK.
Nôl i'r tabl cynnwys