Cynnwys
- Main points
- Indexing update
- Latest indicators at a glance
- Vehicle flows around ports
- Roads and traffic camera data
- UK spending on debit and credit cards
- Value Added Tax returns
- Business impacts and insights
- Social impact of the coronavirus
- Company incorporations and voluntary dissolution applications
- Shipping
- Retail footfall
- Online job adverts
- Weekly online food and drink basket
- Data
- Glossary
- Measuring the data
- Strengths and limitations
- Related links
1. Main points
- In December 2020, average vehicle speeds on Strategic Roads Network roads around Dover fell by 4 miles per hour (mph) but returned to pre-Christmas levels in January 2021 (Highways England). See Section 4.
- On Monday 8 March 2021, the volume of all motor vehicle traffic saw a weekly increase of 4 percentage points to 77% of the level seen on the first week in February 2020; this was driven by increases for all three vehicle types (Department for Transport (DfT)). See Section 5.
- In the week to 4 March 2021, the aggregate Clearing House Automated Payment System (CHAPS)-based indicator of debit and credit card purchases increased by 10 percentage points from the previous week to 83% of its February 2020 average; this can in part be attributed to a usual rise in “staples” around the turn of the month (Bank of England’s CHAPS data). See Section 6.
- There were 20,160 new Value Added Tax (VAT) reporters in the UK in February 2021, a decrease from 20,510 in January 2021; this is also lower than the number seen in February 2020 (22,100), and the 2015 to 2019 longer-term average of 20,908 (VAT returns). See Section 7.
- In January 2021, a net 7% of 32,380 firms reported a fall in turnover compared with January 2020 (VAT returns). See Section 7.
- The proportion of the workforce of UK businesses (excluding those permanently ceased trading) on furlough remains broadly unchanged from the previous wave at 19% (Business Insights and Conditions Survey (BICS)). See Section 8.
- There were 19,104 company incorporations in the UK in the week to 5 March 2021, 44% higher than the equivalent week of 2020, and the highest number registered since the beginning of 2019 (though the high level can in part be attributed to a backlog of applications) (Companies House). See Section 10.
- There were 6,808 voluntary company dissolution applications in the UK in the week to 5 March 2021; this is 26% and 32% higher than the levels observed in the equivalent week of 2020 and 2019, respectively (though the high level can in part be attributed to a backlog of paper applications) (Companies House). See Section 10.
- The seven-day average of all daily ship visits was 350 in the week ending 7 March 2021, an increase of 2% from the previous week but 15% lower than the same period a year ago (exactEarth). See Section 11.
- UK retail footfall volumes in the week to 6 March 2021 stood at 42% of their level in the equivalent week of 2020; daily footfall at retail parks continues to outperform that at shopping centres and high streets relative to its level in the same period last year (Springboard). See Section 12.
- UK online job adverts in the week ending 5 March 2021 were 85% of the level seen in the same week last year, similar to the proportion seen in the previous week (Adzuna). See Section 13.
Results presented throughout this bulletin are experimental and may be subject to revision.
2. Indexing update
Users should note that in the coming weeks we will be updating how we construct indices for some of the indicators in this bulletin. At present some indicators are presented as year-on-year indices, allowing comparison of their observed level in a given day, week or year of 2021 against their recorded volume in the corresponding period of a “normal” year, before the effects of the coronavirus (COVID-19) pandemic.
However, from mid-to-late March, this year-on-year approach to indexing will result in comparing 2021 observations against their levels after the onset of the coronavirus pandemic. As a result, those indices would no longer be compared with a pre-pandemic baseline. To help with this issue, we will be making changes to the indexing of a number of indicators in future releases; more detail can be found in Section 18.
Nôl i'r tabl cynnwys3. Latest indicators at a glance
Embed code
4. Vehicle flows around ports
This week we are re-introducing vehicle flows data that were previously published in this bulletin as Highways England road traffic. Their production was suspended in October 2020 while improvements were introduced to the processing of these indicators. These improvements do not represent a change in methodology. This data series will now resume publication on a monthly basis, and the dataset accompanying this release contains a full back series to 2007. The previously published non-seasonally adjusted data have not been revised.
These data are taken from locations on the Strategic Road Network (SRN). The SRN is made up of the motorways and major trunk roads in England managed by Highways England. It does not cover locally managed motorways or B roads. The data include detailed vehicle flows for important roads serving 13 selected major ports, within a 10-kilometre radius of each port location. The seasonally adjusted data time series for average 15-minute vehicle sensor counts and average speed data for sensors around English ports can be found in the experimental dataset.
It is important to note that these data are compiled using different methods and sensors than the Department for Transport's (DfT) daily time series on road traffic in Great Britain. The DfT series are based on the automatic traffic counter sites used in the Quarterly Road Traffic National Statistics publication, which are stratified and weighted to be representative of national traffic.
More information on the methods, quality and economic analysis for these indicators can be found in Faster indicators of UK economic activity: road traffic data for England.
Figure 1: Average counts of vehicles over 11.66m in length fell by 12 percentage points in January 2021 after an increase in December 2020
Average sensor count per 15 minute observation, roads on the SRN around ports in England, December 2018 to January 2021, seasonally adjusted
Source: Highways England webTRIS data
Download this chart Figure 1: Average counts of vehicles over 11.66m in length fell by 12 percentage points in January 2021 after an increase in December 2020
Image .csv .xlsIn 2020, the breakdown of the average sensor counts around ports by vehicle category were:
- greater than 11.66 metres (for example, larger rigid lorries and coaches, articulated lorries): around 10% of the average counts
- 6.6 metres to 11.66 metres (for example, rigid lorries, buses): around 6%
- 5.2 metres to 6.6 metres (for example, panel vans, minibuses): around 12%
- less than 5.2 metres (for example, cars, motorcycles): around 71%
After a slow but steady increase from April 2020, average counts of vehicles greater than 11.66 metres were 8% higher in December 2020 than they were in February 2020, then fell by 12 percentage points in January 2021 to 96% of the level seen in February 2020.
Vehicles between 6.6 metres to 11.66 metres and 5.2 metres to 6.6 metres show a similar but more subdued pattern, with decreases of 4 and 5 percentage points between December 2020 and January 2021, respectively.
Coinciding with the introduction of the lockdown in England in November 2020, average counts of vehicles under 5.2 metres fell by 16 percentage points from October to November 2020. They showed a modest recovery in December 2020, increasing by 4 percentage points, but subsequently fell by 13 percentage points in January 2021 to 57% of the level in February 2020.
Figure 2: Average vehicle speeds on SRN roads around Dover fell by 4 mph in December 2020, but returned to pre-Christmas levels in January 2021
Average speeds of all vehicle types, roads on the SRN around selected ports, December 2018 to January 2021, seasonally adjusted, mph
Source: Highways England webTRIS data
Download this chart Figure 2: Average vehicle speeds on SRN roads around Dover fell by 4 mph in December 2020, but returned to pre-Christmas levels in January 2021
Image .csv .xlsFigure 2 shows the average speeds around a selection of ports (the full selection is available in the dataset). The disparity in speeds is likely accounted for by the different geographies and road types around the ports.
Average speeds around Hull fell by 7 mph from August to October 2020 and have remained at the lower level since then. Portsmouth also saw a fall (although a month later from September to October 2020) of 3 mph and has also remained low. Dover saw a decrease of 4 mph from November to December 2020 but returned to pre-Christmas levels in January 2021.
Nôl i'r tabl cynnwys5. Roads and traffic camera data
Road traffic in Great Britain
According to Department for Transport (DfT) non-seasonally adjusted road traffic data, the volume of all motor vehicle traffic as of Monday 8 March 2021 saw a weekly increase of 4 percentage points to 77% of the level seen on the first week in February 2020. This is a continuation of the recent upward trend but is still below pre-Christmas levels and 23% below the level seen in the first week of February 2020.
All categories of road traffic showed increases on the previous week’s figures. Light commercial vehicles and cars both increased by 4 percentage points to 93% and 70% of the level seen on the same day of the first week in February 2020, respectively. Heavy goods vehicles (HGVs) increased by 1 percentage point compared with the previous week, to 105% of the level seen on the same day of the first week in February 2020.
Figure 3: The volume of motor vehicle traffic on Monday 8 March 2021 was 4 percentage points higher than the previous week, but still 23% below levels in the first week of February 2020
Daily road traffic index: 100 = same traffic as the equivalent day of the week in the first week of February 2020, 1 March 2020 to 8 March 2021, non-seasonally adjusted
Source: Department for Transport – road traffic statistics: management information
Notes:
- The vertical lines indicate key events. In order, these events are: First National lockdowns imposed; Good Friday; Easter Monday; Bank holiday; Bank holiday; National restrictions begin in England; Christmas Day; Boxing Day; New Year's Day; Lockdowns announced in England and Scotland.
- For full details on the dates when countries/regions entered their respective tiers and restrictions refer to section 17: UK regional lockdown restrictions.
Download this chart Figure 3: The volume of motor vehicle traffic on Monday 8 March 2021 was 4 percentage points higher than the previous week, but still 23% below levels in the first week of February 2020
Image .csv .xlsThe daily DfT estimates are indexed to the first week of February 2020 and the comparison is with the same day of the week. The data provided are useful as an indication of traffic change rather than actual traffic volumes. More information on the methods, quality and economic analysis for these indicators can be found in the DfT methodology article.
Traffic camera activity
Traffic cameras are a valuable source for understanding the level of activity in towns and cities as well as changing patterns of mobility. The UK has thousands of publicly accessible traffic cameras with providers ranging from national agencies to local authorities. Further information on the methodology used to produce these data is available in our methodology article and Data Science Campus blog.
In the accompanying dataset, the following categories are available as non-seasonally adjusted, seasonally adjusted and trend data:
- cars
- motorbikes (only available for London and the North East)
- buses
- trucks
- vans
- pedestrians and cyclists
The categories are available for the following regions, which give a broad coverage across the UK and represent a range of different-sized settlements in urban and rural settings:
Figure 4: Average counts of traffic camera activity for cars and pedestrians & cyclists increased in the week ending 7 March 2021 in London, Northern Ireland and the North East
Traffic camera activity in selected areas, daily counts of cars, buses, pedestrians and cyclists, UK, seasonally adjusted, March 2020 to March 2021
Embed code
Notes:
- The 3 regions shown here were selected to be representative of the 6 regions available.
- Traffic camera images capture the appearance of buses, but they give no indication of the number of passengers using public transport.
- Due to technical issues data for Northern Ireland on 6 March 2021 is mostly imputed.
In the week ending 7 March 2021, average counts of traffic activity for cars increased in London, Northern Ireland, and the North East of England. London and Northern Ireland recorded the largest increase of 5% compared with the previous week. Levels of pedestrians and cyclists also increased in these three areas with the largest increase recorded in Northern Ireland (13%), although caution should be taken when interpreting this weekly change because of the relatively low numbers of counts in Northern Ireland.
Average counts of traffic activity for buses increased in London and Northern Ireland while the North East remained broadly unchanged compared with the previous week. Despite this week’s increases, counts for all vehicle types in London and the North East remain below the levels seen before the first lockdown in March 2020. An equivalent comparison cannot be made for Northern Ireland as data are only available from May 2020.
Nôl i'r tabl cynnwys6. UK spending on debit and credit cards
These data series are experimental faster indicators for estimating UK spending on credit and debit cards. They track the daily Clearing House Automated Payment System (CHAPS) payments made by credit and debit card payment processors to around 100 major UK retail corporates. These payments are the proceeds of recent credit and debit card transactions made by customers at their stores, both via physical and via online platforms. More information on the indicator is provided in the accompanying Bank of England methodology article.
Companies are allocated to one of four categories based on their primary business:
- "staples" refers to companies that sell essential goods that households need to purchase, such as food and utilities
- "work-related" refers to companies providing public transport or selling petrol
- "delayable" refers to companies selling goods whose purchase could be delayed, such as clothing or furnishings
- "social" refers to spending on travel and eating out
Figure 5: In the week to 4 March 2021, the aggregate CHAPS-based indicator of debit and credit card purchases increased by 10 percentage points from the previous week to 83% of its February 2020 average
Index February 2020 = 100, a backward looking seven-day rolling average,13 January 2020 to 4 March 2021, non-seasonally adjusted, nominal prices
Source: ONS and Bank of England calculations
Notes:
- Users should note the daily payment data is the sum of card transactions processed up to the previous working day, so there is slight time lag when compared with real-life events on the chart.
- The vertical lines indicate key events. In order, the events are: PM COVID-19 announcement; Lockdown begins; Some non-essential shops allowed to reopen; Local COVID-19 alert levels; National restrictions begin in England; Christmas Eve; Lockdown begins in England and Scotland.
- Percentage point difference is derived from current week and previous week index before rounding.
Download this chart Figure 5: In the week to 4 March 2021, the aggregate CHAPS-based indicator of debit and credit card purchases increased by 10 percentage points from the previous week to 83% of its February 2020 average
Image .csv .xlsFigure 5 shows changes in the value of CHAPS payments received by large UK corporates from their credit and debit card processors, "merchant acquirers".
In the week to 4 March 2021, the CHAPS-based indicator of credit and debit card purchases in aggregate increased 10 percentage points from the previous week to 83% of its February 2020 average. This was primarily driven by an increase in card spending on “staples” and “delayables”, which grew by 15 and 10 percentage points respectively from the previous week. Spending on “staples” normally rises around the turn of the month. “Social” and “work-related” spending also saw increases from the previous week. In the latest week, card spending on “staples” was at 120% of its February 2020 average. On the other hand, “delayable”, “social” and “work-related” purchases were 66%, 65% and 73% of their levels in February 2020, respectively.
Since the substantial fall in spending at the beginning of 2021 that followed the Christmas period and introduction of national lockdowns across the UK, the CHAPS-based indicator of debit and credit card purchases has increased in all four consumption categories. In all consumption categories except “delayable”, the value of CHAPS payments increased by more between 14 January and 4 March 2021 than it did in a comparable period of 2020.
This suggests that spending on ‘social’, ‘staple’ and ‘work-related’ categories has to some extent recovered since January 2021, beyond any seasonal changes we’d expect to observe, based on behaviour last year. However, in all consumption categories except “staples” the CHAPS-based indicator suggests that spending on debit and credit cards is still substantially below its level in the comparable period of 2020.
The full data time series available for data on UK spending on debit and credit cards can be found in the accompanying dataset.
Nôl i'r tabl cynnwys7. Value Added Tax returns
New reporters
The new reporters index measures the number of UK firms sending Value Added Tax (VAT) returns to HM Revenue and Customs (HMRC) for the first time, which is related to the number of firm creations.
Figure 6: New VAT reporters in February 2021 were below February 2020 levels and the 2015-2019 average
The number of new firm reporters, January 2015 to February 2021, non-seasonally adjusted, UK
Source: Her Majesty’s Revenue and Customs (HMRC)
Download this chart Figure 6: New VAT reporters in February 2021 were below February 2020 levels and the 2015-2019 average
Image .csv .xlsThere were 20,160 new VAT reporters in the UK in February 2021, a small decrease from 20,510 in January. This is also lower than the number seen in February 2020 (22,100), and the 2015 to 2019 longer-term average of 20,908.
Business turnover estimates
Turnover diffusion indices are an aggregate measure used to track whether the majority of firms are reporting an increase or decrease in turnover in their VAT returns. They are calculated as the percentage of firms with increasing turnover minus the percentage with decreasing turnover.
The heatmap in Figure 7 is a visual way of showing the VAT diffusion indices based on the standard deviation from their historical 2008 to 2019 average. Larger deviations are more darkly coloured, with red representing a negative change, and teal a positive change when compared with the previous period.
The Monthly estimate of gross domestic product (GDP) for January 2020 will be published on 12 March 2021. February 2021 estimates of Retail sales in Great Britain will be published on Friday 26 March 2021. It is important to note that the timely VAT indicators are not attempting to forecast or predict gross domestic product (GDP) or other headline economic statistics, and the indicators should not be interpreted in this way.
Figure 7: In January 2021, a net 7% of 32,380 firms reported a fall in turnover compared with January 2020
Heatmap of business turnover estimates, UK, diffusion index standard deviation from the mean, up to Quarter 4 (Oct to Dec) 2020 and January 2021. New reporters, UK, up to February 2021
Embed code
Source: Her Majesty’s Revenue and Customs (HMRC)
Notes:
- Agri - Agriculture, forestry and fishing, All - All industries, SA - Seasonally adjusted, NSA - Not seasonally adjusted.
- All industries are unweighted: each firm contributing to the index has the same weight regardless of turnover, size or industry.
- The thresholds for the colours in the heatmap are based on standard deviations from the mean of the indicator between 2008 and 2019.
- Note the monthly turnover estimates are based on a small sample of around 35,000 firms reporting their turnover, so are subject to volatility.
- The average firm contributions by industry for the monthly (M2) turnover estimates using SIC 2007 are dominated by agriculture, forestry and fishing (A), followed by wholesale and retail (G) and construction (F). More information is available in the methodology article.
The month-on-year ago all-industry turnover estimate for January 2021 compared with January 2020 has shown a decrease, at 1.4 (pink) standard deviations below its historical average with a diffusion index of negative 0.07, shown in Figure 7. This implies that, in January 2021, a net 7% of 32,380 firms reported a fall in turnover compared with January 2020.
Across all major industries (services, production, construction, agriculture), turnover estimates decreased over this period. Production and services each saw a decrease to 2.3 standard deviations below their historical averages (light red) with a diffusion index of negative 0.20 and 0.11, respectively. Construction saw a decrease of 1.3 standard deviations (pink) with a diffusion index of negative 0.11. Agriculture saw a slight decrease to 0.3 standard deviations below its historical average (white) with a diffusion index of 0.00.
The month-on-month all-industry turnover estimate for January 2021 compared with December 2020 was steady at 0.1 standard deviations above its historical 2008 to 2019 average (white), with a diffusion index of 0.00, shown in Figure 7. This implies that out of 34,480 firms, an equal number of firms (net 0%) reported increasing and decreasing turnover compared with December 2020.
Services saw the largest month-on-month change, with a decrease of 0.7 standard deviations (pink) above its historical average and at a diffusion index of negative 0.02. Production saw a decrease in turnover of 0.3 standard deviations, with a diffusion index of negative 0.01. Both construction and agriculture saw slight increases in turnover (to 0.3 and 0.2 standard deviations above their historical average) with each having a diffusion index of 0.00.
Please note the monthly and quarterly diffusion indices can exhibit different trends, as only a subset of firms contributes towards the monthly diffusion indices. Quarterly returns are allocated to the calendar quarter in which two or more of the months lie. For example, a quarterly return covering the period September 2020 to November 2020 will be allocated to Quarter 4 (Oct to Dec) 2020. At this stage of the quarterly data cycle, there is limited information about December 2020 feeding into the Quarter 4 2020 estimates.
For more information on how the quarterly reporting periods are derived, see VAT reporting periods in Section 2 of the VAT methodology article. The number of firms contributing towards each of the diffusion indices is published in the dataset.
Nôl i'r tabl cynnwys8. Business impacts and insights
Final results from Wave 25 of the Business Insights and Conditions Survey (BICS) cover the reference period 8 to 21 February 2021, with a response rate of 25.4% (9,905 responses). The survey was live for the period 22 February to 7 March 2021.
These dates should be kept in mind in relation to local and national lockdown measures in place during the reference period and the date when the business responded. All four nations within the UK were subject to lockdowns for the duration of the reference and survey live periods.
A comprehensive analysis of the responses from Wave 25 of the voluntary fortnightly Office for National Statistics (ONS) Business Insights and Conditions Survey (BICS) is available in the Business insights and impact on the UK economy bulletin, published on 11 March 2021.
For experimental single site weighted regional estimates that have been updated up to Wave 21 (29 December 2020 to 10 January 2021), please see Understanding the business impacts of local and national restrictions: February 2021.
Figure 8: The proportion of the workforce of all UK businesses (excluding those permanently ceased trading) on furlough remains broadly unchanged at 19%
Headline indicators from the Business Insights and Conditions Survey (BICS), 8 February to 7 March 2021
Embed code
Notes:
- Final weighted results, Wave 25 of Office for National Statistics' (ONS') Business Insights and Conditions Survey (BICS).
- Businesses were asked for their experiences for the reference period (8 to 21 February 2021). However, for questions regarding the last two weeks (furlough estimates), businesses may respond from the point of completion of the questionnaire (22 February to 7 March 2021).
- A detailed description of the weighting methodology and the weights used for each variable is available in Business Insights and Conditions Survey (BICS): preliminary weighted results.
The 19% of businesses’ workforce on furlough leave in February 2021 equates to approximately 6.2 million people. These numbers are based on multiplying the BICS weighted furlough proportions by the Inter-Departmental Business Register (IDBR) total annual employment. This will not be consistent with employment estimates from Labour market statistics as these are based on different sources over different time periods, but provides an indication of the use of furlough.
Additionally, the BICS proportion furloughed figure does not include the public sector, financial sector and parts of agriculture.
Across all UK industries in Wave 25:
- 72% of businesses had been trading for more than the last two weeks (an increase from 70% in Wave 24)
- 2% of businesses had started trading within the last two weeks after a pause in trading (unchanged from Wave 24)
- 3% of businesses had paused trading but intend to restart in the next two weeks (unchanged from Wave 24)
- 21% of businesses had paused trading and do not intend to restart in the next two weeks (broadly unchanged from 22% in Wave 24)
- 2% of businesses had permanently ceased trading (broadly unchanged from Wave 24)
10. Company incorporations and voluntary dissolution applications
Incorporations
According to Companies House, in the week to Friday 5 March 2021, there were 19,104 company incorporations in the UK, a 12% increase from the 17,096 seen in the previous week. This is the highest number of weekly incorporations observed since the beginning of 2019 and is 44% and 21% greater than the number of incorporations observed in the equivalent weeks of 2020 and 2019, respectively.
The large weekly increase in incorporations in the most recent week can be in part attributed to a backlog of incorporations that built up following an administrative delay in previous weeks.
Figure 9: There were 19,104 company incorporations in the UK in the week to Friday 5 March 2021, a 12% increase from the previous week and the highest weekly number since the beginning of 2019
Total weekly company incorporations, UK, from week ending Friday 4 January 2019 to week ending Friday 5 March 2021
Source: Companies House and Office for National Statistics
Notes:
- Week 1 refers to the period week ending 4 January 2019, 3 January 2020 and 1 January 2021. Week 10 refers to the period week ending 8 March 2019, 6 March 2020 and 5 March 2021.
- The dips in December 2019 and December 2020 are explained by two bank holidays in the week ending 27 December 2019 and 25 December 2020.
- Weekly data are for week commencing Saturday to Friday, as incorporation requests received on Saturdays and Sundays are typically processed on subsequent weekdays. For more information, see the accompanying Companies House methodology page.
Download this chart Figure 9: There were 19,104 company incorporations in the UK in the week to Friday 5 March 2021, a 12% increase from the previous week and the highest weekly number since the beginning of 2019
Image .csv .xlsVoluntary dissolution applications
In the week to Friday 5 March 2021, there were 6,806 voluntary dissolution applications in the UK according to Companies House. This is a 3% increase from the previous week and is 26% and 32% higher than the number of voluntary company dissolutions in the equivalent week of 2020 and 2019, respectively.
This represents the largest number of weekly voluntary dissolution applications since the week ending 8 November 2019, when there was a spike in the figures because of increased Companies House operational activity. Discarding the week ending 8 November 2019, the number of voluntary dissolution applications in the week to 5 March 2021 is the highest observed since January 2019.
The large weekly increases in voluntary dissolution applications in recent weeks can be in part attributed to a backlog of paper applications that are being processed. Companies House expect the workload to be back within normal operating levels by the end of the week ending 12 March 2021.
Figure 10: In the week to Friday 5 March 2021 there were 6,806 voluntary dissolution applications. This is 26% and 32% higher than levels observed in the equivalent week of 2020 and 2019 respectively
Total weekly company voluntary dissolution applications, UK, from week ending Friday 4 January 2019 to week ending Friday 5 March 2021
Source: Companies House and Office for National Statistics
Notes:
- Week 1 refers to the period week ending 4 January 2019, 3 January 2020 and 1 January 2021. Week 10 refers to the period week ending 8 March 2019, 6 March 2020 and 5 March 2021.
- The dips in December 2019 and December 2020 are explained by two bank holidays in the week ending 27 December 2019 and 25 December 2020.
- Weekly data are weeks from Saturday to Friday, as voluntary dissolution requests received on Saturdays and Sundays are typically processed on subsequent weekdays. For more information, see the accompanying Companies House methodology page.
- Increased Companies House operational activity during week ending 8 November 2019 caused a spike in total weekly company voluntary dissolution applications. This data point should be treated with caution.
Download this chart Figure 10: In the week to Friday 5 March 2021 there were 6,806 voluntary dissolution applications. This is 26% and 32% higher than levels observed in the equivalent week of 2020 and 2019 respectively
Image .csv .xlsThe full data time series available for weekly company incorporations and voluntary dissolution applications can be found in the accompanying dataset.
Nôl i'r tabl cynnwys11. Shipping
These shipping indicators are based on counts of all vessels, and cargo and tanker vessels. As discussed in Faster indicators of UK economic activity: shipping, we expect the shipping indicators to be related to the import and export of goods.
Figure 11: There was an average of 350 daily ship visits in the week ending 7 March 2021, a 2% increase from the previous week but 15% lower than the same period a year ago
Daily movements in shipping visits, UK, seasonally adjusted, 1 December 2019 to 7 March 2021
Source: exactEarth
Download this chart Figure 11: There was an average of 350 daily ship visits in the week ending 7 March 2021, a 2% increase from the previous week but 15% lower than the same period a year ago
Image .csv .xlsIn the week ending 7 March 2021, the seven-day average of all daily shipping visits was 350, an increase of 2% from the previous week. The rise from the previous week can be attributed to activity in three major UK ports: Holyhead, Liverpool and Southampton.
This marks the continuation of a strong upward trend since the beginning of the year and is the highest number of visits seen since September 2020. However, total ship visits remain at a lower level than the same period last year by 15%, with 411 visits recorded in the week ending 8 March 2020.
Figure 12: There was an average of 108 cargo and tanker ship visits in the week ending 7 March 2021, a 2% increase from the previous week but still 19% lower than the same period a year ago
Daily movements in shipping visits, UK, seasonally adjusted, 1 December 2019 to 7 March 2021
Source: exactEarth
Notes:
- The vertical lines indicate key events. In order, the events are: Storm Ciara; FCO advises against all non-essential international travel; Lockdown begins; UK international travel quarantine begins; travel corridors to 59 countries come into force; Storm Ellen; Storm Francis; Storm Alex; Storm Aiden; Storm Darcy.
- The number of visits for Hull are included in these data from 1 June 2020 onwards.
- The seasonally adjusted estimates are produced using a modified version of the seasonal adjustment method TRAMO-SEATS. More information is available in the Coronavirus and the latest indicators for the UK economy and society methodology.
- The seasonal adjustment method may be limited as this is a short time series.
- Daily and weekly shipping visits and unique visits are available by port in the dataset, along with non-seasonally adjusted aggregate series.
- The trend is now calculated as a rolling seven-day average of the number of daily ship and cargo and tanker ship visits. The presentation of the series has been shifted three days forward, this does not affect the calculation of the average.
- Users should note that a reduction in shipping activity has been observed over the Christmas periods in 2019 and 2020.
Download this chart Figure 12: There was an average of 108 cargo and tanker ship visits in the week ending 7 March 2021, a 2% increase from the previous week but still 19% lower than the same period a year ago
Image .csv .xlsIn the week ending 5 March 2021, the seven-day average of all daily cargo and tanker ship visits was 108; a slight increase from the 106 visits recorded in the previous week. Despite the average number of daily cargo and tanker ship visits remaining at pre-Christmas levels in this latest week, it is still 19% lower than the same period a year ago, with 134 ship visits recorded in the week ending 8 March 2020.
Nôl i'r tabl cynnwys12. Retail footfall
National retail footfall
National footfall figures are supplied by Springboard, a provider of data on customer activity. They measure the following for overall UK retail footfall, as well as by high street, retail park, and shopping centre categories:
- daily retail footfall as a percentage of its level on the same day of the equivalent week of the previous year; for example, Saturday 6 March 2021 is compared with Saturday 27 February 2020
- total weekly retail footfall as a percentage of its level in the equivalent week of the prior year; for example, footfall in Week 10 of 2021 is compared with its level in Week 10 of 2020
- the percentage change in weekly footfall compared with the previous week; for example, Week 10 of 2021 is compared with Week 9 of 2021
- Springboard's weekly data are defined over a seven-day period running from Sunday to Saturday; Week 10 of 2021 therefore refers to the period Sunday 28 February 2021 to Saturday 6 March 2021
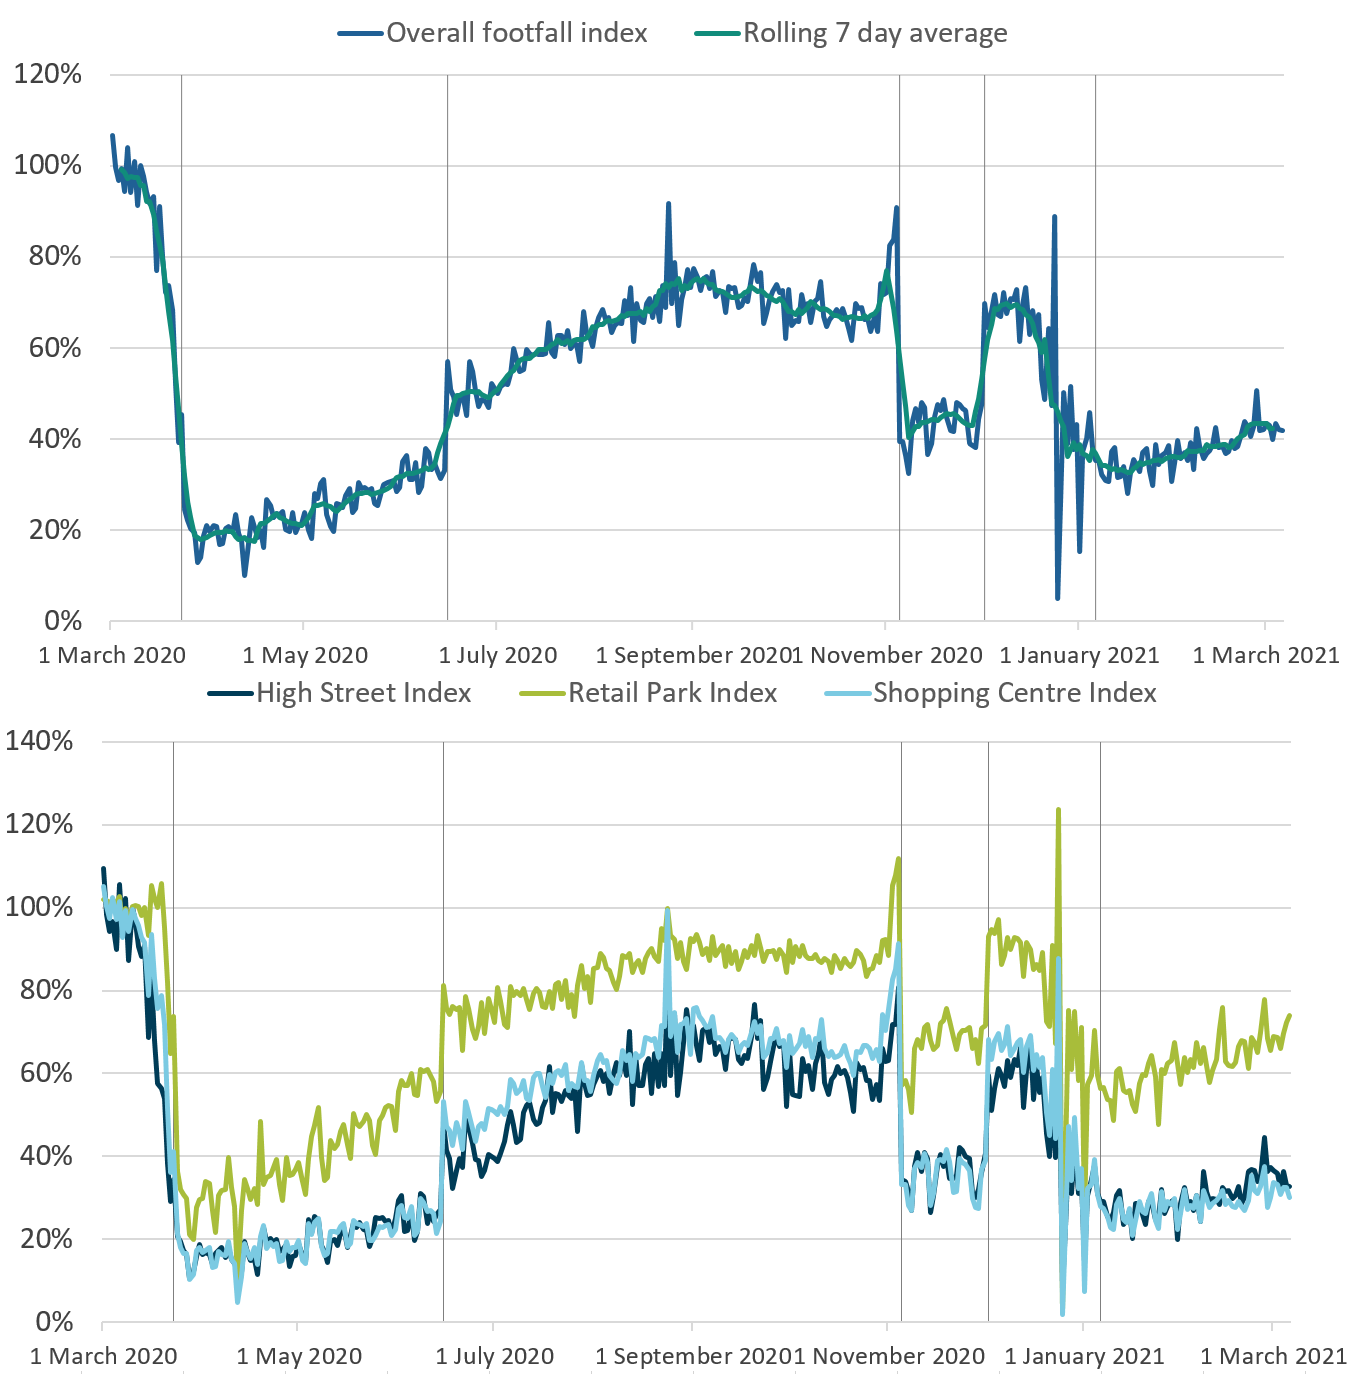
Figure 13: In the week to 6 March 2021, overall retail footfall in the UK was at 42% of its level in the equivalent week of 2020, broadly unchanged from the week before
Volume of retail footfall, percentage compared with the same day of the equivalent week of the previous year, UK, 1 March 2020 to 6 March 2021
Source: Springboard and the Department for Business, Energy & Industrial Strategy
Notes:
- The vertical lines indicate the following key events: first national lockdowns imposed; lockdown restrictions begin to ease across the UK; circuit-breaker lockdown in England; regional restrictions begin in England; national lockdown begins in England.
- The spike on Monday 24 August 2020 was caused by the comparison with 26 August 2019, which was bank holiday Monday with good weather. The bank holiday this year was a week later, on 31 August 2020.
- The spikes on 23 December and 30 December 2020 are because of the year-on-year comparison with 25 December 2019 and 1 January 2020 respectively, which were bank holidays.
Download this image Figure 13: In the week to 6 March 2021, overall retail footfall in the UK was at 42% of its level in the equivalent week of 2020, broadly unchanged from the week before
.png (195.7 kB)
According to Springboard, in the week to 6 March 2021, overall retail footfall was at 42% of its level in the equivalent week of 2020; this is broadly unchanged from the value of the same index in the previous week.
Footfall at retail parks continues its relative strength compared with high streets and shopping centres. In the same seven-day period, footfall at retail parks was at 69% of its level in the equivalent week of 2020. The corresponding figures for high streets and shopping centres were 35% and 31%, respectively.
Only retail parks saw a substantial week-on-week increase in footfall, rising by 3% between the weeks ending 27 February and 6 March 2021. In contrast, footfall at high streets fell by 3% in the same period and footfall at shopping centres was broadly unchanged.
Regional retail footfall
Regional footfall figures are also supplied by Springboard and show the volume of overall retail footfall compared with the same day of the equivalent week of the previous year, by UK region.
Figure 14: In the week to 6 March 2021, daily retail footfall in all UK countries and regions continues to be substantially lower than its level in the equivalent period of 2020
Volume of overall daily retail footfall, percentage of the level recorded on the same day of the equivalent week of the previous year, UK regions, 1 March 2020 to 6 March 2021

Source: Springboard and the Department for Business, Energy & Industrial Strategy
Download this image Figure 14: In the week to 6 March 2021, daily retail footfall in all UK countries and regions continues to be substantially lower than its level in the equivalent period of 2020
.PNG (108.8 kB)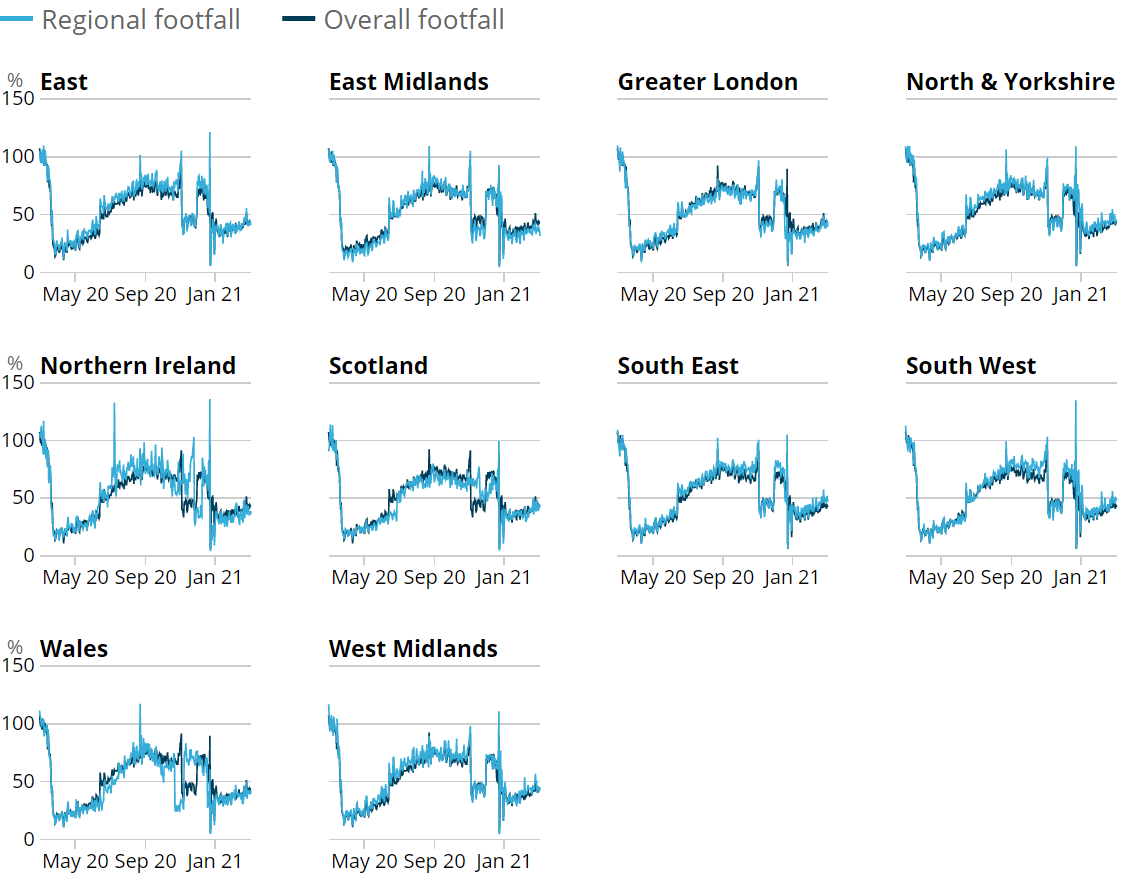
In the week to 6 March 2021, retail footfall in all regions of the UK continues to be substantially lower than its level in the equivalent period of last year. However, there are large regional differences with some areas seeing stronger retail footfall than others. Daily retail footfall was generally strongest in the South West, South East, and the North and Yorkshire. In contrast, it was generally weakest in the East Midlands, Northern Ireland, and Greater London.
For example, on Saturday 6 March 2021, retail footfall in the East Midlands was at 31% of its level recorded on the Saturday of the equivalent week of 2020, whereas the corresponding figure for the South West was 48%. Users should note that this comparison has been made using figures for Saturday as this is typically the busiest day of the week for retail locations.
Nôl i'r tabl cynnwys13. Online job adverts
These figures use job adverts provided by Adzuna, an online job search engine, and include experimental estimates of online job adverts by Adzuna category and by UK country and NUTS1 region. The number of job adverts over time is an indicator of the demand for labour. The Adzuna categories used do not correspond to Standard Industrial Classification (SIC) categories, so these values are not directly comparable with the Office for National Statistics (ONS) Vacancy Survey.
Figure 15: In the week ending 5 March 2021, the proportion of UK online job adverts was 85% of the level seen in the same week last year, similar to the proportion seen in the previous week
Total weekly job adverts on Adzuna, UK, 4 January 2019 to 5 March 2021, percentage compared with the same week in the previous year
Embed code
Notes:
- The observations were collected on a roughly weekly basis; however, before June 2020 they were not all observed at the same point in each week, leading to slightly irregular gaps between some observations.
- These series have a small number of missing weeks, mostly in late 2019, and the latest is in February 2020. These values have been imputed using linear interpolation. The data points that have been imputed are clearly marked in the dataset.
- Further category breakdowns are included in the Online job advert estimates dataset, and more details on the methodology can be found in Using Adzuna data to derive an indicator of weekly vacancies.
- Job adverts data for the week ending 19 February 2021 were unavailable so have been imputed through linear interpolation.
According to Adzuna, in the week ending 5 March 2021, the proportion of total UK online job adverts was 85% of the level seen in the same week last year, broadly unchanged from that seen for the equivalent index in the previous week. This remains at a much higher level than that seen in May 2020, where the proportion of online job adverts was at 34% when compared with a year earlier.
Excluding the “unknown” category, in the last week, online job adverts as a proportion of their level in the same week last year decreased in 17 of the 28 Adzuna categories and increased in 9. The “manufacturing” category saw the largest weekly decrease of 19 percentage points to 130% of its level seen in the same week last year. The year-on-year increase for manufacturing reflects a bounce back from a subdued level of online job adverts at the start of 2020.
This was followed by the “transport, logistics and warehouse” category, which saw a decrease of 18 percentage points to 132% of its level seen in the same week last year and the “property” category which saw a decrease of 15 percentage points. The “catering and hospitality” and “part-time and weekend” categories remained unchanged compared with the previous week.
The largest weekly increase came from the “IT, computing and software” category, which increased by 12 percentage points to 109% of its level seen in the same week last year. This was followed by the “scientific and QA” category, which saw a weekly increase of 11 percentage points to 116% of its level seen in the same week last year.
Figure 16: In the latest week ending 5 March 2021, online job adverts as a proportion of their level in the same week last year decreased for 10 of the 12 UK countries and regions
Total weekly job adverts on Adzuna, UK, 4 January 2019 to 5 March 2021, percentage compared with the same week in the previous year
Embed code
Notes:
- There is a level shift in the Northern Ireland series from 17 October 2019 because of a large source of Northern Ireland job adverts being removed, and another level shift from 7 August 2020 because of a new source being included.
- These series have a small number of missing weeks, mostly in late 2019, and the latest is in February 2020. These values have been imputed using linear interpolation. The data points that have been imputed are clearly marked in the dataset.
According to Adzuna, in the week ending 5 March 2021, online job adverts as a proportion of their level in the same week of last year decreased for 10 of the 12 UK regions and countries. The largest weekly decrease came from Northern Ireland where the volume of online job adverts fell by 13 percentage points, a continuation of a recent downward trend.
The volume of online job adverts in Wales remained unchanged in the latest week at 89% of its level seen in the same week last year. The only weekly increase came from the North East of England, which saw a slight increase of 1 percentage point compared with the previous week. The decreases seen across most regions were of less than 5 percentage points, and offset in part by a large increase in the "unmatched” regional category, resulting in the relatively stable proportion of total online job adverts at the UK level in the latest week.
Nôl i'r tabl cynnwys14. Weekly online food and drink basket
A timely indication of weekly online price change for a selection of food and drink products from several large UK retailers has been developed, covering the period 1 June 2020 to 7 March 2021. Details of the methodology used for these indicators can be found in Online price changes methodology. This analysis is experimental and should not be compared with our regular monthly consumer price statistics.
The data time series, weekly growth rates, and contributions to the weekly change for all individual food and drink items, along with sample sizes, are published in a dataset alongside this release.
The overall price of items in the online food and drink basket was unchanged between the week ending 7 March 2021 and the previous week, with six categories providing positive contributions to the overall price movement, four providing negative contributions and four making negligible contributions to the overall movement.
Figure 17: The overall price of items in the online food and drink basket was unchanged from the previous week
Percentage point contributions to online price changes for food and drink, UK, between the week ending 28 February 2021 and the week ending 7 March 2021
Source: Office for National Statistics - Online price collection
Notes:
- Contributions may not always sum to the weekly change, as a result of rounding.
Download this chart Figure 17: The overall price of items in the online food and drink basket was unchanged from the previous week
Image .csv .xlsThe main upward contributor to the overall price movement in the latest week was the “wine” category, which contributed positive 0.04 percentage points. This category’s price increased by 0.5% in the latest week, mostly because of the rising prices of red and white wine.
The next largest upward contributor was “sugar, jam, syrup, chocolate and confectionery”. This category saw its price increase by 0.4% in the latest week, caused by the rising prices of chocolate and ice cream, which contributed positive 0.03 percentage points to the overall price movement.
The main downward contributor was “fruit”, which experienced a 0.3% price decrease and contributed negative 0.02 percentage points towards the overall price movement.
Nôl i'r tabl cynnwys15. Data
UK spending on credit and debit cards
Dataset | Released 11 March 2021
These data series are experimental faster indicators for monitoring UK retail purchases derived from the Bank of England's Clearing House Automated Payment System (CHAPS) data.
Weekly and daily shipping indicators
Dataset | Released 11 March 2021
The weekly and daily shipping indicators dataset associated with the faster indicators of UK economic activity.
Traffic camera activity
Dataset | Released 11 March 2021
Experimental dataset for busyness indices covering the UK.
Online weekly price changes
Dataset | Released 11 March 2021
The online price changes for a selection of food and drink products from several large UK retailers. These data are experimental estimates developed to deliver timely indicators to shed light on changes in prices at online retailers faced by consumers.
Online job advert estimates
Dataset | Released 11 March 2021
Experimental job advert indices covering the UK job market.
Company Incorporations and Voluntary Dissolutions
Dataset | Released 11 March 2021
Weekly dataset showing the number of Companies House Incorporations and Voluntary Dissolution applications accepted.
Business insights and impact on the UK economy
Dataset | Released 11 March 2021
Responses from the voluntary fortnightly Business Insights and Conditions Survey (BICS), which captures businesses responses on how their turnover, workforce prices, trade and business resilience have been affected in the reference period.
Value Added Tax
Dataset | Released 11 March 2021
Value Added Tax (VAT) turnover and expenditure diffusion indexes and new VAT reporters using data from HM Revenue and Customs (HMRC) VAT returns.
Vehicle flows around ports
Dataset | Released 11 March 2021
Monthly data showing vehicle flows around major ports in England. Contains average 15-minute sensor counts by size of vehicle, and average speeds.
16. Glossary
Company incorporations
Incorporations are when a company is added to the Companies House register of limited companies. This can also include where an existing business applies to become a limited company, where it was not one before.
Diffusion index
The diffusion index tracks the growth in turnover and expenditure of firms. It is constructed to lie between negative one and one. For example, if 65% of firms have increasing turnover, 30% have decreasing turnover and 5% turnover remains unchanged, then the diffusion index is 0.35.
Faster indicator
A faster indicator provides insights into economic activity using close-to-real-time big data, administrative data sources, rapid response surveys or Experimental Statistics, which represent useful economic and social concepts.
New reporter
A new reporter is defined as a firm with a Value Added Tax (VAT) reference (that is, firm identification number) which has not previously reported its VAT returns. New reporters are published within one month of the end of the reporting period. The new reporting behaviour measure is classified by the month the data were received by HM Revenue and Customs (HMRC), known as the receipt date, which is not necessarily the same as the reference period (the period for which the VAT return is made).
Voluntary dissolution applications
A voluntary dissolution application is when a company applies to begin dissolution proceedings. As such, they effectively chose to be removed from the Companies House register. For a company to be eligible to voluntarily dissolve, it should not have completed any trading activity for a period of three months.
Nôl i'r tabl cynnwys17. Measuring the data
End of EU exit transition period
As the transition period ends and the UK enters into a new Trade and Cooperation Agreement with the EU, the UK statistical system will continue to produce and publish our wide range of economic and social statistics and analysis. We are committed to continued alignment with the highest international statistical standards, enabling comparability both over time and internationally, and ensuring the general public, statistical users and decision makers have the data they need to be informed.
UK regional lockdown restrictions
The following is a summary of coronavirus (COVID-19) restrictions in each of the four UK constituent countries between Monday 1 March and Monday 8 March 2021.
A full list of national restrictions is available for England from GOV.UK, for Scotland from the Scottish Government, for Wales the Welsh Government and for Northern Ireland from nidirect.
Restrictions as of Monday 1 March 2021
Scotland
- All of mainland Scotland and the Western Isles are under full lockdown restrictions; Orkney and the Shetland Islands are under Level 3 restrictions.
- All arrivals from outside of the Common Travel Area (UK and Ireland) must self-isolate for 10 days at a managed quarantine hotel.
Wales
- All of Wales is under Alert Level 4 restrictions, equivalent to a national lockdown.
- Travellers who have been in a red list country in the last 10 days are not allowed into Wales and must self-isolate for 10 days in a managed quarantine hotel in either England or Scotland.
- Arrivals from other countries not on the red list must self-isolate for 10 days and undertake testing.
England
- England is under a full national lockdown.
- UK and Irish nationals arriving from red list countries must quarantine at hotels selected by the government. With some exceptions, non-UK and non-Irish nationals are not permitted to travel to the UK from red list countries.
- Arrivals from other countries must self-isolate at home for 10 days and are required to present evidence of a negative COVID-19 test before boarding planes.
Northern Ireland
- Northern Ireland is under a full national lockdown.
- Arrivals from other countries outside of the Common Travel Area must self-isolate at home for 10 days and are required to present evidence of a negative COVID-19 test before boarding planes.
8 March 2021
England
- Schools and colleges reopen to all students.
Detailed information on the data sources, quality and methodology of the different indicators included in this bulletin is available in the Coronavirus and the latest indicators of the UK economy and society methodology. We will summarise any crucial updates to the quality or methodology in this section in the future.
Nôl i'r tabl cynnwys18. Strengths and limitations
Detailed information on the strengths and limitations of the different indicators included in this bulletin is available in the Coronavirus and the latest indicators of the UK economy and society methodology. We will summarise any crucial updates or warnings in this section in the future.
Indexing update
As highlighted in Section 2, we will be updating how we construct indices for some of the indicators in this bulletin in upcoming releases. At present some indicators are presented as year-on-year indices, allowing comparison of their observed level in a given day, week or year of 2021 against their recorded volume in the corresponding period of a “normal” year, before the effects of the coronavirus (COVID-19) pandemic.
However, from mid-to-late March, this year-on-year approach to indexing will result in comparing 2021 observations against their levels after the onset of the pandemic. As a result, those indices would no longer be compared with a pre-pandemic baseline. To help with this issue, we will be making changes to the indexing of a number of indicators in future releases as follows:
Seated diners
We will publish revised indices from OpenTable, which ensure that seated diners are compared against a comparable period pre-pandemic. This methodology change will be made before the impact of the coronavirus begins to have an impact on the volume of 2020 seated diners.
Retail footfall
We will publish additional indices from Springboard comparing retail footfall against its level in the corresponding period of 2019, as well as 2020. This will allow us to analyse how retail footfall is faring compared with its level pre-pandemic in 2019, as well as against its level in 2020 when coronavirus restrictions were in place. We anticipate this change to be made sometime in April 2021.
Online job adverts
From 18 March 2021 onwards, we will publish Adzuna online job adverts by NUTS1 region and category, indexed to their weekly average level in February 2020. However, we will also continue to publish the current year-on-year index as part of the online job adverts dataset that accompanies the Faster indicators bulletin.
Nôl i'r tabl cynnwys
9. Social impact of the coronavirus
This section includes some provisional results from the Office for National Statistics (ONS) Opinions and Lifestyle Survey (OPN) covering the period 3 to 7 March 2021. The survey went out to 6,029 adults in Great Britain and had a response rate of 72%. Further information to help understand the impact of the coronavirus (COVID-19) pandemic on people, households and communities in Great Britain will be available in Coronavirus and the social impacts on Great Britain published on 12 March 2021.
Travelling to work
In the week ending 7 March 2021, the proportion of working adults in Great Britain who in the last seven days:
Shopping
Of the 94% of adults that reported they had left home in the last seven days, the proportion that did so to shop for food and medicine remained similar to the previous week at 76%.
The proportion of these adults who shopped for things other than food and medicine in the last seven days increased slightly compared with the previous week to 10%. This a continuation of small, gradual increases observed since the week ending 24 January 2021 when the corresponding figure was 5%. The generally low level coincides with the ongoing lockdowns throughout the UK.
Nôl i'r tabl cynnwys