Cynnwys
- Main points
- Latest indicators at a glance
- Business impact of the coronavirus
- Social impacts of the coronavirus on Great Britain
- OpenTable seated diner estimates
- Value Added Tax (VAT) returns
- Company incorporations and voluntary dissolution applications
- Online price change in the food and drink basket
- Online job adverts
- Footfall
- Roads and traffic camera data
- Shipping
- Data
- Glossary
- Measuring the data
- Strengths and limitations
- Related links
1. Main points
According to the Business Impact of Coronavirus (COVID-19) Survey, 77% of UK businesses are currently trading, with 14% of trading business’ workforce on furlough leave. See Section 3.
According to the latest Opinions and Lifestyle Survey, in the week ending 6 December 2020, the proportion of adults in Great Britain shopping for things other than basic necessities increased by five percentage points to 18%, as national restrictions in England eased and were replaced by a regionally tiered approach to restrictions part way through the week. See Section 4.
According to OpenTable data, on the weekend of 5 and 6 December 2020, seated diners in the UK increased to around 75% of their level last year, from 5% at the start of the week. See Section 5.
According to Value Added Tax (VAT) returns, there were 22,840 new VAT reporters during November 2020, which is below the level in November 2019 of 23,880 but above the 2015 to 2019 average of 20,908. See Section 6.
Overall prices of items in the food and drink basket were unchanged in the latest week. See Section 8.
Online UK job adverts decreased three percentage points in the latest week. See Section 9.
According to Springboard, in the week ending Sunday 6 December 2020, footfall increased in every UK region except Northern Ireland compared with the previous week. See Section 10.
According to the Department for Transport (DfT), on Monday 7 December 2020 the volume of all motor vehicle traffic increased seven percentage points compared with the previous week; estimates are now 13 percentage points below the levels seen in early February 2020. See Section 11.
Results presented throughout this bulletin are experimental and may be subject to revision.
2. Latest indicators at a glance
Embed code
Source: Office for National Statistics – Faster indicators
Nôl i'r tabl cynnwys5. OpenTable seated diner estimates
From this publication onwards, we will be including data from OpenTable. OpenTable is a provider of online restaurant reservations, and these data are publicly available in its The state of the restaurant industry dashboard.
These data show the impact of recent events and restrictions on the hospitality industry using a sample of restaurants on the OpenTable network across all channels: online reservations, phone reservations, and walk-ins.
Data show the percentage of seated diners when compared with the same day of the week from the same week in the previous year. For example, Tuesday of Week 11 2020 is compared with Tuesday of Week 11 2019.
Data for Manchester are only available from 9 November 2020.
Figure 3: On the weekend 5 and 6 December 2020, seated diners in the UK increased to around 75% of their level last year, from 5% at the start of the week (30 November 2020)
Percentage of seated diners, year-on-year comparison, 18 February 2020 to 6 December 2020, UK, London and Manchester
Source: OpenTable
Download this chart Figure 3: On the weekend 5 and 6 December 2020, seated diners in the UK increased to around 75% of their level last year, from 5% at the start of the week (30 November 2020)
Image .csv .xlsDuring the March 2020 UK lockdown, the percentage of seated diners in London and the UK fell to 0% of the level seen last year. Diners slowly returned as the UK moved out of lockdown in July 2020, with levels during the August Eat Out to Help Out scheme slowly increasing to 100% of the 2019 level. Care should be taken over the bank holiday of 31 August 2020, as this is compared with a non-bank holiday in 2019.
After national restrictions were reintroduced in England on 5 November 2020, the percentage of seated diners in London returned to around 0% and the percentage in the UK to around 10%. After the lifting of the national restrictions in England, the weekend of 5 and 6 December 2020 saw levels of around 65% in London and 75% in the UK. Manchester, under Tier 3 restrictions since the start of the series (9 November), has remained at 0% throughout.
Nôl i'r tabl cynnwys6. Value Added Tax (VAT) returns
New reporters
The new reporters index measures the number of UK firms sending VAT returns for the first time, which is related to the number of firm creations.
Figure 4: In November 2020, there were 22,840 new VAT reporters, which is below the level in November 2019 of 23,880 but above the 2015 to 2019 average of 20,908
The number of new firm reporters, January 2015 to November 2020, non-seasonally adjusted, UK
Source: Her Majesty’s Revenue and Customs (HMRC)
Download this chart Figure 4: In November 2020, there were 22,840 new VAT reporters, which is below the level in November 2019 of 23,880 but above the 2015 to 2019 average of 20,908
Image .csv .xlsBusiness VAT turnover estimates
Turnover diffusion indices are an aggregate measure used to track whether the majority of firms are reporting an increase or decrease in turnover in their VAT returns. They are calculated as the percentage of firms with increasing turnover minus the percentage with decreasing turnover.
The heatmap in Figure 5 is a visual way of showing the VAT diffusion indices based on the standard deviation from their historical 2008 to 2019 average. Larger deviations are more darkly coloured, with red representing a negative change, and teal a positive change when compared with the previous period.
The Monthly estimate of gross domestic product (GDP) for October 2020 was published earlier today (10 December 2020). November 2020 estimates of Retail sales in Great Britain will be published on 18 December 2020. It is important to note that the timely VAT indicators are not attempting to forecast or predict GDP or other headline economic statistics, and the indicators should not be interpreted in this way.
Figure 5: In October 2020, more UK firms have continued to report decreasing turnover than increasing turnover when compared with the same time a year ago
Heatmap of business turnover estimates, UK, diffusion index standard deviation from the mean, up to Quarter 3 (July to Sept) 2020 and October 2020. New reporters, UK, up to November 2020
Embed code
Source: Her Majesty’s Revenue and Customs
Notes:
- Agri - Agriculture, forestry and fishing, All - All industries, SA - Seasonally adjusted, NSA - Not seasonally adjusted. 2. All industries are unweighted: each firm contributing to the index has the same weight regardless of turnover, size or industry.
- The thresholds for the colours in the heatmap are based on standard deviations from the mean of the indicator between 2008 and 2019.
Figure 5 also shows that the month-on-year ago all-industry turnover estimate for October 2020 compared with October 2019 is negative 1.0 standard deviations below its historical average with a diffusion index of negative 0.04. This implies more businesses are seeing decreasing turnover than increasing turnover when compared with the same month a year ago.
Across all major industries (services, production, construction, agriculture), turnover estimates remained negative in October 2020 compared with October 2019. The production sector saw the largest reduction in turnover compared with October 2019, 2.1 standard deviations below its historical average (red) with a diffusion index of negative 0.17.
Figure 5 also shows the month-on-month all-industry turnover estimate for October 2020 compared with September 2020 was steady for a third consecutive month at 0.4 standard deviations above its historical 2008 to 2019 average (white), with a diffusion index of 0.01. In other words, out of the 36,570 firms which reported monthly turnover in October 2020, around 400 more firms saw their turnover increase than firms who saw their turnover decrease.
Please note the monthly and quarterly diffusion indices can exhibit different trends as only a subset of firms that contribute towards the monthly diffusion indices. Quarterly returns are allocated to the calendar quarter in which two or more of the months lie. For example, a quarterly return covering the period June 2020 to August 2020 will be allocated to Quarter 3 (July to Sept) 2020. At this stage of the quarterly data cycle, there is limited information about September 2020 feeding into the Quarter 3 (July to Sept) 2020 estimates.
For more information on how the quarterly reporting periods are derived, see VAT reporting periods in Section 2 of the VAT methodology article. The number of firms contributing towards each of the diffusion indices is published in the dataset.
Nôl i'r tabl cynnwys7. Company incorporations and voluntary dissolution applications
Incorporations
Figure 6: In the week ending Friday 4 December 2020, there were 14,888 company incorporations, an increase from the previous week and higher than the same week in the previous year (12,119)
Total weekly company incorporations, UK, from week ending Friday 4 January 2019 to week ending Friday 4 December 2020
Source: Companies House and Office for National Statistics
Notes:
- Week 1 refers to the period week ending 4 January 2019 and week ending 3 January 2020. Week 49 refers to the period week ending 29 November 2019 and week ending 4 December 2020.
- The dip in December 2019 is explained by two bank holidays in the week ending Friday 27 December 2019.
- Weekly data are for week commencing Saturday to Friday, as incorporation requests received on Saturdays and Sundays are typically processed on subsequent weekdays. For more information, see the accompanying Companies House methodology page.
Download this chart Figure 6: In the week ending Friday 4 December 2020, there were 14,888 company incorporations, an increase from the previous week and higher than the same week in the previous year (12,119)
Image .csv .xlsVoluntary dissolution applications
Figure 7: In the week ending Friday 4 December 2020, there were 5,809 voluntary dissolution applications, its highest in 2 months but lower than the same week in the previous year (6,048)
Total weekly company voluntary dissolution applications, UK, from week ending Friday 4 January 2019 to week ending Friday 4 December 2020
Source: Companies House and Office for National Statistics
Notes:
- Week 1 refers to the period week ending 4 January 2019 and week ending 3 January 2020. Week 49 refers to the period week ending 29 November 2019 and week ending 4 December 2020.
- The dip in December 2019 is explained by two bank holidays in the week ending Friday 27 December 2019.
- Weekly data are weeks from Saturday to Friday, as voluntary dissolution requests received on Saturdays and Sundays are typically processed on subsequent weekdays. For more information, see the accompanying Companies House methodology page.
- Increased Companies House operational activity during week ending 8 November 2019 caused a spike in total weekly company voluntary dissolution applications. This data point should be treated with caution.
Download this chart Figure 7: In the week ending Friday 4 December 2020, there were 5,809 voluntary dissolution applications, its highest in 2 months but lower than the same week in the previous year (6,048)
Image .csv .xlsFor more information on other measures of company closures not presented here, see Weekly indicators of company creations and closures from Companies House methodology: August 2020.
Nôl i'r tabl cynnwys8. Online price change in the food and drink basket
A timely indication of weekly online price change for a selection of food and drink products from several large UK retailers has been developed, covering the period 1 June to 6 December 2020. Details of the methodology used for these indicators can be found in Online price changes methodology. This analysis is experimental and should not be compared with our regular consumer price statistics.
The data time series, weekly growth rates, and contributions to the weekly change for all individual food and drink items, along with sample sizes, are published in a dataset alongside this release.
The overall prices of items in the online food and drink basket were unchanged between the week ending 29 November 2020 and the week ending 6 December 2020. Figure 8 presents the contributions to the latest weekly change from each of the main categories of items.
Figure 8: Overall prices of items in the food and drink basket were unchanged in the latest week
Contributions to online price change of a selection of food and drink products, UK, percentage point contributions to the percentage change between the week ending 29 November 2020 and the week ending 6 December 2020
Source: Office for National Statistics - Online price collection
Download this chart Figure 8: Overall prices of items in the food and drink basket were unchanged in the latest week
Image .csv .xlsOverall prices have remained unchanged because some product categories experienced price falls, while others experienced offsetting price rises. The main downwards contributor was spirits, which experienced a 1.8% price fall in the latest week. This detracted 0.09 percentage points from the overall price figure. The decline in the price of spirits was mostly because of falling prices of whisky, vodka and gin.
The main positive contributor came from bread and cereals, which saw prices rise by 0.6% and contributed 0.08 percentage points to the unchanged overall price. This was mainly from breakfast cereals, with a wide selection of retailers increasing their prices. A notable upward effect also came from dried potted snacks.
Figure 9, the data time series for the all-item index and some of the leading categories of the weekly change, shows that the all-item index has been on a broadly downward trend since the beginning of June 2020.
The price index of spirits has been more volatile, with this week’s large week-on-week price fall for the category furthering the downward trend that started in early October 2020. The fall in spirits prices could be caused by retailers continuing to offer discounts in time for Christmas.
Since the series began in June 2020, the milk, cheese and eggs category has experienced minor fluctuations but has almost always stayed within one percentage point of its starting position. The price index is now above where it was at the beginning of June 2020 for the second consecutive week.
Prices for bread and cereals showed a sizeable increase for the latest week, with its comparatively lower index over time mainly resulting from a steady declining pattern from June to September 2020. Despite its lower prices, the series has tended to behave similarly over time to milk, cheese and eggs.
Figure 9: The all-item index has remained below its initial level (first week in the series) for the entire data time series
Online price change of selected food and drink products: index week commencing 1 June 2020 = 100, UK
Source: Office for National Statistics - Online price collection
Notes:
- The time series for all individual food and drink items are published in a dataset alongside this release.
Download this chart Figure 9: The all-item index has remained below its initial level (first week in the series) for the entire data time series
Image .csv .xls9. Online job adverts
These figures use job adverts provided by Adzuna, an online job search engine, and include experimental estimates of online job adverts by Adzuna category and by UK country and NUTS1 region. The number of job adverts over time is an indicator of the demand for labour. The Adzuna categories used do not correspond to Standard Industrial Classification (SIC) categories, so these values are not directly comparable with the Office for National Statistics (ONS) Vacancy Survey.
Figure 10: Between 27 November and 4 December 2020, total UK online job adverts decreased by three percentage points to 74% of the level seen in the same week last year
Total weekly job adverts on Adzuna, UK, 4 January 2019 to 4 December 2020, percentage of level in same week of the previous year
Embed code
Notes:
- The observations were collected on a roughly weekly basis; however, before June 2020 they were not all observed at the same point in each week, leading to slightly irregular gaps between some observations.
- These series have a small number of missing weeks, mostly in late 2019, and the latest is in January 2020. These values have been imputed using linear interpolation. The data points that have been imputed are clearly marked in the accompanying dataset.
- Further category breakdowns are included in the Online job advert estimates dataset, and more details on the methodology can be found in Using Adzuna data to derive an indicator of weekly vacancies.
In the latest week, total UK online job adverts saw a weekly decrease of three percentage points to 74% of the level seen in the same week last year. “Catering and hospitality” saw a slight increase to 29% of online job adverts compared with last year. However, this remains the lowest comparable volume of all the categories.
Online job adverts in “healthcare” decreased by five percentage points compared with last week. It remains, however, the category with the highest volume compared with the same week last year, at 87%.
Excluding the “unknown” category, in comparison with the previous week, the number of online job adverts decreased in 20 of the 28 Adzuna categories and increased in the remaining eight categories. The largest weekly decrease came from “domestic help”, which fell by 22 percentage points, followed by “Transport, logistics and warehouse”, which decreased by 14 percentage points on the week.
“Wholesale and retail” saw the largest weekly increase by five percentage points to 62% of the volume seen in the same week in 2019. Please note the trends of all the categories discussed can be seen in the accompanying dataset.
Figure 11: Online job adverts for all UK regions decreased in the latest week
Total weekly job adverts on Adzuna, UK, 4 January 2019 to 4 December 2020, percentage of level in same week of the previous year
Embed code
Notes:
- There is a level shift in the Northern Ireland series from 17 October 2019 because a large source of Northern Ireland job adverts was removed, and another level shift from 7 August 2020 because of a new source being included.
- The October 2020 spike and most recent weekly increase in the Northern Ireland series should be treated with caution because of the increased coverage from a year ago.
In the latest week, the volume of job adverts decreased in all regions of the UK. London remains the region with the lowest volume of online job adverts compared with the same week in the previous year, having decreased to 60% of its level in the same period last year.
Nôl i'r tabl cynnwys10. Footfall
These figures are provided by Springboard, a provider of data on customer activity. They measure the volume of footfall compared with the same day the previous year at the overall level and across the categories of high streets, retail parks and shopping centres. For example, Sunday 6 December 2020 was compared with Sunday 1 December 2019.
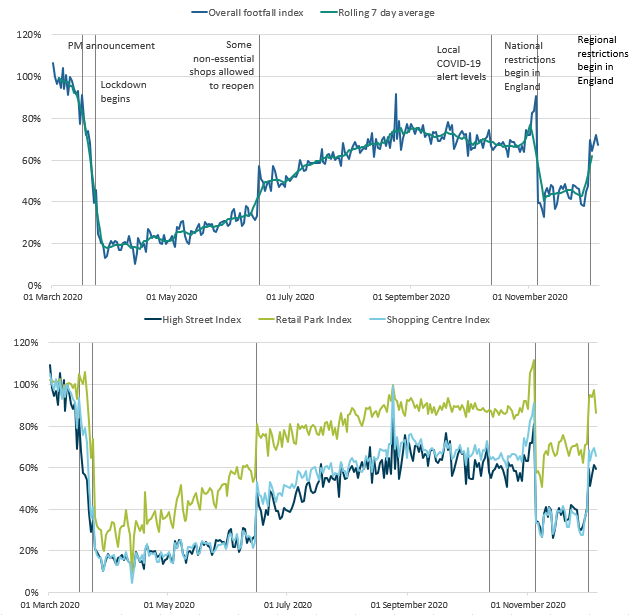
Figure 12: In the week ending 6 December 2020, overall UK footfall was at 62% of the level seen at the same time last year, an increase of 19 percentage points
Volume of footfall, year-on-year percentage change between footfall on the same day, UK, 1 March to 6 December 2020
Source: Springboard and the Department for Business, Energy and Industrial Strategy
Notes:
- “PM announcement” refers to the advisory announcement on 16 March 2020 to avoid non-essential travel, bars, restaurants and other indoor leisure venues, and to work from home if possible.
- The spike on Monday 24 August 2020 was caused by the comparison with 26 August 2019, which was bank holiday Monday with good weather. The bank holiday this year was a week later, on 31 August 2020.
- From Thursday 5 November until Tuesday 1 December 2020 inclusively, England entered a period of national restrictions which, among other measures, asked the public to stay at home except for specific purposes and closed certain businesses and venues. This includes pubs, bars, dine-in restaurants and non-essential retail.
- From Wednesday 2 December 2020, England introduced a regionally tiered approach to restrictions, where different tiers of measures applied in different parts of the country.
Download this image Figure 12: In the week ending 6 December 2020, overall UK footfall was at 62% of the level seen at the same time last year, an increase of 19 percentage points
.png (76.9 kB)
Figure 12 shows that in the latest week (week ending 6 December 2020), the overall seven-day average footfall increased substantially from the previous week by 19 percentage points to 62% of the level seen the same day last year. This is the highest level of footfall since the week ending 1 November 2020, before England entered its period of national restrictions.
As national restrictions in England eased, footfall across all retail locations in the UK increased substantially compared with the previous week, increasing by 25 percentage points in shopping centres to 59% of the level seen in the same week in 2019. Footfall in retail parks and high streets also increased substantially, with retail parks increasing by 18 percentage points to 87% of the level seen last year, while high streets saw an increase by 16 percentage points to 52%.
Please note: the national restrictions in England eased part way through the latest week. Early evidence suggests that footfall was relatively subdued in the early part of the week in comparison with footfall seen later in the week under England’s regionally tiered approach to restrictions, which allowed some non-essential shops to reopen in a number of regions.
Figure 13: On week ending Sunday 6 December 2020, weekly footfall had increased in every UK region except Northern Ireland, compared with last week
Overall volume of daily footfall, percentage change from the same day the previous year, UK, 1 March to 6 December 2020

Source: Springboard and the Department for Business, Energy and Industrial Strategy
Notes:
- From Thursday 5 November until Tuesday 1 December 2020, England entered a period of national restrictions which, among other measures, asked the public to stay at home, except for specific purposes, and closed certain businesses and venues. This included pubs, bars, dine-in restaurants and non-essential retail.
- From Wednesday 2 December 2020, England introduced a regionally tiered approach to restrictions, where different tiers of measures applied in different parts of the country.
Download this image Figure 13: On week ending Sunday 6 December 2020, weekly footfall had increased in every UK region except Northern Ireland, compared with last week
.png (103.0 kB)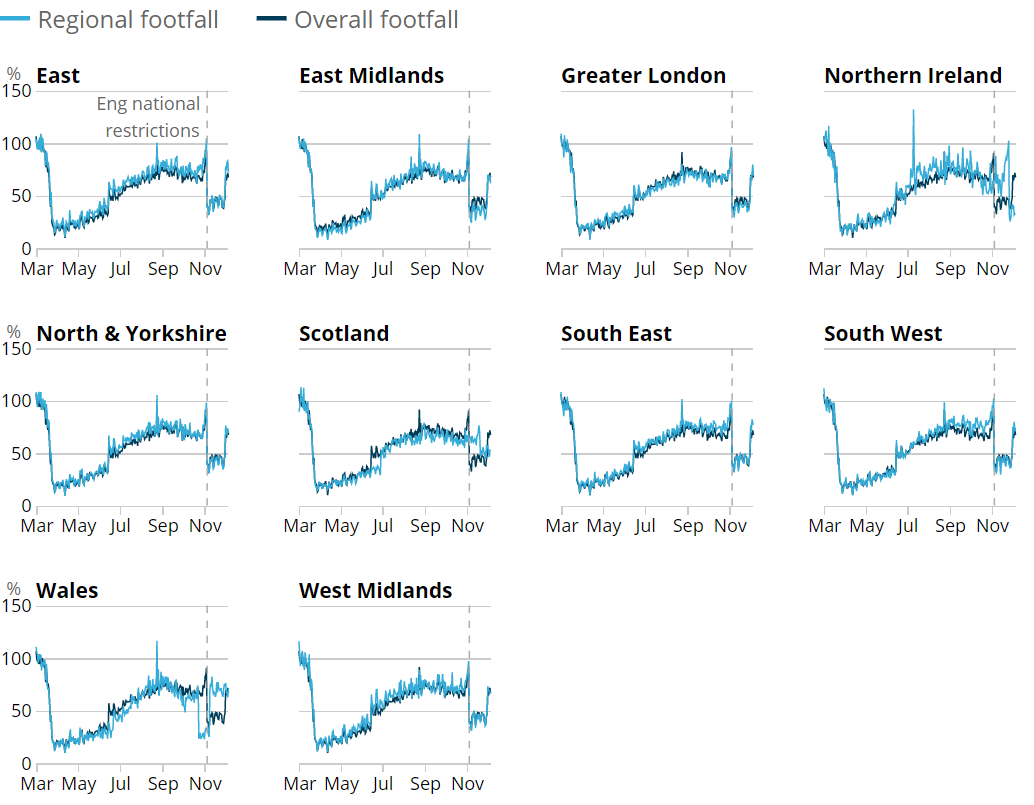
Figure 13 shows the volume of footfall in each English region and UK country compared with the same day the previous year. In the week ending 6 December 2020, footfall had increased across every English region and UK country compared with last week, except for Northern Ireland.
Northern Ireland saw a decrease of 28 percentage points to 36% of the level seen in the same week last year, the lowest level of all the UK countries and English regions.
The decrease in Northern Ireland coincides with the introduction of the country’s additional coronavirus (COVID-19) restrictions. Among the measures is the closure of all retail businesses except for essential retail.
In the latest week (week ending 6 December 2020), footfall in the East of England and South East England each increased substantially by 25 percentage points, to 70% and 69% of the levels seen in the same week in 2019 respectively, as the local tier systems came into effect in England.
Most of the local areas in these two regions are in Tier 2, which allowed most businesses and venues to continue to operate in a coronavirus-secure manner. Scotland and Wales each saw a slight increase of two percentage points in the level of footfall, to 53% and 70% respectively.
Scotland’s smaller increase in footfall compared with the English regions may be linked to the continuation of highest tier restrictions in some areas of Scotland.
A full list of national restrictions is available for England from the Department of Health and Social Care, for Scotland from the Scottish Government, for Wales the Welsh Government and for Northern Ireland from nidirect.
Nôl i'r tabl cynnwys11. Roads and traffic camera data
Road traffic in Great Britain
The Department for Transport (DfT) produces daily road traffic estimates using data from around 275 automatic traffic count sites across Great Britain covering all road types, published weekly.
The daily DfT estimates are indexed to the first week of February 2020 and the comparison is to the same day of the week. The data provided are useful as an indication of traffic change rather than actual traffic volumes.
More information on the methods, quality and economic analysis for these indicators can be found in the methodology article.
Figure 14: On Monday 7 December 2020, the volume of all motor vehicle traffic increased 7 percentage points compared with the previous week.
Daily road traffic index: 100 = same traffic as the equivalent day of the week in the first week of February, 1 March 2020 to 7 December 2020, non-seasonally adjusted, Great Britain
Source: Department for Transport road traffic statistics: management information
Notes:
- From Thursday 5 November until Tuesday 1 December 2020 inclusively, England entered a period of national restrictions which, among other measures, asked the public to stay at home except for specific purposes and closed certain businesses and venues. This includes pubs, bars, dine-in restaurants and non-essential retail.
- From Wednesday 2 December 2020, England introduced a regionally tiered approach to restrictions, where different tiers of measures applied in different parts of the country.
Download this chart Figure 14: On Monday 7 December 2020, the volume of all motor vehicle traffic increased 7 percentage points compared with the previous week.
Image .csv .xlsOn Monday 7 December 2020, road traffic levels across all vehicle categories increased compared with the previous week. This covers a period where England moved from national restrictions, including the previous Monday (30 November 2020), to a regionally tiered approach to restrictions, where different tiers of measures applied in different parts of the country. Total motor vehicle traffic was 13 percentage points lower than the first Monday in February 2020, and seven percentage points higher than the previous week.
Traffic volumes for cars increased by nine percentage points compared with the previous week with light commercial vehicles traffic increasing by seven percentage points and heavy goods vehicle traffic volumes broadly unchanged.
Other than heavy goods vehicles, traffic volumes in all vehicle categories remain lower than before 5 November 2020, when national restrictions began in England.
Traffic camera activity
Traffic cameras are a valuable source for understanding the level of activity in towns and cities as well as changing patterns of mobility. The UK has thousands of publicly accessible traffic cameras with providers ranging from national agencies to local authorities. Further information on the methodology used to produce these data is available in our methodology article and Data Science Campus blog.
In the accompanying dataset, the following categories are available as non-seasonally adjusted, seasonally adjusted and trend data:
- cars
- motorbikes (only available for London and the North East)
- buses
- trucks
- vans
- pedestrians and cyclists
The categories are available for the following regions, which give a broad coverage across the UK and represent a range of different-sized settlements in urban and rural settings:
Figure 15: In the week ending 6 December 2020, average counts of traffic camera activity for cars has increased in London and Greater Manchester compared with the previous week
Activity in selected areas, daily counts of cars, buses, pedestrians and cyclists, seasonally adjusted, March to December 2020, UK
Embed code
Notes:
- The regions shown here were selected to be representative of the regions available.
- Traffic camera images capture the appearance of buses, but they give no indication of the number of passengers using public transport.
- Pre-March 2020 lockdown averages are calculated from when the series started, 11 March to 22 March 2020 for London.
- Northern Ireland introduced a four week "circuit breaker" with additional restrictions on 16 October 2020 and additional Covid-19 restrictions from Friday 27 November 2020.
- From Thursday 5 November until Wednesday 2 December 2020, England entered a period of national restrictions which, among other measures, asked the public to stay at home, except for specific purposes, and closed certain businesses and venues. This included pubs, bars, dine-in restaurants and non-essential retail.
- From Wednesday 2 December 2020, England introduced a regionally tiered approach to restrictions, where different tiers of measures applied in different parts of the country.
In London in the latest week, average counts of car, truck and van traffic camera activity increased when compared with the previous week. Conversely, pedestrian and cyclist traffic are 12% below levels seen the previous week, while buses remained stable.
In Greater Manchester, counts of all traffic except buses increased compared with the previous week. Pedestrians and cyclists increased by 10%, cars and vans increased by 5% and trucks by 6%.
In Northern Ireland, all categories of road traffic camera activity have decreased except buses, with pedestrian and cyclist traffic at 60% of levels seen the previous week. This can be explained by additional coronavirus (COVID-19) restrictions that came into effect on Friday 27 November 2020.
Nôl i'r tabl cynnwys12. Shipping
These shipping indicators are based on counts of all vessels, cargo and tanker vessels and passenger vessels. As discussed in Faster indicators of UK economic activity: shipping, we expect the shipping indicators to be related to the import and export of goods.
Figure 16: In the week ending 6 December, the average number of daily ships visits in the UK decreased to 282 visits from 298 in the previous week
Daily movements in shipping visits, UK, seasonally adjusted, 1 January 2020 to 6 December 2020
Source: exactEarth
Download this chart Figure 16: In the week ending 6 December, the average number of daily ships visits in the UK decreased to 282 visits from 298 in the previous week
Image .csv .xls
Figure 17: In the week ending 6 December 2020, the number of daily cargo ship visits in the UK remained similar to the previous week at an average of 98 visits
Daily movements in shipping visits, UK, seasonally adjusted, 1 January to 6 December 2020
Source: exactEarth
Notes:
- The vertical lines indicate important events. In order, the events are: Storm Ciara; FCO advises against all non-essential international travel; March 2020 lockdown begins; UK international travel quarantine begins; travel corridors to 59 countries come into force; Storm Ellen; Storm Francis; Storm Alex; Storm Aiden.
- The number of visits for Hull are included in these data from 1 June 2020 onwards.
- The seasonally adjusted estimates are produced using a modified version of the seasonal adjustment method TRAMO-SEATS. More information is available in the Coronavirus and the latest indicators for the UK economy and society methodology.
- The seasonal adjustment method may be limited as this is a short time series.
- Daily and weekly shipping visits and unique visits are available by port in the dataset, along with non-seasonally adjusted aggregate series.
- The trend is now calculated as a rolling seven-day average of the number of daily ship and cargo ship visits.
Download this chart Figure 17: In the week ending 6 December 2020, the number of daily cargo ship visits in the UK remained similar to the previous week at an average of 98 visits
Image .csv .xls13. Data
Weekly and daily shipping indicators
Dataset | Released 10 December 2020
The weekly and daily shipping indicators dataset associated with the faster indicators of UK economic activity.
Online job advert estimates
Dataset | Released 10 December 2020
Experimental job advert indices covering the UK job market.
Traffic camera activity
Dataset | Released 10 December 2020
Experimental dataset for busyness indices covering the UK.
Online weekly price changes
Dataset | Released 10 December 2020
The online price changes for a selection of food and drink products from several large UK retailers. These data are experimental estimates developed to deliver timely indicators to help understand the impact of the coronavirus (COVID-19) pandemic.
Economic activity, faster indicators, UK
Dataset | Released 10 December 2020
Data on road traffic and Value Added Tax (VAT) data from HM Revenue and Customs (HMRC).
14. Glossary
Company incorporations
Incorporations are when a company is added to the Companies House register of limited companies. This can also include where an existing business applies to become a limited company, where it was not one before.
Diffusion index
The diffusion index tracks the growth in turnover and expenditure of firms. It is constructed to lie between negative one and one. For example, if 65% of firms have increasing turnover, 30% have decreasing turnover and 5% turnover remains unchanged, then the diffusion index is 0.35.
Faster indicator
A faster indicator provides insights into economic activity using close-to-real-time big data, administrative data sources, rapid response surveys or Experimental Statistics, which represent useful economic and social concepts.
New reporter
A new reporter is defined as a firm with a VAT reference (that is, firm identification number) which has not previously reported its VAT returns. New reporters are published within one month of the end of the reporting period.
The new reporting behaviour measure is classified by the month the data were received by HMRC, known as the receipt date, which is not necessarily the same as the reference period (the period for which the VAT return is made).
Businesses must register for VAT with HM Revenue and Customs (HMRC) if its VAT taxable turnover, that is, the total value of everything it sells that is not exempt from VAT, is more than £85,000 in a rolling 12-month period. As such, the number of new reporters detailed here are not directly comparable with the number of company incorporations shown in our section on Companies House data, which shows when a company is added to the Companies House register of limited companies. (LINK)
For more information please see the methodology article on Value Added Tax returns.
Voluntary dissolution applications
A voluntary dissolution application is when a company applies to begin dissolution proceedings. As such, they effectively chose to be removed from the Companies House register. For a company to be eligible to voluntarily dissolve, it should not have completed any trading activity for a period of three months.
Nôl i'r tabl cynnwys15. Measuring the data
Detailed information on the data sources, quality and methodology of the different indicators included in this bulletin is available in the Coronavirus and the latest indicators of the UK economy and society methodology.
We will summarise any crucial updates to the quality or methodology in this section in the future.
Nôl i'r tabl cynnwys16. Strengths and limitations
Detailed information on the strengths and limitations of the different indicators included in this bulletin is available in the Coronavirus and the latest indicators of the UK economy and society methodology.
We will summarise any crucial updates or warnings in this section in the future.
Nôl i'r tabl cynnwys
4. Social impacts of the coronavirus on Great Britain
This section includes some headline results from Wave 36 of the Opinions and Lifestyle Survey (OPN) covering the period 2 to 6 December 2020.
Travelling to work
In the week ending 6 December 2020, the proportion of working adults in Great Britain who:
Shopping
The proportion of adults who shopped for food and medicine has increased to 77%, an increase of four percentage points from the previous week and the highest since June 2020.
The proportion of adults who shopped for things other than food and medicine increased by five percentage points from the previous week to 18 percentage points. This increase follows a recent downward trend and could be attributed to the easing of national restrictions in England, which allowed some non-essential shops to reopen in a number of regions.
Face coverings
The proportion of adults who have used a face covering stayed the same as the previous week, at 97%. Further breakdowns such as the situations when a face covering was worn (for example, while shopping) and by the Great Britain countries, will be available in Coronavirus and the social impacts on Great Britain published on 11 December 2020.
Figure 2: In the week ending 6 December 2020, the proportion of adults in Great Britain shopping for things other than basic necessities increased by 5 percentage points to 18%
Proportion of adults, Great Britain, 14 May to 6 December 2020
Source: Office for National Statistics - Opinions and Lifestyle Survey
Notes:
Download this chart Figure 2: In the week ending 6 December 2020, the proportion of adults in Great Britain shopping for things other than basic necessities increased by 5 percentage points to 18%
Image .csv .xls