1. Main points
This analysis covers the period from 1 September 2020 to 7 January 2021. During this period of time, there was a national lockdown in England between 5 November and 1 December 2020 and varying local tier restrictions in place; there was also a significant rise in the positivity rate across the country, including that related to the new variant. This analysis should be understood in that context as opposed to the reducing prevalence currently being experienced.
The general contact individuals have with others both in and out of work will contribute to their likelihood of testing positive. Within every occupation group, there were people who were working from home, some who found social distancing at work easy and those who found it hard. These factors in part explain the differences in testing positive between occupations.
After adjusting for differences across occupations and reported ability to socially distance in the workplace and work from home, there was no statistical evidence of a difference in the likelihood of testing positive for the coronavirus (COVID-19) between the majority of occupations. For nearly all occupations there is no statistical evidence of difference with at least 15 of the other 24 occupation groups.
This analysis shows that for 25 occupations, the likelihood of testing positive for COVID-19 at some time between 1 September 2020 and 7 January 2021 ranged from 2.1% to 4.8.% and that the different occupations were largely distributed uniformly across this continuum. The mean likelihood of testing positive for COVID-19 across the 25 occupations was 3.9%, and over half of these occupations had likelihoods of testing positive at some time between 1 September 2020 and 7 January 2021 of between 3.5% and 4.2%.
Pairwise comparisons of the probability of testing positive between individual occupations show that there is no difference between the majority of occupations. To illustrate this a matrix of the comparison between each occupation with every other occupation is presented. This shows that 226 of the 300 comparisons were not significant.
Evidence of difference presents as a continuum, which can be seen in the comparisons between different occupations. Within this, there are a group of occupations at the upper end of the continuum, that have no significant difference with the majority of other occupations, but do show a higher probability of testing positive compared with some of those at the lower end. At the upper end are caring personal service occupations, protective service occupations, teaching and other education professionals, secretarial and related occupations, and other managers and proprietors; while at the lower end are skilled agricultural and related trades; science, research, engineering and technology professionals; business, media and public service professionals; textiles, printing and other skilled trades.
This is the first stage in an analysis to explore the impact of occupation. We welcome input and dialogue from users on its benefit and how we can continue to explore our data. We will continue to publish here and in academic journals.
2. Overview
This analysis covers the period from 1 September 2020 to 7 January 2021, using results from the Coronavirus (COVID-19) Infection Survey (CIS). During this period, there were rising infection rates, including a new variant and there was a national lockdown in England between 5 November and 1 December 2020. There were also varying localised tier restrictions in place across occupations over this period.
Occupational risks are interlinked with a wide variety of other factors such as household size, socio-economic status and existing co-morbidities. This analysis is a contribution to the important and growing understanding of risks associated with testing positive for COVID-19.
The general contact individuals have with others both inside and outside of work will contribute to their likelihood of testing positive.
Interventions including working from home, social distancing at work and wearing face coverings at work have been put into place to reduce the spread of the coronavirus. Within every occupation group, some people were able to work from home, others found social distancing at work easy, while others found it difficult to do so. It is important to account for these differences in this analysis because it adjusts for the fact that different occupations have different abilities to work from home and use distancing at work to reduce transmission. The analysis uses self-reported data to do this.
This analysis looks at variation in the likelihood of testing positive between occupation groups after adjusting for differences in age, sex, region, the interaction between region and ethnicity, household size, multigenerational households, index of multiple deprivation, ease of social distancing in the workplace and ability to work from home.
After adjusting for differences across occupations in their ability to socially distance in the workplace and work from home, there was no statistical evidence of a difference in the likelihood of testing positive for COVID-19 between the majority of occupations.
This finding is consistent with the fact that testing positive is affected by many complex and interlinked factors, including number, nature and breadth of contacts encountered in the workplace. While each occupation is likely to be affected to a varying degree by these factors, positivity is also influenced by behaviours conducted outside of the work boundary. Adding to the complexity is that during this period of analysis some occupations were in industries where working occurred both at home and at a workplace. We have been able to adjust for some of these complexities, but not all.
After controlling for demographic factors and general contact, the estimated probabilities of contracting COVID-19 during the time period under study were calculated for each occupation. There was a continuum of estimated probabilities with relatively small differences between each occupation. In the main, the estimated probabilities were not significantly different to each other, although some occupations at the upper end of the estimated probability continuum were statistically significantly different to some at the lower end. Those occupations at the upper end were protective service occupations, caring personal service occupations, teaching and other educational professionals, other managers and proprietors, and secretarial and related occupations, while those at the lower end were skilled agricultural and related trades; science, research, engineering and technology professionals; business, media and public service professionals; and textiles, printing and other skilled trades.
For example, for people in protective service occupations, we see they have a higher likelihood of testing positive compared with 9 other occupations. There is no statistical evidence of a difference with the remaining 15 occupations. Further details of these findings and supporting evidence are shown in the following sections and in the accompanying datasets.
More about coronavirus
- Find the latest on coronavirus (COVID-19) in the UK.
- Explore the latest coronavirus data from the ONS and other sources.
- All ONS analysis, summarised in our coronavirus roundup.
- View all coronavirus data.
- Find out how we are working safely in our studies and surveys.
3. Likelihood of testing positive for COVID-19 by occupation
About this analysis
This analysis is based on self-reported occupation. Occupation data are based on Standard Occupational Classification (SOC) and relate to the self-reported role indicated by the survey respondents, for example, skilled metal, electrical and electronic trades.
The analysis uses a logistic regression model adjusting for age, sex, region, the interaction between region and ethnicity, household size, multigenerational households, index of multiple deprivation, face coverings, working from home and, in those not working from home, ease of distancing at work. This model helps understanding of the link between occupation and testing positive for the coronavirus (COVID-19) when adjusting for these factors.
The model includes data from England for the period 1 September 2020 to 7 January 2021. It considers whether people ever tested positive or always tested negative on swab tests during the period outlined and only includes working age adults (those aged 16 to 74 years) in work.
All analyses are unweighted because they condition on these other factors.
It is important to note that when attributing the likelihood of testing positive for COVID-19 to occupation, the complexity of the likelihood of transmission in that occupation needs to be considered. There are many elements that will contribute to an individual’s likelihood of testing positive, including factors unrelated to work. As such, this analysis does not assess where transmission occurs. It is also important to note that across this time period, different interventions were in place across occupations, which also varied by region.
In this analysis, the assessment of statistical evidence is based on the comparison between occupations in the logistic regression model. There is statistical evidence of a difference between two occupations if the 95% confidence interval around the difference does not overlap with zero. These tests can also be accumulated across occupations to assess whether there is statistical evidence of an overall effect of a factor with several occupations. Because these results are from a sample survey, sometimes differences can be because of chance.
Statistical evidence of difference only assesses the degree to which the differences observed are because of chance given the numbers studied; it does not imply anything about the size of the differences. A difference can be supported by statistical evidence but can be small in size. This statistical test used to determine differences between pairs of occupations identifies strong (p is less than or equal to 0.01) and limited (p is less than or equal to 0.05) evidence of difference. This is a more precise method than comparing overlapping confidence intervals of the probabilities for each occupation.
Caution should be taken when considering the conclusions drawn from this analysis, as many of the occupations have lower sample sizes relative to others.
To aid interpretation, rather than presenting results as odds ratios from the logistic model, we present results as overall probabilities that participants will test positive over the period included in the analyses, averaged over their other characteristics. Uncertainty in these estimated probabilities is estimated using an approximate method, and the 95% confidence intervals around these probabilities are not the same as the comparisons within the models themselves on which our assessment of statistical evidence is based.
Analysis of people testing positive for COVID-19 by occupation
Across 25 occupations, the likelihood of testing positive for COVID-19 between 1 September 2020 and 7 January 2021 ranged from 2.1% to 4.8%. The average likelihood across the 25 occupations was 3.9%, and over half of these occupations had likelihoods between 3.5% and 4.2%.
Figure 1: The likelihood of testing positive for the coronavirus (COVID-19) varies across occupations
Likelihood of testing positive for COVID-19 by occupation, based on model adjusting for demographics, ease of social distancing at work, use of face coverings at work and working at home or elsewhere, 1 September 2020 to 7 January 2021, England
Brackets indicate occupations that are unlikely to have evidence of difference in the probability of people testing positive compared to many other occupations in the same bracket.
Embed code
Notes:
- These results are provisional and subject to revision.
- These statistics refer to infections reported in the community, by which we mean private households. These figures exclude infections reported in hospitals, care homes or other institutional settings.
- Predicted likelihood calculated using a logistic regression model controlling for: age, sex, region, ethnicity, household size, multigenerational household status, index of multiple deprivation, occupation, face coverings, work from home, and in those not working from home, ease of ability to socially distance in the workplace.
- Some occupation names have been shortened. Full names are included in the data download.
Download the data
While these differences are relatively small, after adjusting for differences across occupations in the ability to distance socially in the workplace, and to work from home, there was statistical evidence of a difference in the likelihood of testing positive for COVID-19 between some occupations (74 of 300 possible differences).
Strong, limited and no evidence of a difference between occupations adjusting for these factors is shown in the accompanying datasets. The tables in these datasets show that for the majority of comparisons, there is no difference in the risk of testing positive for COVID-19. However, groupings of some occupations are similar in their likelihoods of people testing positive.
Statistical pairwise tests have been used to determine strong (p is less than or equal to 0.01) and limited (p is less than or equal to 0.05) evidence of differences between occupations. This testing is a more robust method than comparing overlapping confidence intervals of the estimated probabilities and has produced a continuum of statistical evidence, from strongest to weakest.
This continuum of strength of evidence across all 25 occupational categories can be seen in Figure 2 and in Table 2b in the accompanying datasets. The testing shows the distinction where stronger evidence of difference can be seen and where the evidence is less statistically strong. It is important to note that despite the difference in evidential power, the range between all occupation groups remains small, therefore the degree of overlap between occupational groups is high. It should be noted that in Figure 2 the upper half of the matrix is the mirror image of the lower half.
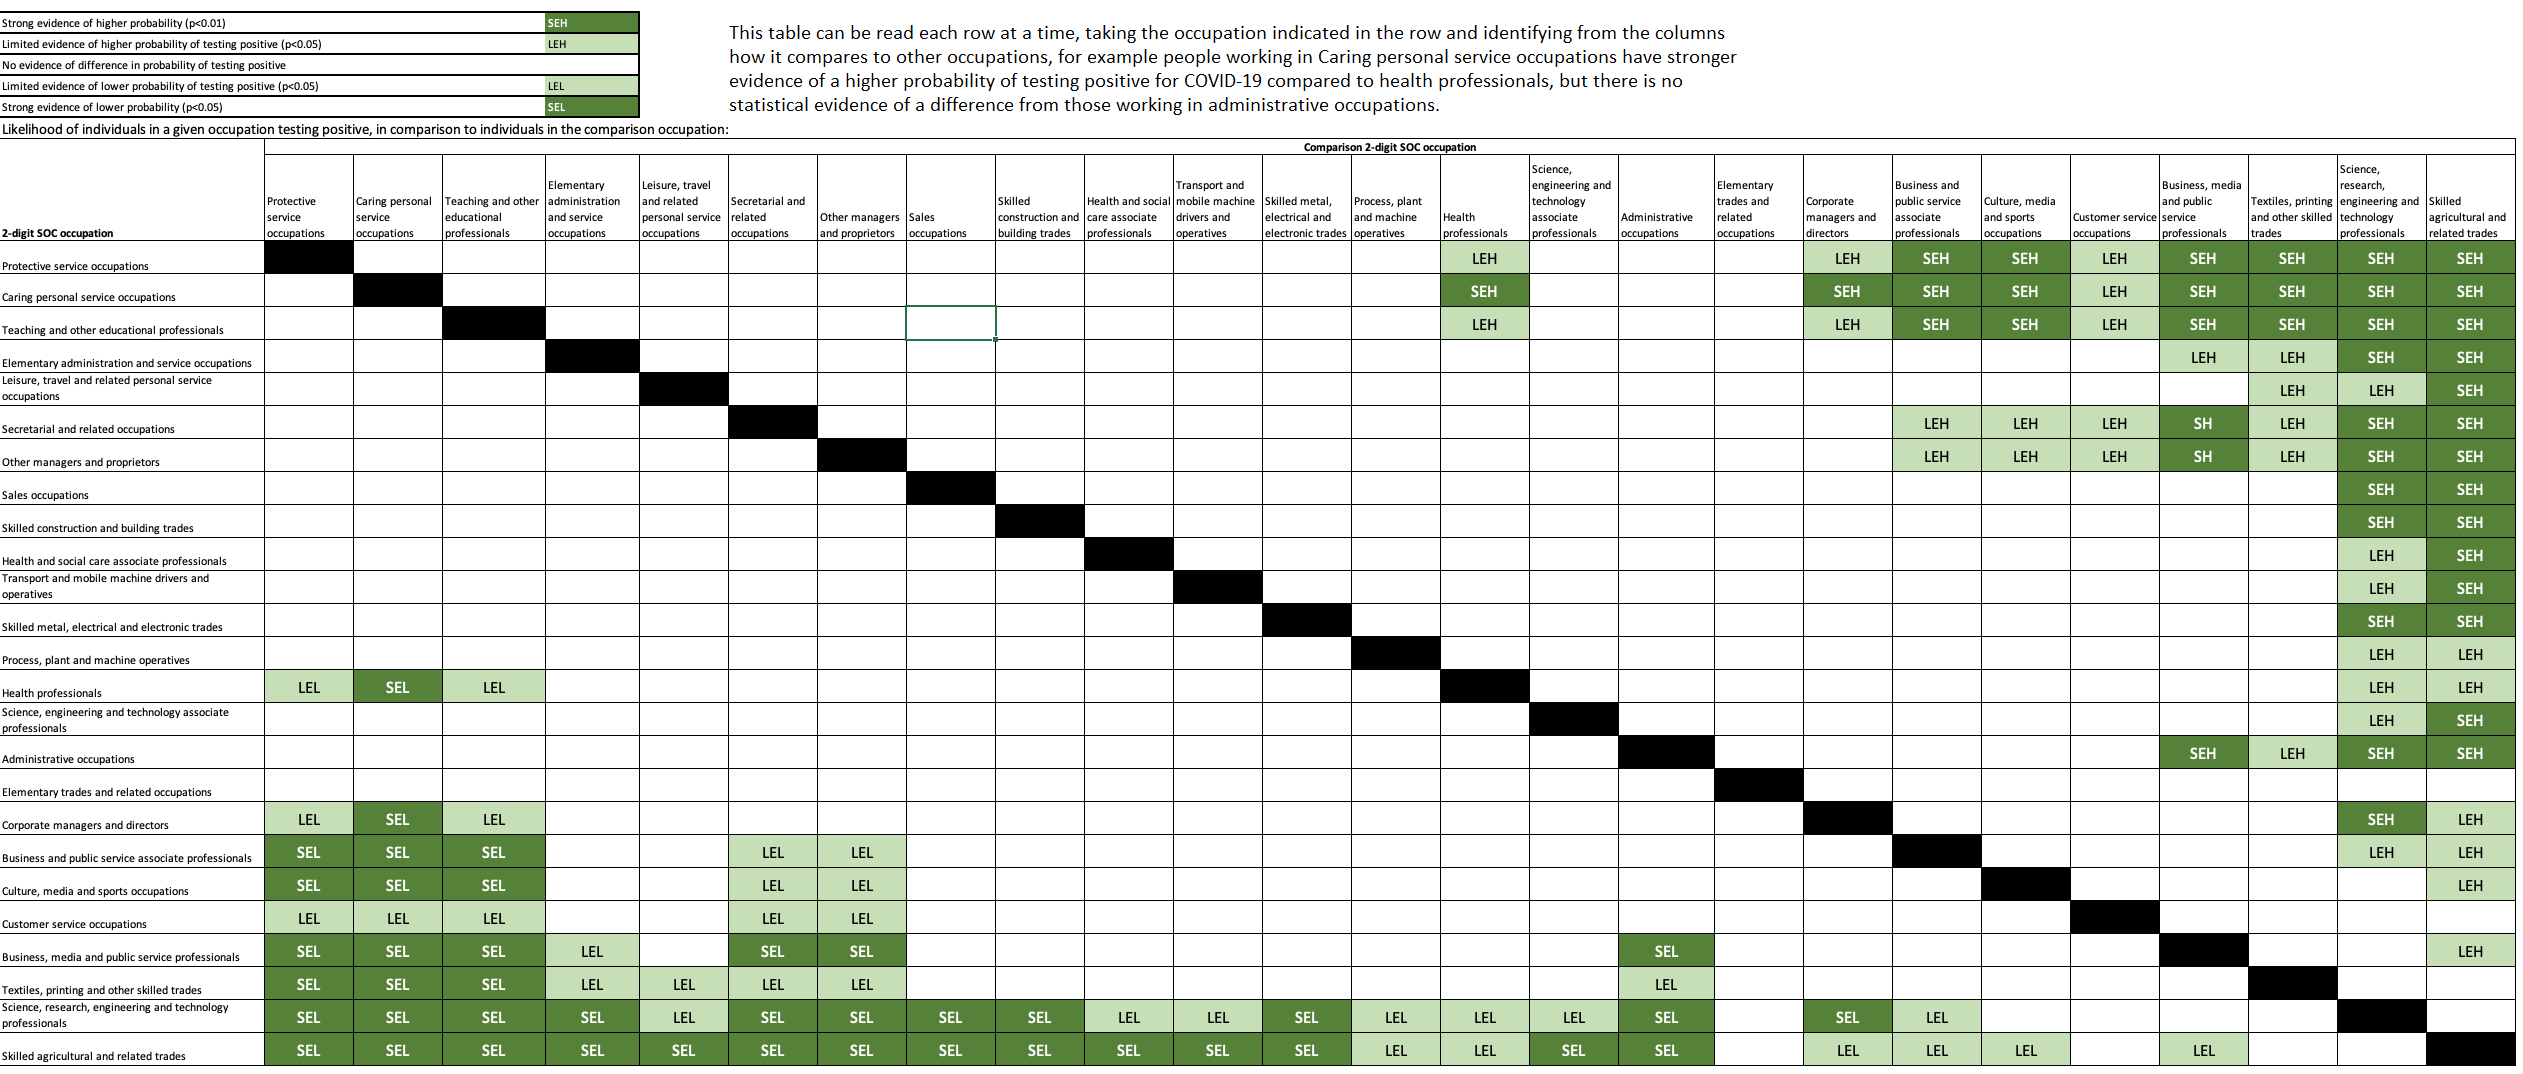
Figure 2: The majority of comparisons between occupations show no difference in their likelihood of testing positive
Strength of the likelihood of testing positive for the coronavirus (COVID-19) by occupation, adjusting for work location and ability to social distance, 1 September 2020 to 7 January 2021, England
Source: Office for National Statistics – Coronavirus (COVID-19) Infection Survey
Download this image Figure 2: The majority of comparisons between occupations show no difference in their likelihood of testing positive
.png (167.4 kB)
Notes:
- Predicted likelihood calculated using a logistic regression model controlling for age, sex, region, ethnicity, household size, multigenerational household status, index of multiple deprivation, occupation, face coverings, work from home, and in those not working from home, ease of ability to socially distance in the workplace.
- This table can be read each row at a time, taking the occupation indicated in the row and identifying from the columns how it compares to other occupations, for example people working in Caring personal service occupations have stronger evidence of a higher probability of testing positive for COVID-19 compared to health professionals, but there is no statistical evidence of a difference from those working in administrative occupations.
- This chart can be found in Table 2b of the accompanying dataset.
The majority of occupations emerged with a modelled probability of testing positive between 1 in 20 and 1 in 35; that is a 4.2% to 3.3% chance of positivity, which represents the probability of testing positive for COVID-19 over the time period. For nearly all occupations there is no statistical evidence of difference with at least 15 of the other 24 occupation groups. the 25 occupations, there is no statistical evidence of a difference with at least 15 of the other 24 occupations.
Within the continuum of results, the occupations towards the higher end of the range were: caring personal service occupations, protective service occupations, teaching and other education professionals, secretarial and related occupations, and other managers and proprietors.
These occupations had probabilities that were statistically significantly higher than some at the lower end but were not statistically significantly different to those in the middle of the range. Those occupations at the lower end of the range were: skilled agricultural and related trades; science, research, engineering and technology professionals; business, media and public service professionals; and textiles, printing and other skilled trades.
It is important to note that this probability is the probability of testing positive at some point in the study and is not necessarily generalisable to the current pandemic conditions. It does support other recent findings including Murti and others (2020, COVID-19 workplace outbreaks by industry sector and their associated household transmission, Ontario, Canada), that demonstrate the link between ease of social distancing and other NPIs and risk of acquiring COVID-19.
We have previously published analysis on the number of school workers, key workers and other professions in England who had COVID-19 from 2 September 2020 to 16 October 2020. This analysis did not find statistical evidence of a difference in the positivity rate between primary and secondary school teachers, other key workers and other professions.
The conclusions of the analysis published in November 2020 remain correct as our assessment at the time. The analyses in this article use a different and longer period of time from 1 September 2020 to 7 January 2021, where there were many more cases within the community, a growing infection rate and the new UK variant was in circulation. There were also different interventions in place over the period of this latest analysis, which were not in place during September and the start of October 2020. The increased amount of data has allowed us to improve the methodology in this analysis.
Our analysis is part of a wider suite of analyses to examine the risk of COVID-19 through the lens of occupation. In May 2020, an article explored which occupations had the highest potential exposure to COVID-19, which took into account what attempts were being made to contain the coronavirus in the workplace. In January 2021, we published our latest estimates of mortality by occupation groups. This showed that nurses had statistically significantly higher rates of death involving COVID-19 among those of the same age and sex in the population. It also shows that rates of death involving COVID-19 in teaching and educational professionals, such as secondary school teachers, were not statistically significantly raised when comparing the rates seen in the population among those of the same age and sex.
We will continue to explore the link between COVID-19 positivity and occupation, in addition to other variables relevant to daily life.
We are reviewing how we might best assess the impact of COVID-19 on different work sectors. Work sector refers to the broad work area, for example, manufacturing and construction. Sector has greater variability than might be initially expected, with different types of occupation within the same sector, and occupations will be included in several sectors. For example, every sector is likely to include accountants, maintenance, catering roles and others. We will continue to undertake analysis on this.
Nôl i'r tabl cynnwys4. Percentage of people testing positive for COVID-19 by 2-digit and 4-digit SOC occupation
In our accompanying datasets we have also included the percentage of individuals working in different occupations who tested positive for the coronavirus (COVID-19) between 1 September 2020 and 7 January 2021 in this study.
In coding occupations using Standard Occupational Classification codes, we had enough detail from the write-in responses to code to a level, for example, of transport operatives but not enough detail to say, for example, whether someone is a van driver or lorry driver. This means when analysing at 2-digit level we have more data across the 25 occupational categories, but at a 4-digit level we have less data and many more occupational categories.
This analysis is unweighted and does not control for the effects of the variables in the previous section. There are many factors associated with occupation that can affect the numbers of people testing positive for COVID-19 that are unrelated to the occupation that someone works in. For example, some occupations are more likely to be held by people of particular ages. Other occupations may be more common in particular regions of the country.
Infection levels vary among people of different age groups and in different regions for a variety of factors (for example, likelihood of living with others and population density). While results are available in the datasets accompanying this release, caution should be taken about any conclusions drawn based on raw data alone.
There is substantial variation in the percentage testing positive for COVID-19 in the period assessed, as would be expected in these raw data.
Sample sizes were small in some categories and confidence intervals are wide. Overlapping confidence intervals indicate there may not be statistical evidence of a difference between occupations.
Nôl i'r tabl cynnwys6. Collaboration

The Coronavirus (COVID-19) Infection Survey analysis was produced by the Office for National Statistics (ONS) in partnership with the University of Oxford, the University of Manchester, Public Health England and Wellcome Trust. Of particular note are:
- Sarah Walker – University of Oxford, Nuffield Department for Medicine: Professor of Medical Statistics and Epidemiology and Study Chief Investigator
- Koen Pouwels – University of Oxford, Health Economics Research Centre, Nuffield Department of Population Health: Senior Researcher in Biostatistics and Health Economics
- Thomas House – University of Manchester, Department of Mathematics: Reader in mathematical statistics
Acknowledgements
The Authors would like to thank the following individuals, which include both external collaborators and internal ONS teams, and acknowledge their contribution made to these articles:
University of Oxford – Sarah Walker, Koen Pouwels, Emma Pritchard
ONS COVID-19 Infection Survey coding team – Heledd Thomas, Joe Jenkins, Hannah Teare
ONS COVID-19 Infection Survey dissemination team – Hannah Donnarumma, Byron Davies, Alice McTiernan, Kyle Knights, George Feldman
Nôl i'r tabl cynnwys7. Glossary
Confidence interval
A confidence interval gives an indication of the degree of uncertainty of an estimate, showing the precision of a sample estimate. The 95% confidence intervals are calculated so that if we repeated the study many times, 95% of the time the true unknown value would lie between the lower and upper confidence limits. A wider interval indicates more uncertainty in the estimate. Overlapping confidence intervals indicate that there may not be a true difference between two estimates.
For more information, see our methodology page on statistical uncertainty.
Embed code
Manylion cyswllt ar gyfer y Erthygl
infection.survey.analysis@ons.gov.uk
Ffôn: +44 (0)1329 447683