Cynnwys
- Main points
- Statistician’s Quote
- Things you need to know
- How have we defined avoidable mortality?
- Nearly a quarter of all deaths in 2014 (23%) were from avoidable causes
- Neoplasms were the leading cause of avoidable deaths in 2014
- Cardiovascular disease caused 44% of all deaths from conditions amenable to healthcare
- Neoplasms caused 40% of all deaths from preventable conditions
- Avoidable mortality rates were significantly lower when ischaemic heart disease was excluded
- Avoidable mortality rates higher in Wales than in England
- The North East had highest avoidable mortality rates
- Almost a third of deaths in children and young people were from avoidable causes
- The highest number of avoidable deaths in children and young people were from accidental injuries
- Avoidable deaths resulted in an average loss of 23 years of life
- What has changed within this publication?
- Concept of avoidable mortality
- Quality and methodology
- Results
- References
- Methodoleg
1. Main points
In 2014, nearly a quarter of all deaths (23%; 116,489 out of 501,424) in England and Wales were from causes considered potentially avoidable through timely and effective healthcare or public health interventions.
Males accounted for approximately 60% of all avoidable deaths.
Avoidable mortality rates were significantly higher in Wales than in England. In England, the North East had the highest avoidable mortality rate while the South East had the lowest.
Neoplasms (cancers and non-cancerous abnormal tissue growths) were the leading cause of avoidable deaths accounting for 35% of all avoidable deaths in England and Wales in 2014.
Almost a third (32%; 1,443 out of 4,571) of all deaths of children and young people (aged 0 to 19 years) were from avoidable causes.
The highest number of avoidable deaths in children and young people in England and Wales in 2014 were from accidental injuries (14%; 195 out of the 1,443 avoidable deaths in this age group).
Nôl i'r tabl cynnwys2. Statistician’s Quote
“People who die prematurely from avoidable causes lose an average of 23 potential years of life. For children and young people, this figure rises to 72 years. The biggest contributors to avoidable deaths are chronic illnesses such as cancer and heart disease. In contrast, accidental injuries and complications surrounding childbirth are the biggest killers of children and young people.”
Anne Campbell, Mortality Analysis Team, Office for National Statistics
Nôl i'r tabl cynnwys3. Things you need to know
Figures are presented for causes of death that are considered avoidable in the presence of timely and effective healthcare or public health interventions (avoidable mortality).
We have revised our definition of avoidable mortality and also developed an avoidable mortality definition for children and young people. Further information about these definitions is available on the consultation page of our website.
With advances in medical technology and wider public health interventions, deaths from a condition which was previously not avoidable may have since become avoidable. This means that when the list of avoidable causes of death is updated, it may not be appropriate to produce previously published data using the revised avoidable mortality definition. For this reason, data presented in this bulletin are for 2014 only – the latest data year available. Previously published data have not been reproduced using the revised avoidable mortality definition.
While a particular condition can be considered avoidable, this doesn’t mean that every death from that condition could be prevented. This is because factors such as the lifestyle and age of the patient, the extent of disease progression at diagnosis and the potential existence of other medical conditions are not taken into account when making a list of causes.
For most of the causes of death included in our definition there is an upper age limit of 74 years. This is because deaths at older ages are often difficult to attribute definitively to a single underlying cause and the chances of death are more affected by coexisting medical conditions and other factors.
Avoidable mortality was not intended to serve as a definitive source of evidence of differences in effectiveness of healthcare systems. It was designed to highlight areas of potential weaknesses in healthcare that could benefit from further in-depth investigation. Therefore, a degree of caution is recommended when interpreting the data.
Nôl i'r tabl cynnwys4. How have we defined avoidable mortality?
Amenable mortality:
- a death is amenable (treatable) if, in the light of medical knowledge and technology at the time of death, all or most deaths from that cause (subject to age limits if appropriate) could be avoided through good quality healthcare
Preventable mortality:
- a death is preventable if, in the light of understanding of the determinants of health at time of death, all or most deaths from that cause (subject to age limits if appropriate) could be avoided by public health interventions in the broadest sense
Avoidable mortality:
- avoidable deaths are all those defined as preventable, amenable (treatable) or both, where each death is counted only once; where a cause of death is both preventable and amenable, all deaths from that cause are counted in both categories when they are presented separately
5. Nearly a quarter of all deaths in 2014 (23%) were from avoidable causes
In 2014, approximately 23% of all deaths were from causes considered avoidable (116,489 out of 501,424 deaths). The majority of these deaths were among males (60%).
The age-standardised avoidable mortality rate for all persons in England and Wales was 221.0 per 100,000 persons in 2014.
Figure 1: Number of deaths considered avoidable as a proportion of all deaths registered
England and Wales, 2014
Source: Office for National Statistics
Notes:
Figures are for deaths registered in the calendar year 2014.
Figures include deaths of non-residents.
Download this chart Figure 1: Number of deaths considered avoidable as a proportion of all deaths registered
Image .csv .xlsMales were more likely to die from an avoidable cause than females. Approximately 29% of all male deaths were from avoidable causes (70,108 out of 245,142 deaths) compared with 18% of all female deaths (46,381 out of 256,282 deaths).
The rate for males was significantly higher than that for females (276.3 deaths per 100,000 males compared with 169.2 per 100,000 females).
Nôl i'r tabl cynnwys6. Neoplasms were the leading cause of avoidable deaths in 2014
We examined both broad cause groups and individual causes of avoidable deaths to assess their contribution to avoidable mortality. The latter are discussed elsewhere in this document.
For broad cause groups, the leading cause of avoidable deaths was neoplasms, with an age-standardised rate of 78.2 per 100,000 population. Conversely, the cause group with the smallest contribution to avoidable deaths was infections (3.0 deaths per 100,000).
Figure 2: Avoidable mortality rates by broad cause group
England and Wales, 2014
Source: Office for National Statistics
Notes:
Figures are for deaths registered in the calendar year 2014.
Figures include deaths of non-residents.
Age-standardised rates per 100,000 population, standardised to the 2013 European Standard Population. Age-standardised rates are used to allow comparison between populations which may contain different proportions of people of different ages
Confidence intervals are a measure of the statistical precision of an estimate and show the range of uncertainty around the estimated figure. Calculations based on small numbers of events are often subject to random fluctuations. As a general rule, if the confidence interval around an estimate overlaps with the interval around another, there is no significant difference between the 2 estimates
- See dataset 1 for further details of the underlying causes of death included.
The 'Other' cause group consists of nutritional, endocrines and metabolic disorders, neurological disorders, digesitve disorders, genitourinary disorders, and maternal and infant conditions.
Download this chart Figure 2: Avoidable mortality rates by broad cause group
Image .csv .xls7. Cardiovascular disease caused 44% of all deaths from conditions amenable to healthcare
There were 62,156 deaths from causes considered amenable to healthcare in England and Wales in 2014; an age-standardised mortality rate of 118.9 per 100,000 population.
Cardiovascular disease was the leading cause of amenable deaths, with an age-standardised rate of 52.5 deaths per 100,000 population. To put this into context, the cardiovascular disease cause group was responsible for 44% (27,336 out of 62,156) of all deaths from amenable causes.
Nôl i'r tabl cynnwys8. Neoplasms caused 40% of all deaths from preventable conditions
There were 97,660 deaths from causes that are considered preventable in light of wider public health interventions in England and Wales in 2014. This represents an age-standardised rate of 185.2 deaths per 100,000 population.
Neoplasms (cancers and other non-cancerous tissue growths) were the leading cause of preventable deaths, with an age-standardised rate of 74.0 per 100,000. As a proportion of all deaths from preventable causes, neoplasms accounted for 40% (38,663 out of 97,660 deaths).
Nôl i'r tabl cynnwys9. Avoidable mortality rates were significantly lower when ischaemic heart disease was excluded
For individual causes of death, ischaemic heart disease was the most common cause of avoidable deaths among people in England and Wales in 2014, accounting for 17% of all avoidable deaths (19,239 out of 116,489).
The relatively large number of deaths from ischaemic heart disease means that it is difficult to assess the contribution of other causes of death to the overall avoidable mortality figures. It is likely that any change in avoidable mortality figures will be heavily influenced by changes in the number of deaths from ischaemic heart disease. For this reason, we exclude ischaemic heart disease from the figures for avoidable mortality in this section.
Without ischaemic heart disease, there were 97,250 avoidable deaths in England and Wales in 2014. This represents an age-standardised rate of 184.1 deaths per 100,000 population and is significantly lower than the rate with ischaemic heart disease included: a decrease of 17% from 221.0 per 100,000 population. A similar percentage decrease was observed in England and in Wales separately.
Excluding ischaemic heart disease resulted in a greater percentage decrease in rates for males than for females. In England and Wales (combined), rates for males fell by 21%, from 276.3 per 100,000 to 218.9 per 100,000, while those for females fell by 10% from 169.2 to 151.7 per 100,000. A similar picture was observed in both countries separately.
Figure 3: Age-standardised avoidable, amenable and preventable mortality rates with and without deaths from ischaemic heart disease (IHD)
England and Wales, 2014
Source: Office for National Statistics
Notes:
Figures are for deaths registered in the calendar year 2014.
Figures include deaths of non-residents.
Age-standardised rates per 100,000 population, standardised to the 2013 European Standard Population. Age-standardised rates are used to allow comparison between populations which may contain different proportions of people of different ages.
Confidence intervals are a measure of the statistical precision of an estimate and show the range of uncertainty around the estimated figure. Calculations based on small numbers of events are often subject to random fluctuations. As a general rule, if the confidence interval around an estimate overlaps with the interval around another, there is no significant difference between the 2 estimates.
See dataset 1 for further details of the underlying causes of death.
Download this chart Figure 3: Age-standardised avoidable, amenable and preventable mortality rates with and without deaths from ischaemic heart disease (IHD)
Image .csv .xls10. Avoidable mortality rates higher in Wales than in England
There were 108,491 potentially avoidable deaths in England in 2014, with males accounting for 60% of these deaths (65,248). In comparison, there were 7,428 avoidable deaths in Wales, males accounting for 60% once more (4,476).
Despite the smaller number of deaths in Wales, avoidable mortality rates were significantly higher than in England for both sexes. For males, the rate in Wales was 300.4 per 100,000 population compared with 273.3 per 100,000 in England. Similarly, rates for females were 183.6 per 100,000 in Wales compared with 167.6 per 100,000 in England.
Figure 4: Age-standardised avoidable mortality rates by sex
England and Wales, 2014
Source: Office for National Statistics
Notes:
Figures are for deaths registered in the calendar year 2014
Figures exclude deaths of non-residents
Age-standardised rates per 100,000 population, standardised to the 2013 European Standard Population. Age-standardised rates are used to allow comparison between populations which may contain different proportions of people of different ages
Confidence intervals are a measure of the statistical precision of an estimate and show the range of uncertainty around the estimated figure. Calculations based on small numbers of events are often subject to random fluctuations. As a general rule, if the confidence interval around an estimate overlaps with the interval around another, there is no significant difference between the 2 estimates
See dataset 1 for further details of the underlying causes of death included
Download this chart Figure 4: Age-standardised avoidable mortality rates by sex
Image .csv .xlsNeoplasms were the leading contributor to avoidable deaths, causing 35% (38,090) of avoidable deaths in England and 36% (2,649) in Wales. Rates for neoplasms were also higher in Wales than in England (85.2 compared with 77.5 per 100,000 population, respectively).
There were 57,818 deaths from causes considered amenable to good quality healthcare in England and 3,999 in Wales in 2014. As with overall avoidable mortality, death rates for amenable mortality were significantly higher in Wales than in England (128.9 compared with 117.6 per 100,000 in Wales).
The leading cause of amenable deaths in both countries was cardiovascular disease, but the rate in Wales was higher than that in England (58.6 compared with 51.7 per 100,000 population, respectively). Overall, 44% (25,312) of amenable deaths in England and 46% (1,821) in Wales were caused by cardiovascular disease.
In 2014, there were 90,985 deaths from causes considered preventable through wider public health interventions in England and 6,206 deaths in Wales. As with amenable mortality, preventable mortality rates were also higher in Wales than in England (200.6 compared with 183.3 deaths per 100,000 population).
Neoplasms were the leading cause of preventable deaths in England and in Wales. In England, this cause group was responsible for 40% (36,030) of all preventable deaths, whereas in Wales it was responsible for 41% (2,524). Despite the smaller number of deaths, the preventable mortality rate for neoplasms was higher in Wales than England (81.2 compared with 73.3 deaths per 100,000 population).
Nôl i'r tabl cynnwys11. The North East had highest avoidable mortality rates
The region with the highest avoidable mortality rate for both sexes was the North East, with rates of 339.7 deaths per 100,000 males and 221.6 deaths per 100,000 females. These rates were also significantly higher than the England and Wales average. Conversely, the regions with the lowest rates were the East of England for males (238.6 per 100,000) and the South East for females (144.4 per 100,000). These rates were also significantly lower than the England and Wales average.
Rates were significantly higher for males than females in all English regions.
Figure 5: Age-standardised avoidable mortality rates for all persons
English regions and Wales, 2014

Source: Office for National Statistics
Notes:
- Figures exclude those not usually resident in the areas shown.
- See dataset 1 for a definition of avoidable mortality.
Download this image Figure 5: Age-standardised avoidable mortality rates for all persons
.png (111.9 kB) .xls (27.1 kB)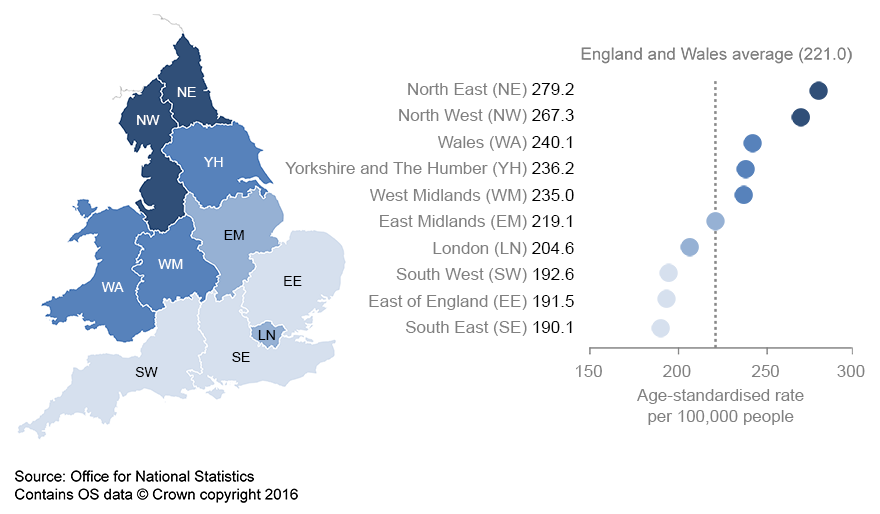
12. Almost a third of deaths in children and young people were from avoidable causes
In 2014, just under a third of deaths (32% or 1,443 out of 4,571) in children and young people aged 0 to 19 years in England and Wales were from causes considered avoidable through good quality healthcare and wider public health interventions. Avoidable deaths in children and young people made up 1% of all avoidable deaths in 2014.
In England and Wales, males aged 0 to 19 years were more likely to die from avoidable causes than their female counterparts. Males accounted for around 63% (911 out 1,443) of avoidable deaths in children and young people. Similarly, the rate for males was significantly higher than that of females (12.7 compared with 7.8 deaths per 100,000 population).
A similar pattern was observed in England, with a higher avoidable mortality rate in 0 to 19 year old males than females (12.5 compared with 7.8 deaths per 100,000, respectively). However, there was no significant difference in rates between the sexes in Wales. For both sexes, the avoidable mortality rates in England were not significantly different from the rates in Wales.
Nôl i'r tabl cynnwys13. The highest number of avoidable deaths in children and young people were from accidental injuries
The single cause with the highest number of avoidable deaths in children and young people was accidental injuries (195 deaths; 14% of all avoidable deaths in this age group).
In stark contrast to avoidable deaths at older ages, where the leading causes were cancer and heart disease, the leading causes of avoidable deaths in children and young people were non-chronic conditions, such as accidental injuries, complications during the perinatal period (childbirth), suicides and self-inflicted injuries, transport accidents and congenital malformations of the heart.
Figure 6: Top 5 causes with the highest number of avoidable deaths in children and young people (aged 0 to 19 years)
England and Wales, 2014
Source: Office for National Statistics
Notes:
Figures are for deaths registered in the calendar year 2014.
Figures for England and Wales include deaths of non-residents.
See dataset 3 for the definition of avoidable mortality in children and young people.
Download this chart Figure 6: Top 5 causes with the highest number of avoidable deaths in children and young people (aged 0 to 19 years)
Image .csv .xls14. Avoidable deaths resulted in an average loss of 23 years of life
To complement analysis of avoidable mortality using age-standardised rates, we have also analysed avoidable mortality using standardised years of life lost (SYLL). This indicator is a measure of the potential number of years lost when a person dies prematurely from any cause.
In England and Wales, there were 5,977.2 years of life lost per 100,000 males who died from an avoidable cause, compared with 3,951.3 years of life lost per 100,000 females. To put these figures into context, on average, each person who died from an avoidable cause lost 23 potential years of life.
In children and young people, 891.6 potential years of life were lost per 100,000 males due to death from avoidable causes. For females there were 582.0 potential years of life lost per 100,000 females, significantly fewer than for males. On average, each person aged 0 to 19 who died from avoidable causes lost 72 years of potential life.
Nôl i'r tabl cynnwys15. What has changed within this publication?
This year we have revised our definition of avoidable mortality, following a period of consultation with statistics users, academics and experts. We received 20 responses to the consultation and a summary of these responses (PDF document) was published on our website in October 2015. The revised definition of avoidable mortality and a new definition of avoidable mortality in children and young people were published in the ‘Revised Definition of Avoidable Mortality and New Definition for Children and Young People’ (PDF document) document. Details of the impact of revising the definition can also be found in this document. We found that:
there was an increase in the overall number of avoidable deaths in England and Wales under the revised definition of avoidable mortality compared with the previous definition; despite this increase, the age-standardised overall avoidable mortality rates under both definitions were not significantly different
there was a substantial increase in the number of deaths and a significant increase in the age-standardised amenable (treatable) mortality rate in England and Wales; this was due to the classification of chronic obstructive pulmonary disease (COPD) as amenable to health care
because COPD is included in the previous definition of preventable mortality, its inclusion in the amenable mortality definition has no impact on the overall avoidable mortality figures
there was a small increase in the number of deaths from preventable causes under the new definition; despite this increase, the age-standardised preventable mortality rates under both definitions were not significantly different
The revised definition will be used to produce avoidable mortality indicators from data year 2014 onwards. We have not rebased previously published data on the revised definition, so this bulletin only presents data for 2014.
We will continue to review the avoidable mortality cause list and the associated age limits periodically. This means that any cause of death which has been excluded from the current list due to concerns around the extent to which deaths from it can be avoided will be reassessed and may be included in future lists.
Nôl i'r tabl cynnwys16. Concept of avoidable mortality
It is widely accepted that the contribution of health care to improvements in population health ought to be quantified. Avoidable mortality, which is based on the concept that premature deaths from certain conditions should be rare, and ideally should not occur in the presence of timely and effective health care, is used as an indicator to measure this contribution.
It is important to note that avoidable mortality was not intended to serve as a definitive source of evidence of differences in effectiveness of healthcare systems. It was designed to highlight areas of potential weaknesses in healthcare that could benefit from further in-depth investigation. Therefore, a degree of caution is recommended when interpreting the data. Further information about the limitations of the concept of avoidable mortality is available in the avoidable mortality quality and methodology information notes.
The concept of avoidable mortality was first introduced by Rutstein and others in the 1970s. Rutstein argued that, in order to develop effective indicators of healthcare, lists of diseases which should not (or only infrequently) give rise to death or disability should be drawn up (Rutstein and others, 1976).
Rutstein also noted that the list of conditions considered to be avoidable would need to be updated in light of improvements in medical knowledge and practice, as well as social and environmental changes. Although avoidable mortality has been researched for the last 3 decades, there is little consensus among researchers about how to define it.
The list of causes of death we used in defining avoidable mortality is primarily based on the cause lists produced by Nolte and McKee (2004) (PDF download) and Page, Tobias and Glover (2006) (PDF download). These cause lists were updated and amended to make them more relevant to the UK and to take account of more recent developments in healthcare public health policy. Changes to these lists were influenced by Wheller and others (2007), AMIEHS (2011) and views of respondents to the 2011 consultation.
Statistics on avoidable mortality are used by central government, public health observatories, academia and charitable organisations working to reduce the prevalence of specific diseases and conditions deemed to be avoidable causes of death.
One of the main expected uses of these statistics is the monitoring of the quality performance of healthcare and public health policies. The Department of Health uses potential years of life lost (PYLL) from causes considered amenable to healthcare for children and young population in its NHS Outcomes Framework 2016/17 (Department of Health, 2016) and mortality from preventable causes as an indicator in its Public Health Outcomes Framework to reduce preventable ill-health, population dying prematurely and to reduce the gap between communities (Department of Health, 2015).
Further information on avoidable mortality indicators used at international level is available in the avoidable mortality quality and methodology information notes.
Nôl i'r tabl cynnwys17. Quality and methodology
Age-standardised rates were calculated using the number of potentially avoidable deaths registered in each year as the numerator and the mid-year population estimate for that year as the denominator.
Although age limits were set for some cause groups, rates were calculated using people of all ages as the denominator to allow data by cause group, amenable and preventable categories to be presented on a comparable basis. For the children and young people’s indicator, an upper age limit of 19 years was used to calculate age-standardised rates.
Potential years of life lost (PYLL) is a measure of the potential number of years lost when people die prematurely from any cause. The basic concept underpinning PYLL is that deaths at younger ages are weighted more heavily than those at older ages. The advantage in doing this is that deaths at younger ages may be perceived to be of less importance if cause-specific death rates alone were used to highlight the burden of disease and injury, as conditions such as cancer and heart disease often occur at older ages and have relatively high mortality rates.
To enhance comparability between areas and the sexes, we have standardised PYLLs using the 2013 European Standard Population (ESP). It is therefore referred to as standardised years of life lost (SYLL) for clarity. SYLL rates represent the potential years of life lost if the population of England and Wales had the same population structure as the 2013 ESP. The rates are presented as years of life lost per 100,000 population. Detailed explanations on how this indicator is calculated are available in the avoidable mortality quality and methodology information notes.
The average years of life lost (AYLL) is a measure of the potential number of years lost when an individual dies prematurely from any cause. It is calculated by summing up the number of deaths in each age group, weighted by the corresponding remaining life expectancy and then dividing the result by the total number of deaths across all age group.
Nôl i'r tabl cynnwys18. Results
Avoidable mortality data for England and Wales can be found in the datasets.
The 3 workbooks contain:
the age-standardised rates, standardised years of life lost and the total numbers of deaths for causes considered avoidable, amenable and preventable
the number avoidable deaths by broad cause group, sex and 5-year age group
the age-standardised rates, standardised years of life lost and a detailed breakdown of avoidable deaths in children and young people
Special extracts and tabulations of avoidable mortality data for England and Wales are available to order (subject to legal frameworks, disclosure control, resources and the ONS charging policy, where appropriate). Enquiries should be made to the Mortality Analysis Team (mortality@ons.gov.uk or telephone: +44 (0) 1633 455292). User requested data will be published onto our website.
Nôl i'r tabl cynnwys