1. Main findings
In 2014, 1.6% of adults in the UK identified their sexual identity as lesbian, gay or bisexual
The likelihood of an adult identifying as lesbian, gay or bisexual decreased with age. Around 2.6% of adults aged 16 to 24 years identified themselves as lesbian, gay or bisexual. This decreased to 0.6% of adults aged 65 and over
Around 0.5% of adults identified themselves as bisexual, with women (0.7%) being twice as likely as men to do so (0.3%)
London had the highest percentage of adults identifying themselves as lesbian, gay or bisexual, at 2.6%
The proportion of the UK adult population who smoked cigarettes fell between 2010 and 2014, from 21.0% to 18.3%
In 2014, men (20.7%) were more likely to be cigarette smokers than women (15.9%)
Scotland had the highest smoking rate in the UK (20.3%). England had the lowest smoking rate (18.0%)
The proportion who smoked cigarettes was highest amongst those working in routine and manual occupations (28.2%)
The proportion who smoked cigarettes was higher among adults who identified themselves as gay, lesbian or bisexual (25.3%) compared with those who identified themselves as heterosexual / straight (18.4%)
2. Introduction
This bulletin provides information from the January to December 2014 Integrated Household Survey (IHS). This year’s release focuses on sexual identity and cigarette smoking in the UK. For information on previous topics covered by IHS statistical bulletins, please visit the IHS release page.
A set of reference tables have been included in the data section of the publication to accompany each figure in this report. This allows further analysis of topics at a country level.
The IHS is the largest social survey undertaken by the Office for National Statistics (ONS). It provides estimates from approximately 325,000 individual respondents – the biggest pool of UK social survey data apart from the census.
The IHS sample size enables analysis at lower level geographies that cannot typically be obtained with other social surveys. The IHS is used by academics, government departments and other stakeholders to provide evidence for planning, policy and monitoring purposes. It specifically provides data on sexual identity and smoking prevalence to meet users’ needs.
Following a consultation in 2014, future releases of IHS estimates will appear on the Annual Population Survey. Further information on this can be found in the background notes.
At present, IHS statistics are designated as experimental. Information on what this means can be found in the background notes.
Nôl i'r tabl cynnwys3. Sexual identity
The Integrated Household Survey (IHS) asks a question on self perceived sexual identity of adults in the UK. This question was developed as part of the ONS Sexual Identity Project, which developed, tested and implemented the question to satisfy the increasing demand for data on sexual orientation to meet the requirements of the Equality Act 2010. ONS focused on 1 component of sexual orientation, sexual identity, as this is the most relevant dimension of sexual orientation to investigate given its relation to experiences of disadvantage and discrimination.
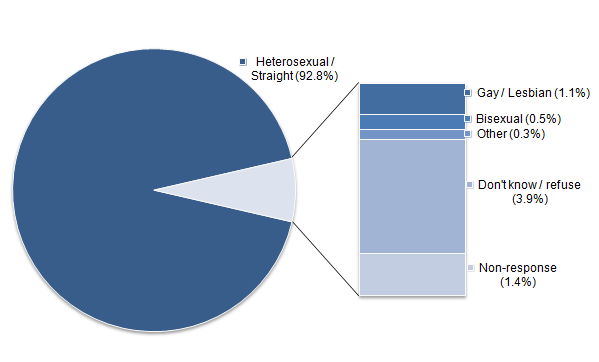
In 2014, the IHS found 1.6% of adults identified themselves as lesbian, gay or bisexual (LGB). This comprised of:
1.1% who identified as gay or lesbian
0.5% who identified as bisexual
A further 0.3% of the population identified their sexual identity as “other”. These were adults who did not consider themselves to fall into the heterosexual / straight, gay / lesbian, or bisexual categories.
Figure 1 shows the full breakdown of self-reported sexual identity in the UK in 2014. More information on the types of non-response to this question can be found in the background notes.
Figure 1: Sexual identity, UK, 2014
Source: Integrated Household Survey - Office for National Statistics
Notes:
- Information on the sample sizes and confidence intervals for this chart can be found in the Excel download table. Information on what confidence intervals are can be found in the background notes.
- We define "non- response" as no data provided to the question by an eligible responder. A background note explains the sources of non-response to this question, the impact this has on the estimates, and ways to account for it.
- The "non- response" category includes respondents who were aged 15 in their wave 1 of the LFS/APS but are now aged 16 in the January to December 2014 field period.
- Percentages might not add to 100% due to rounding.
- A set of reference tables are included in this year’s report, which provide the estimates behind this chart at a country level, for the reference period 2010 to 2014. These can be found in the data section of the publication.
Download this image Figure 1: Sexual identity, UK, 2014
.png (21.1 kB) .xls (41.0 kB)
Figure 2 illustrates how the size of the size of the LGB population has remained the same since 2013 (1.6%) and has experienced a small increase since 2010 (from 1.5%), although this increase was not statistically significant.
Figure 2: Sexual identity, lesbian, gay and bisexual population, UK, 2010 to 2014
Source: Integrated Household Survey - Office for National Statistics
Notes:
- Information on the sample sizes and confidence intervals for this chart can be found in the Excel download table. Information on what confidence intervals are can be found in the background notes.
- The figures presented above are rounded to the nearest decimal place. In 2013, the unrounded sum of the lesbian, gay and bisexual population was 1.6%, rather than 1.7%. Unrounded estimates are available in the Excel download table.
- A set of reference tables are included in this year’s report, which provide the estimates behind this chart at a country level, for the reference period 2010 to 2014. These can be found in the data section of the publication.
Download this chart Figure 2: Sexual identity, lesbian, gay and bisexual population, UK, 2010 to 2014
Image .csv .xlsSexual identity by age group
The likelihood of an adult identifying as LGB decreased with age. In 2014, 2.6% of adults aged 16 to 24 identified as LGB. This decreased to 0.6% of adults aged 65 and over. Figure 3 shows this pattern for 2014.
Figure 3: Sexual identity, lesbian, gay and bisexual population by age group, UK, 2014
Source: Integrated Household Survey - Office for National Statistics
Notes:
- Information on the sample sizes and confidence intervals for this chart can be found in the Excel download table. Information on what confidence intervals are can be found in the background notes.
- The figures presented above are rounded to the nearest decimal place. Unrounded estimates are available in the Excel download table.
- A set of reference tables are included in this year’s report, which provide the estimates behind this chart at a country level, for the reference period 2010 to 2014. These can be found in the data section of the publication.
Download this chart Figure 3: Sexual identity, lesbian, gay and bisexual population by age group, UK, 2014
Image .csv .xlsSexual identity by gender
In 2014, twice as many men identified themselves as gay (1.5%) when compared with women who identified themselves as gay or lesbian (0.7%). By contrast, women were more than twice as likely to identify themselves as bisexual (0.7%) compared to men (0.3%). Figure 4 shows the size of the LGB population by gender in 2014.
Figure 4: Sexual identity, lesbian, gay and bisexual population by gender, UK, 2014
Source: Office for National Statistics
Notes:
- Information on the sample sizes and confidence intervals for this chart can be found in the Excel download table. Information on what confidence intervals are can be found in the background notes.
- The figures presented above are rounded to the nearest decimal place. Unrounded estimates are available in the Excel download table.
- A set of reference tables are included in this year’s report, which provide the estimates behind this chart at a country level, for the reference period 2010 to 2014. These can be found in the data section of the publication.
Download this chart Figure 4: Sexual identity, lesbian, gay and bisexual population by gender, UK, 2014
Image .csv .xlsSexual identity by region
In 2014, London had the highest proportion of adults identifying themselves as LGB (2.6%). Differences between other regions of the UK were relatively small and mostly not statistically significant, with LGB identification ranging from 1.0% (East Midlands) to 1.8% (South East). Figure 5 shows this pattern for 2014.
Figure 5: Sexual identity, lesbian, gay and bisexual population by region, UK, 2014
Source: Integrated Household Survey - Office for National Statistics
Notes:
- Information on the sample sizes and confidence intervals for this chart can be found in the Excel download table.
- The whisker bar represents the confidence intervals for each estimate. Information on what confidence intervals are can be found in the background notes.
- The figures presented above are rounded to the nearest decimal place. Unrounded estimates are available in the Excel download table.
- A set of reference tables are included in this year’s report, which provide the estimates behind this chart at a country level. These can be found in the data section of the publication.
Download this chart Figure 5: Sexual identity, lesbian, gay and bisexual population by region, UK, 2014
Image .csv .xlsSexual identity by occupation
Figure 6 shows that adults in managerial and professional occupations were more likely to identify themselves as LGB (2.1%) than those in either intermediate occupations (1.3%) or routine and manual occupations (1.4%).
Figure 6: Sexual identity, lesbian, gay and bisexual population by occupation, UK, 2014
Source: Integrated Household Survey - Office for National Statistics
Notes:
- Information on the sample sizes and confidence intervals for this chart can be found in the Excel download table. Information on what confidence intervals are can be found in the background notes.
- The figures presented above are rounded to the nearest decimal place. Unrounded estimates are available in the Excel download table.
- A set of reference tables are included in this year’s report, which provide the estimates behind this chart at a country level. These can be found in the data section of the publication.
Download this chart Figure 6: Sexual identity, lesbian, gay and bisexual population by occupation, UK, 2014
Image .csv .xls4. Smoking prevalence
The Intergrated Household Survey (IHS) collects information on smoking prevalence rates in the UK, focusing on use of tobacco-based cigarettes by adults aged 18 and over. This information is an important measure for monitoring tobacco use in the UK, with various initiatives in England, Wales, Scotland and Northern Ireland launched since 2011 aimed at reducing tobacco use. The term "cigarette smoker" is used in this report and refers to adults who stated they currently smoke cigarettes. The IHS does not collect or publish information on e-cigarettes.
In 2014, 18.3% of adults living in the UK were cigarette smokers. This continues a gradual decline seen since 2010 and fell from 18.7% in 2013 (Figure 7). Information on cigarette smoking in Great Britain going back to 1974 can be found in the 2013 Adult Smoking Habits report.
Figure 7: Cigarette smokers, UK, 2010 to 2014
Source: Office for National Statistics
Notes:
- Information on the sample sizes and confidence intervals for this chart can be found in the Excel download table. Information on what confidence intervals are can be found in the background notes.
- The term "cigarette smoker" refers to adults aged 18 and over who stated they currently smoke cigarettes. The IHS does not collect information on e-cigarettes.
- A set of reference tables are included in this year’s report, which provide the estimates behind this chart at a country level, for the reference period 2010 to 2014. These can be found in the data section of the publication.
Download this chart Figure 7: Cigarette smokers, UK, 2010 to 2014
Image .csv .xlsEngland had the lowest proportion of cigarette smokers in 2014 (18.0%), whilst Scotland had the highest (20.3%). Scotland had the greatest decline in cigarette smoking rates between 2010 and 2014, falling from 23.8% in 2010 (Figure 8).
Figure 8: Cigarette smokers by country, 2010 to 2014
Source: Integrated Household Survey - Office for National Statistics
Notes:
- Information on the sample sizes and confidence intervals for this chart can be found in the Excel download table. Information on what confidence intervals are can be found in the background notes.
- The term "cigarette smoker" refers to adults aged 18 and over who stated they currently smoke cigarettes. The IHS does not collect information on e-cigarettes.
- A set of reference tables are included in this year’s report, which provide the estimates behind this chart at a country level, for the reference period 2010 to 2014. These can be found in the data section of the publication.
Download this chart Figure 8: Cigarette smokers by country, 2010 to 2014
Image .csv .xlsCigarette smoking by age group
Between 2010 and 2014, cigarette smoking declined across all age groups. Figure 9 shows that the biggest reductions were seen in the 18 to 24 and 35 to 49 age groups.
Figure 9: Cigarette smokers by age group, UK, 2010 to 2014
Source: Integrated Household Survey - Office for National Statistics
Notes:
- Information on the sample sizes and confidence intervals for this chart can be found in the Excel download table. Information on what confidence intervals are can be found in the background notes.
- The term "cigarette smoker" refers to adults aged 18 and over who stated they currently smoke cigarettes. The IHS does not collect information on e-cigarettes.
- A set of reference tables are included in this year’s report, which provide the estimates behind this chart at a country level, for the reference period 2010 to 2014. These can be found in the data section of the publication.
Download this chart Figure 9: Cigarette smokers by age group, UK, 2010 to 2014
Image .csv .xlsCigarette smoking by gender
Figure 10 shows that in 2014, men (20.7%) were more likely to be cigarette smokers than women (15.9%). This difference was consistent with previous years; the smoking rate has declined at a similar rate for men and women.
Figure 10: Cigarette smokers by gender, UK, 2010 to 2014
Source: Integrated Household Survey - Office for National Statistics
Notes:
- Information on the sample sizes and confidence intervals for this chart can be found in the Excel download table. Information on what confidence intervals are can be found in the background notes.
- The term "cigarette smoker" refers to adults aged 18 and over who stated they currently smoke cigarettes. The IHS does not collect information on e-cigarettes.
- A set of reference tables are included in this year’s report, which provide the estimates behind this chart at a country level, for the reference period 2010 to 2014. These can be found in the data section of the publication.
Download this chart Figure 10: Cigarette smokers by gender, UK, 2010 to 2014
Image .csv .xlsCigarette smoking by region
Adults living in northern regions of the UK were more likely to be cigarette smokers than those living in southern regions. Figure 11 shows the cigarette smoking rates in all regions of the UK.
Figure 11: Cigarette smokers by region, 2014
Source: Integrated Household Survey - Office for National Statistics
Notes:
- Information on the sample sizes and confidence intervals for this chart can be found in the Excel download table. Information on what confidence intervals are can be found in the background notes.
- The term "cigarette smoker" refers to adults aged 18 and over who stated they currently smoke cigarettes. The IHS does not collect information on e-cigarettes.
- A set of reference tables are included in this year’s report, which provide the estimates behind this chart at a country level. These can be found in the data section of the publication.
Download this chart Figure 11: Cigarette smokers by region, 2014
Image .csv .xlsCigarette smoking by occupation
Figure 12 shows that adults in routine and manual occupations were more than twice as likely to be cigarette smokers than adults in managerial and professional occupations, 28.2% and 12.1% respectively.
Figure 12: Cigarette Smokers by occupation, UK, 2014
Source: Integrated Household Survey - Office for National Statistics
Notes:
- Information on the sample sizes and confidence intervals for this chart can be found in the Excel download table. Information on what confidence intervals are can be found in the background notes.
- The term "cigarette smoker" refers to adults aged 18 and over who stated they currently smoke cigarettes. The IHS does not collect information on e-cigarettes.
- A set of reference tables are included in this year’s report, which provide the estimates behind this chart at a country level. These can be found in the data section of the publication.
Download this chart Figure 12: Cigarette Smokers by occupation, UK, 2014
Image .csv .xlsPerceived good general health by cigarette smoking
Figure 13 illustrates differences between current cigarette smokers and adults who had never smoked and their perceptions of good general health by age:
in the 18 to 24 age group, 83.0% of current smokers and 91.9% of those who had never smoked considered themselves in good health
in the 50 to 64 age group, 56.3% of current smokers and 76.0% of those who had never smoked considered themselves in good health
Figure 13: Perceived good general health by cigarette smoking, UK, 2014
Age group
Source: Integrated Household Survey - Office for National Statistics
Notes:
- Information on the sample sizes and confidence intervals for this chart can be found in the Excel download table. Information on what confidence intervals are can be found in the background notes.
- Perception of good health based on adults who reported their general health as either “very good” or “good”.
- The term "cigarette smoker" refers to adults aged 18 and over who stated they currently smoke cigarettes. The IHS does not collect information on e-cigarettes.
- A set of reference tables are included in this year’s report, which provide the estimates behind this chart at a country level. These can be found in the data section of the publication.
Download this chart Figure 13: Perceived good general health by cigarette smoking, UK, 2014
Image .csv .xlsCigarette smoking by sexual identity
Adults aged 18 and over who identified as lesbian, gay or bisexual were more likely to be cigarette smokers than those who identified as heterosexual or straight (25.3% and 18.4% respectively) (Figure 14). This difference can in part be explained by the younger age profile of the lesbian, gay and bisexual population (Figure 3) and the higher proportion of younger smokers, shown in Figure 9.
Figure 14: Cigarette smokers by sexual identity, UK, 2014
Sexual identity
Source: Integrated Household Survey - Office for National Statistics
Notes:
- Information on the sample sizes and confidence intervals for this chart can be found in the Excel download table. Information on what confidence intervals are can be found in the background notes.
- Estimates of smoking prevalence by sexual identity are based on adults aged 18 and over, who were eligible to be asked the sexual identity question. These estimates are weighted using the IHS household weight, to maintain consistency with other smoking estimates in this report. Further information on the weights used in this report can be found in the background notes.
- The term "cigarette smoker" refers to adults aged 18 and over who stated they currently smoke cigarettes. The IHS does not collect information on e-cigarettes.
- A set of reference tables are included in this year’s report, which provide the estimates behind this chart at a country level. These can be found in the data section of the publication.