Ethnicity1 and national identity2 are important defining characteristics of our population. The 2011 Census highlighted the increasing diversity of England and Wales, and for the first time introduced a question on national identity.
This information is important as it helps to ensure that different groups are recognised and are provided with equal opportunities.
A picture of increased ethnic diversity
The majority of people (86%) in England and Wales identified with the White ethnic group in 2011. However, this proportion has declined from 91% in 2001 and 94% in 1991.
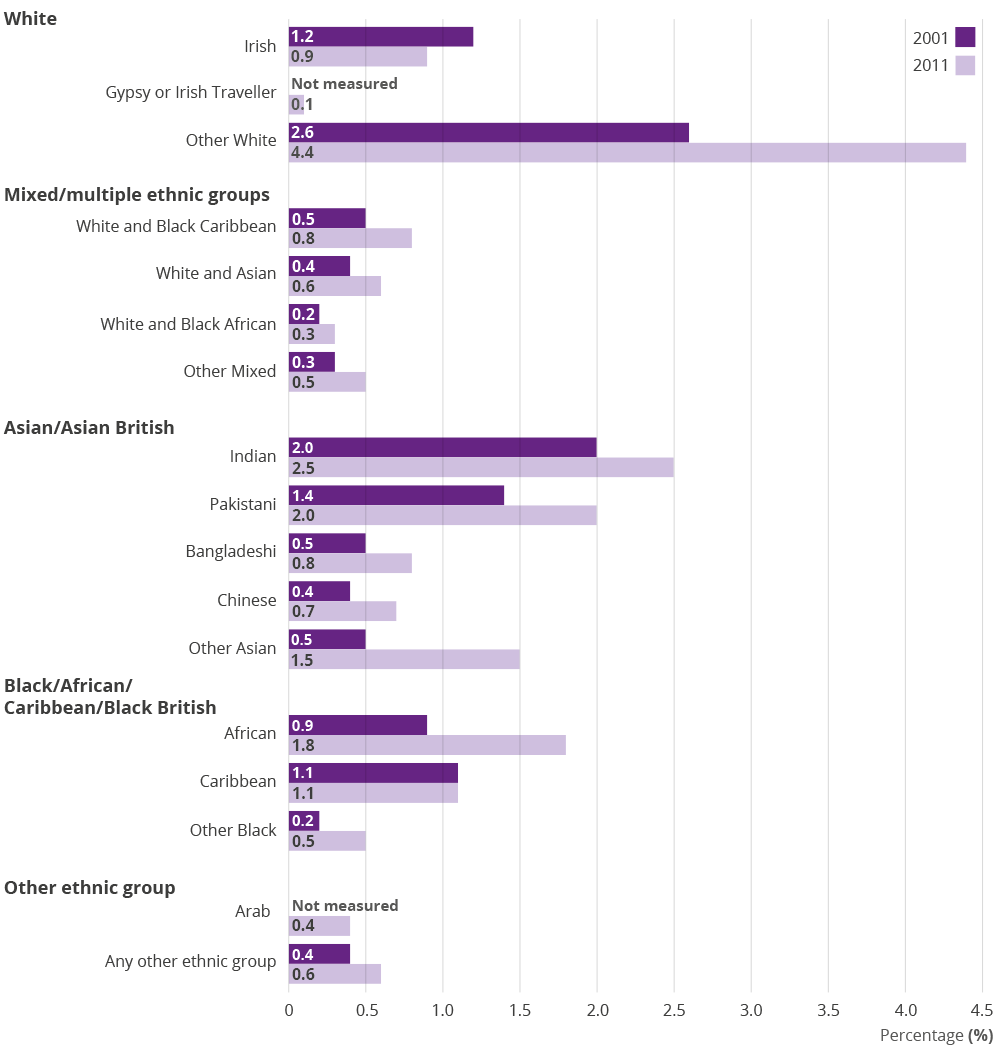
Despite this fall in the broad White ethnic group category, people identifying as Other White increased by over 1 million people, and this was the largest increase in any ethnic group category. People identifying as Other White included Polish-born residents, who have increased ten-fold in number (from 58,000 to 579,000) between 2001 and 2011.
The Asian/Asian British ethnic group categories also saw some large increases. People who identified with Pakistani and Indian each rose by around 400,000 since 2001.
Changes in minority ethnic groups, 2001-2011
More than 9 in 10 people identified with at least one UK national identity
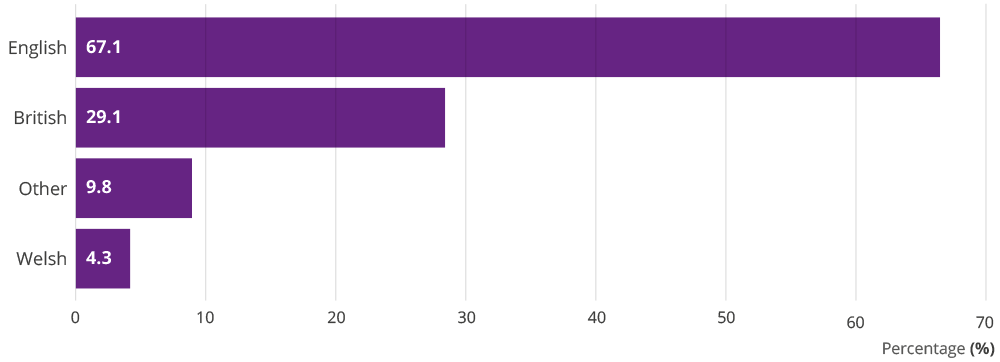
The vast majority of people (91%) living in England and Wales identified with at least one UK national identity (English, Welsh, Scottish, Northern Irish, and British). English identity (either on its own or combined with other identities) was chosen by 37.6 million people (67%). The highest percentage of the population identifying as English was in the North East at 80.5%.
Welsh identity (either on its own or combined with other identities) was chosen by 2.4 million people (4.3%). British identity (either on its own or combined with other identities) was the common identity of 16.3 million people (29.1%).  Download the data.
One in eight foreign born residents identified as White British
Migration patterns to the UK have been shown to differ across ethnic groups. There can be numerous reasons for this that can include historic and commonwealth ties, legislative changes, personal, economic and cultural issues and circumstances.
Data has shown that in 2011, 7.5 million people were born outside of the UK (13% of the population). Of the foreign born population almost half (46%) identified as White with the majority being Other White (28%) and White British (13%), many of whom will have been born to British people living temporarily overseas, often working in the armed forces. One third identified with Asian (33%) and 13% identified with Black/African/Caribbean/Black British.
The largest ethnic minority group for the foreign born population was Other White (2.1 million people); the majority (71%) arrived in the UK between 2001 and 2011 reflecting the increase in migrants following Central and Eastern European countries joining the European Union in 2004.
Highest employment rate among the 'Other White' ethnic group
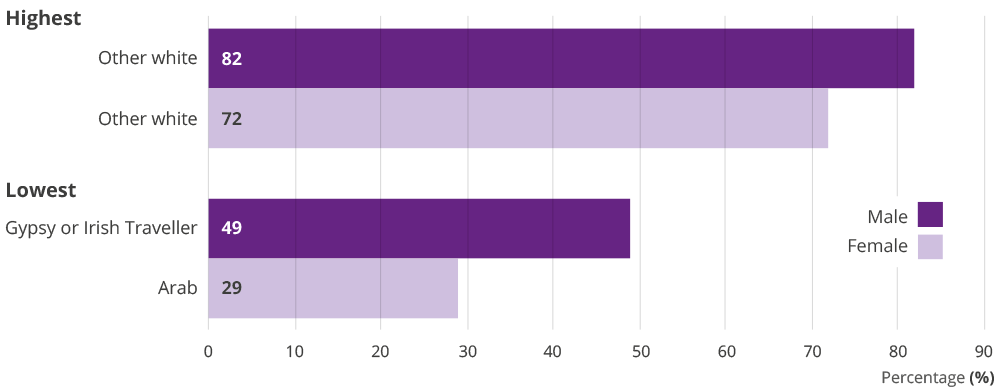
The Other White ethnic group (77%) had the highest employment rate of all ethnic groups (people aged 16 to 64) and this was the case for both men (82%) and women (72%). This is largely due to economic migrants from the EU since 2001. Gypsy or Irish Traveller men (49%) and women (31%) and Arab men (50%) and women (29%) had the lowest employment rates of all ethnic groups. Tick-boxes for Gypsy and Irish Travellers and Arabs were introduced in the 2011 Census for the first time.
Economic inactivity rates were higher for women (28%) than for men (18%) overall and reasons for them both varied. For women, the main reason behind economic inactivity was that they are looking after the family or home (31%), while men were most likely to be economically inactive due to being a student (37%).
Economic inactivity due to being a student was most common among Chinese men (83%) and women (64%). While economic inactivity due to long-term illness or disability was most common among Gypsy or Irish Traveller men. Economic inactivity due to looking after the family or home was most common among Bangladeshi (54%) or Pakistani (52%) women.
Around 1 in 10 people were in an inter-ethnic relationship
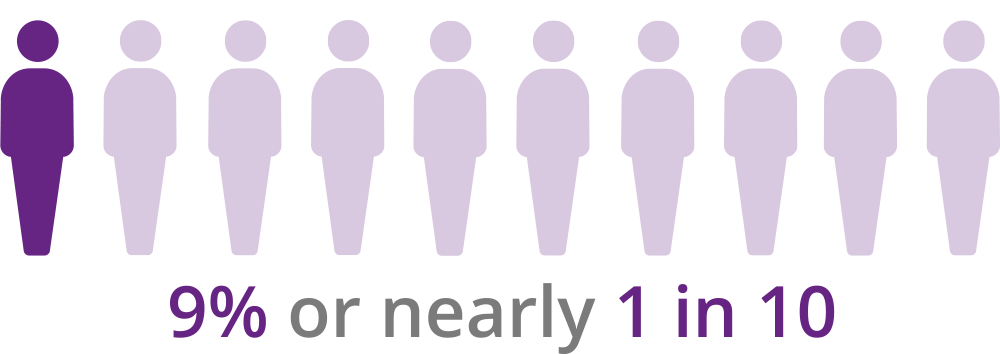
Census data allowed insight into diversity by looking at patterns and trends of people living as a couple in an inter-ethnic relationship3. In 2011, of those living as part of a couple almost 1 in 10 (9%, 2.3 million people) were in an inter-ethnic relationship.
Of all people who were in inter-ethnic relationships, 4 in 10 were with someone who was White British. The most common being Other White and White British (16%).
People identifying with Mixed/Multiple groups were the most likely to be in an inter-ethnic relationship (over 8 in 10 or 195,000 people), and are themselves likely to be the result of inter-ethnic relationships that have emerged in the last 60 years (from post war immigration patterns). These groups have a much younger age profile than some of the other ethnic groups and 80% of the people in this group were born in the UK.[]10
Visit the 2011 Census Analysis website for more information on what the 2011 Census told us about England and Wales, or contact census.customerservices@ons.gov.uk.
Footnotes:
- The England and Wales census first asked the ethnic group question in 1991. Since this time the number of tick boxes has grown from 9 to 18.The list of tick-boxes was designed to enable the majority of people to identify themselves in a manageable way. This link provides further information about how ethnicity was measured in the 2011 Census. There are some comparability issues with comparing ethnicity over time, further details can be found in the comparability report.
- National identity was asked for the first time on the 2011 Census and is a subjective self-identifying measure which may or may not relate to a person’s ethnic group or country of birth. The question (‘How would you describe your national identity?’) allows respondents to express which country/nation they feel most affiliated to. National identity is multi-dimensional, so the 2011 Census question allows respondents to tick more than one national identity.
- Inter-ethnic relationships are defined as a relationship between a couple who are either married, in a civil partnership or cohabiting and each partner identifies with an ethnic group different from the other (within any of the 18 ethnic group classifications).


