Cynnwys
- Main points
- Things you need to know about this release
- What is the extent of violent crime?
- Interpreting trends in violent crime
- What is happening to trends for different types of violent crime?
- How are victims and perpetrators of violence related?
- What do we know about sexual offences?
- Levels of victimisation
- Characteristics associated with being a victim
- Profile of perpetrators involved in violent crimes
- Reporting violence to the police
- When do violent crimes occur?
- Where do violent crimes occur?
- The impact on victims
- Use of weapons and injuries in violent crime
- Findings from the 2015 Commercial Victimisation Survey (CVS)
- Annex 1 – Drivers of the increase in police recorded violent crime
1. Main points
The estimated annual number of CSEW violent crime incidents has fallen from its 1995 peak of 3.8 million to 1.3 million. However, there was no statistically significant change compared with the previous year’s survey.
Improvements in crime recording processes by the police are thought to be the main driver of a 27% rise in the number of violence against the person offences recorded by the police in the year ending March 2016 compared with the previous year.
The 106,098 sexual offences recorded by the police was the highest figure recorded since the introduction of the National Crime Recording Standard in 2002. As well as improvements in recording practices, this is thought to reflect a greater willingness of victims to come forward to report such crimes, including non-recent victims.
Violence without injury accounted for around half (55%) of all CSEW violent incidents, while the more serious crimes of wounding and assault with minor injury accounted for 24% and 21% respectively.
Victimisation rates have declined over time, with 1.8% of adults aged 16 and over being a victim of violent crime in the 12 months prior to interview, compared with 4.8% of adults when CSEW violent crime was at its peak in 1995.
Around half of CSEW violent incidents (52%) were reported to the police. This was higher than the proportion of all CSEW incidents reported to the police (42%), and represents a 10 percentage point increase since the year ending March 2012 survey.
Nôl i'r tabl cynnwys2. Things you need to know about this release
Violent crime covers a wide range of offences including minor assaults (such as pushing and shoving), harassment and abuse (that result in no physical harm) through to wounding and homicide. Sexual offences include rape, sexual assault and unlawful sexual activity against adults and children, sexual grooming and indecent exposure.
CSEW violent crime
The Crime Survey for England and Wales (CSEW) is a face-to-face victimisation survey in which people resident in households in England and Wales are asked about their experiences of a selected range of offences in the 12 months prior to the interview. The CSEW covers crimes against the population of England and Wales resident in households, and crimes against those households. The primary purpose of the CSEW is to provide national level estimates but some headline figures are available at regional level.
Violent crime statistics from the CSEW are presented under the overall category of “Violence”, and refer primarily to the offences of wounding, assault with minor injury, and violence without injury. There are additional breakdowns for the relationship between the victim and the perpetrator (domestic, acquaintance, and stranger). As with police recorded crime, both actual and attempted assaults are included in CSEW figures. All changes reported in this chapter are statistically significant unless stated otherwise.
The CSEW does not cover homicide as it is based on the responses of victims. The CSEW also does not include sexual offences in its main estimates due to the low levels of reporting of these offences in the face-to-face interviews. However, the survey does contain a separate self-completion module which asks respondents, aged 16 to 59, about their experience of intimate violence, including sexual offences (see the ‘Domestic abuse, sexual assault and stalking’ chapter of this release). We are currently testing the feasibility of raising this age limit with changes possibly being introduced from April 2017.
The CSEW also does not cover the population living in group residences or other institutions (for example, care homes or halls of residence), nor does it cover the population not resident in households (for example, tourists or visitors), or crimes against the commercial or business sector.
The CSEW was extended in 2009 to cover children aged 10 to 15, and, where appropriate, data for this age group are presented in this Overview chapter. Methodological differences between the adult and children’s surveys mean that direct comparisons cannot be made between the adult and child victimisation data1.
Following criticism of the methodology for handling high-frequency repeat victimisation in CSEW estimates, particularly with regard to violent crime, the Office for National Statistics (ONS) commissioned an independent review of the current and alternative methods for handling high frequency repeat victimisation. This review was published in July 2016 alongside a user consultation seeking feedback on the review’s recommendations, which ran until September 2016.
In response, our proposed way forward was published in November 2016, along with a summary of the feedback received to the consultation, with plans to implement a new methodology and revise the back series by July 2018 at the latest. The methodology will be changed going forward so that the experiences of repeat victims are better reflected in the CSEW estimates. The current cap of 5 will be changed to a lighter cap derived by applying the 98th percentile of victim incident counts for each crime type (calculated over a number of years). The proposed change to the methodology will not impact the estimated number of victims and repeat victims, but it will impact the number of incidents of crime, which will be revised upwards across the whole time series. The methodology is not expected to change the existing picture of trends over time.
Police recorded violent crime
The coverage of police recorded crime is defined by the Notifiable Offence List2, which includes a broad range of violent offences, ranging from threats to kill, harassment, and assault without injury, to offences such as homicide3.
Police recorded crime figures are supplied to ONS (via the Home Office) by the 43 territorial police forces of England and Wales, plus the British Transport Police. As with the CSEW, both actual and attempted assaults are included in the figures. Police recorded crime figures for the year ending March 2016 quoted in this report are those published in January 2017, which were the most up-to-date available at the time this report was published4.
Police recorded crime is the principal source of subnational crime statistics and for higher harm, but lower volume, crimes that are not well-measured by a sample survey. However, police recorded crime figures are restricted to the crimes that have been reported to, and recorded by, the police. Therefore, while the police recorded crime series covers a wider population and a broader set of offences than the CSEW (for example, residents of institutions, tourists and crimes against commercial bodies), it does not include crimes that do not come to the attention of the police or are not recorded by them.
In accordance with the Statistics and Registration Service Act 2007, police recorded crime data have been assessed against the Code of Practice for Official Statistics and found not to meet the required standard for designation as National Statistics5. However, the National Statistics status of statistics about unlawful deaths based on the Homicide Index6 was restored in December 2016. Data from the Crime Survey for England and Wales (CSEW) continue to be badged as National Statistics.
Changes in police recorded crime need to be considered in the context of the renewed focus on the quality of crime recording by the police, in light of the inspections of forces by Her Majesty’s Inspectorate of Constabulary (HMIC), the Public Administration Select Committee (PASC) inquiry into crime statistics and the UK Statistics Authority’s decision to remove the National Statistics designation from police recorded crime statistics.
The final report on findings from the HMIC inspections was published in November 20147. HMIC concluded that, across England and Wales, an estimated 1 in 5 offences (19%) that should have been recorded as crimes were not. The greatest levels of under-recording were seen for violence against the person and sexual offences. An estimated 1 in 3 (33%) violent offences and 1 in 4 (26%) sexual offences that should have been recorded as crimes were not.
The renewed focus on the quality of crime recording by the police is thought to have led to improved compliance with the National Crime Recording Standard (NCRS), leading to a greater proportion of reported crimes being recorded by the police. This means caution should be taken when interpreting police recorded crime trends. For more information see the ‘Quality and methodology’ section in Crime in England and Wales, year ending March 2016.
In addition to data on the number of offences recorded by the police, more detailed information about crimes recorded by the police has started to become available from the record-level data collected via the Home Office Data Hub. Such details include characteristics of victims and associated aggravating factors of crimes, and allow for a wider range of analyses to be carried out than is possible through the standard police data returns. See ’Experimental statistics: Data on police recorded violent crime and sexual offences’ for more information.
Which is the better source?
Together, the CSEW and police recorded crime provide a fuller picture of violent crime than either series on its own; however, neither should be viewed in isolation. While police recorded crime covers a wider range of offences than the CSEW, it is restricted to the subset of crimes that have been reported to and recorded by the police, and is affected by changes in recording practices and police activity. Therefore while it provides good information about the demands on police and police activity related to violent crime and sexual offences, it can’t provide a full count of such crime.
In contrast, although not all victim-based crimes are covered by the CSEW, the prevalence of those violent crimes it does cover is well measured as offences which are not reported to the police are included and a consistent methodology is used that is not subject to changes in recording practices and police activity. The methodology employed in the main count of crime has remained comparable since the survey began in 1981. It was also confirmed in December 2016 that the crime statistics produced by the CSEW retained their National Statistics “badge”.
While the CSEW provides a reliable estimate of the trends in prevalence of the violent crimes it covers, it cannot be used to make any inferences about demands on the police for these crimes. The 2 data sources should therefore be considered together to develop a picture of violent crime in England and Wales.
Notes for: Things you need to know about this release
See Experimental statistics on victimisation of children aged 10 to 15 for more detail.
The Notifiable Offence List includes all indictable and triable-either-way offences (which could be tried at a crown court) and a few additional closely related summary offences (which would be dealt with by a magistrate). For information on the classifications used for notifiable crimes recorded by the police, see Appendix 1 of the User Guide.
There are some crimes which are not captured in this bulletin, which may involve some degree of violence but which do not have a specific victim, for example, public order offences. See Appendix table A4, year ending September 2016 for police recorded figures for public order offences.
Police recorded crime data is continuously updated. At the time this release was published, the appendix tables published alongside ‘Crime in England and Wales: year ending September 2016’ provided the most up-to-date data on crime recorded by the police in the year ending March 2016.
The full assessment report can be found on the UK Statistics Authority website.
Police forces supply a more detailed statistical return for each homicide (murders, manslaughters and infanticides) recorded in their force area to the Home Office than the main police recorded crime series. These returns are used to populate the Home Office database called the Homicide Index.
Separate Crime data integrity force reports for each of the 43 police forces in England and Wales were published in August 2014.
3. What is the extent of violent crime?
According to the year ending March 2016 Crime Survey for England and Wales (CSEW), there were 1.3 million incidents of violence experienced by adults in the previous 12 months in England and Wales1 (Appendix Table 1, year ending March 2016). This equates to 1.8% of adults aged 16 and over being a victim of violent crime.
Violence without injury (where the victim is punched, kicked, pushed or jostled with no resulting injury) accounted for just over half (55%) of all CSEW violent incidents.
Violence with injury is broken down into 2 types:
wounding (where the incident results in severe or more serious injury2) – this accounted for 24% of all violent incidents
assault with minor injury (where the victim is punched, kicked, pushed or jostled with resulting minor injury, such as scratches or bruises) – this accounted for 21% of violent incidents (Figure 1.1)
Figure 1.1: Types of violent crime, year ending March 2016 Crime Survey for England and Wales
Source: Crime Survey for England and Wales, Office for National Statistics
Download this chart Figure 1.1: Types of violent crime, year ending March 2016 Crime Survey for England and Wales
Image .csv .xlsViolent offences in police recorded data are referred to as “violence against the person” and include homicide, violence with injury and violence without injury. There were just under 1 million (992,424) violence against the person offences recorded by the police in the year ending March 20163. Of these, 57% were classified as violence without injury (equivalent to 560,838 offences) and 43% were classified as violence with injury (431,012 offences), similar to the breakdown shown by the CSEW. Police recording of a crime is based on the element of intent rather than outcome. Therefore incidents classified as violence with injury will include crimes based on the deliberate attempt of the perpetrator to cause serious bodily harm, regardless of whether any injury was sustained by the victim.
Over half of violence without injury offences (61%) recorded by the police in the year ending March 2016 were classified as assaults without injury4 (343,212 offences), with the remainder covering a range of offences, including harassment5, and threats to kill.
The majority of violence with injury offences (93%) were classified as assaults with injury (402,316 offences). Assaults with intent to cause serious harm accounted for a further 5% of violence with injury offences (23,029 offences).
There were 574 homicides recorded, which accounted for 0.1% of the total violence against the person offences. This differs slightly from the figure reported in the ‘Homicide’ chapter of this release (571), which uses more accurate data on homicide from the Home Office Homicide Index. Please see the ‘Homicide’ chapter for more information.
Violent crimes against children
The CSEW estimates the number of crimes against children6 aged 10 to 15 resident in households in England and Wales. These data are not directly comparable with the data related to adults7. The year ending March 2016 CSEW estimated there were 418,000 violent offences against such children in the previous 12 months. This equates to 5.8% of children aged 10 to 15 being a victim of violent crime, with over half of these (3.2% of children) experiencing assault with minor injury (Appendix Table 11, year ending March 2016).
The Home Office Data Hub provides some data on child victims of police recorded violent crime (see the ‘Experimental Statistics: Data on police recorded violent and sexual offences’ chapter of this release).
Notes for: What is the extent of violent crime?
'All violence' includes violence with injury (wounding, assault with minor injury), and violence without injury. For more information see Chapter 5.1 of the User Guide to Crime Statistics for England and Wales.
For example, cuts, severe bruising, chipped teeth, bruising or scratches resulting in medical attention or any more serious injury.
Recorded crime figures presented in this release are those notified to the Home Office and that were recorded in the Home Office database on 29 November 2016, covering the year ending March 2016 – see Appendix Table A4 for the full data table.
Assaults without injury offences are those where at the most a feeling of touch or passing moment of pain is experienced by the victim.
Harassment offences are those incidents where no other substantive notifiable offence exists, but when looked at as a course of conduct are likely to cause fear, alarm or distress.
These are based on a “preferred measure” that takes into account factors identified as important in determining the severity of an incident such as the relationship of the victim to the perpetrator and the level of injury to the victim. See Chapter 2 of the User Guide for further information.
As noted in Section 2.4 of the Home Office report on Experimental statistics on victimisation of children aged 10 to 15 published in 2010.
4. Interpreting trends in violent crime
For the population groups and offences it covers, the Crime Survey for England and Wales (CSEW) is the best source for assessing long-term trends in violent crime as the survey’s methodology has remained consistent over time.
The number of incidents of CSEW violence increased through most years of the 1980s before reaching a peak in 1995 (Figure 1.2). Since 1995, the level of violent crime measured by the CSEW has shown a substantial fall (67%). Between the year ending December 1995 and the year ending March 2002 surveys, the estimated annual number of incidents of violent crime fell by 41%, from 3.8 million to 2.3 million incidents, with more gradual decreases being recorded thereafter.
The general trend over the last decade has been a continued period of modest annual decreases. Though often not large enough to be statistically significant year-on-year, the cumulative effect of these changes has been statistically significant over the medium-term, with the estimated number of violent incidents having decreased by 29% between the year ending March 2009 and the year ending March 2016 surveys, to 1.3 million incidents. In the past few years, estimates of CSEW violence have been fairly flat, with no statistically significant change occurring since the year ending March 2014.
The recent trend in violent crime demonstrated by the CSEW is supported by research conducted by the Violence and Society Research Group at Cardiff University. Their annual survey, covering a sample of hospital emergency departments and walk-in centres in England and Wales, shows that serious violence-related attendances in 2015 were broadly similar to the level recorded in 2014 following a declining trend seen in earlier years. In addition, the most recent admissions data for NHS hospitals in England provide similar findings. Assault admissions1 showed very little change in the year ending March 2016, decreasing by less than 1% from the previous year.
Figure 1.2: Trends in police recorded and Crime Survey for England and Wales violent crime, year ending December 1981 to year ending March 2016

Source: Police recorded crime, Home Office and Crime Survey for England and Wales, Office for National Statistics
Notes:
- Police recorded crime data are not designated as National Statistics.
- The Home Office Counting Rules for police recorded crime were expanded in April 1998 to include certain additional summary offences. Figures before and after that date are not directly comparable.
- The National Crime Recording Standard (NCRS) was introduced in April 2002, although some forces adopted NCRS practices before the standard was formally introduced. Figures before and after that date are not directly comparable.
Download this image Figure 1.2: Trends in police recorded and Crime Survey for England and Wales violent crime, year ending December 1981 to year ending March 2016
.png (20.9 kB) .xls (41.0 kB)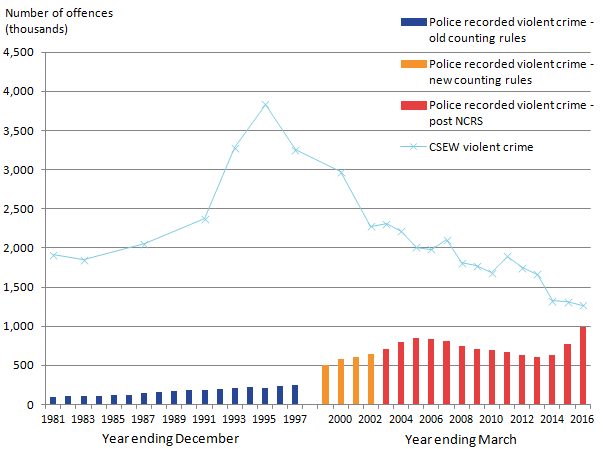
Following changes in recording practices from the introduction of the National Crime Recording Standard (NCRS) in April 20022, violence against the person offences recorded by the police rose to 845,673 offences in the year ending March 2005. Such major changes to the way that police record crime, including the expansion of the Home Office Counting Rules (HOCR) in April 1998 , mean that levels of police recorded crime cannot be compared across these recording changes.
Between the year ending March 2005 and March 2013, the number of “violence against the person” offences recorded by the police fell from 845,673 to 601,141. Since then, there have been substantial annual increases each year and the latest figures show there were 992,424 violent offences recorded in the year ending March 2016. This latest figure represents the highest number of violent crimes recorded by the police in a 12-month period since the introduction of the NCRS in 2002.
While both the police recorded figures and the CSEW showed reductions in violent crime between the year ending March 2008 and the year ending March 2013, police recorded violent crime fell at a faster rate (20%) than CSEW violent crime (8%). Over the last 3 years, the trends in the 2 sources have differed – CSEW violence has continued to fall but police recorded violent crime has increased by 65%, largely driven by the police response to findings of 2 recent HMIC inspections. More information on the increase in police recorded violent crime can be found in Annex 1.
For all crime, it is possible to calculate a ratio comparing the volume of CSEW reported crime and police recorded crime using measures of the comparable subset of crimes from both sources4. If all crimes from the CSEW subset were reported to the police and subsequently recorded by the police, the ratio would be 1.
The ratio demonstrates that the gap between the 2 series has narrowed substantially in the last few years. From the year ending March 2008, there were year-on-year reductions in the ratio, with the number of police recorded crimes falling as low as 0.71 of reported crimes in the CSEW in the years ending March 2012 and March 2013. The ratio has since increased each year, to 0.82 in the year ending March 2014, 0.89 in the year ending March 2015, and then to 0.97 in the year ending March 20165. This provides further evidence that improvement in police recording, rather than actual increases in criminality, has been the main driver of the rise in police recorded crime. The current ratio demonstrates that a greater proportion of crimes being picked up in the CSEW (and then reported by the victim) are recorded by the police.
Notes for: Interpreting trends in violent crime
‘Hospital Admitted Patient Care Activity, 2015-16’ provided by NHS Digital. Assault admissions do not include sexual offences but include assault codes X85 to Y04 and Y08 and Y09 from the dataset.
See Chapter 3.3 of the User Guide for further information.
The HOCR for recorded crime were expanded to include certain additional summary offences.
These are outlined in Section 4.1 of the User Guide.
For more information see section 4.2 of the User Guide.
5. What is happening to trends for different types of violent crime?
Trends in Crime Survey for England and Wales (CSEW) violence by type of violence1 show large reductions across all violent crime types between the mid to late 1990s and the year ending March 2016 (Figure 1.3). Assaults with minor injury have decreased by 80% since the peak in the year ending December 1995, while wounding and violence without injury decreased by 66% and 56% respectively.
There were an estimated 693,000 incidents of violence without injury in the year ending March 2016, which accounted for over half (55%) of all violence against adults in England and Wales. There was no statistically significant change from the previous year’s survey.
Wounding (307,000) and assaults with minor injury (268,000) also saw no significant change in the same period, although the estimated number of incidents of these types of violence is the lowest since the survey began.
Figure 1.3: Trends in violence by type of violence, year ending December 1981 to year ending March 2016 Crime Survey for England and Wales
Source: Crime Survey for England and Wales, Office for National Statistics
Download this chart Figure 1.3: Trends in violence by type of violence, year ending December 1981 to year ending March 2016 Crime Survey for England and Wales
Image .csv .xlsWithin the overall category of police recorded violence against the person, there were 431,012 offences of violence with injury in the year ending March 2016, an increase of 15% from the previous year. This follows a fluctuating trend since the year ending March 2003, where violence with injury peaked at 543,500 offences in the year ending March 2006, and then gradually declined before rising again from the year ending March 2014.
The majority of the increase in violence with injury between the year ending March 2016 and the previous year was made up of assaults with injury, which increased by 15% (a volume increase of 53,925) (Table A4, year ending September 2016). The increase also includes a 21% rise in the number of attempted murder offences (a volume increase of 118) in the last year. Attempted murder rose in 26 of the 44 police forces (including the British Transport Police) in England and Wales in the year ending March 2016 (Open Data Table); this increase may have been influenced by improvements in crime recording.
Prior to the recent improvements in recording practices, it is possible that some police officers may have been applying Crown Prosecution Service charging standards (guidelines on what charges should be brought against suspects) when deciding what type of crime to record rather than basing the decision on the Home Office Counting Rules (HOCR), which require offences to be recorded in line with the criminal offence committed. Attempted murder is an important example of this potential issue, as offences may have previously been recorded (and charged) as another type of violent crime that is easier to prove in court, such as “assault with intent to cause serious harm”.
The trend in the number of police recorded violence without injury offences was relatively flat between the years ending March 2006 and March 2014, fluctuating around 300,000 offences per year. Following this there was an increase of 30% to 403,584 offences in the year ending March 2015, and a 39% increase to 560,838 offences in the year ending March 2016. The majority of the increase in the most recent year was made up of harassment, which increased by 73,867 offences (91%) and assault without injury, which increased by 70,329 offences (26%).
In April 2015, harassment, a sub-category of violence without injury, was expanded to include 2 additional offences that were previously non-notifiable – “Disclosure of private sexual photographs and films with the intent to cause distress or anxiety” and “Sending letters with intent to cause distress or anxiety”. The large rise in harassment in the year ending March 2016 is almost entirely a result of the incorporation of these offences, as well as an increase in reporting rates (see the ‘Reporting violence to the police’ section of this chapter for more information). The expansion of the harassment category has been a significant contributor to the recent rise in violent crime, with the 2 additional offences contributing 43% to the increase in “violence without injury” sub-category2 and one-third (33%) to the overall rise in violence against the person offences, in the latest year.
A separate notifiable offence of stalking was introduced in April 2014, as a result of the Protection of Freedoms Act 2012. Stalking offences were previously embedded within other categories, including harassment. This change in the law should therefore be taken into account when looking at trends in harassment (Appendix Table 4, year ending September 2016).
Within the overall increase in violence without injury, threats to kill, cruelty to children or young persons and assault without injury on a constable also saw large increases in the year ending March 2016. Threats to kill increased by 4,409 offences (34%), cruelty to children or young persons increased by 3,780 offences (41%) and assault without injury on a constable increased by 1,090 offences (8%) (Appendix Table 4, year ending September 2016).
The large increases in the year ending March 2016 compared with the previous year are likely to be due to an improvement in crime recording by the police and an increase in the willingness of victims to come forward and report these crimes to the police, rather than a genuine rise in violent crime3. It is thought that recording improvements are more likely to affect relatively less serious violent offences, which explains the larger increase in violence without injury compared with violence with injury. Evidence provided by the Metropolitan Police4 states that, whilst violence against the person crimes recorded by them increased by 15%, the number of “calls for service”5 relating to violent crime decreased by 4% in the year ending March 2016, compared with a rise of 4% in the previous year. This, along with evidence from the CSEW, which shows no significant change in the prevalence of violent crime in recent years, suggests that the rise in recorded violence against the person is largely due to process improvements rather than a genuine increase in violent crime.
Modern slavery
Modern slavery can take multiple forms including sexual exploitation, forced labour and domestic servitude. Before 1 April 2015, modern slavery offences were recorded under trafficking for sexual exploitation, immigration offences, and other indictable or triable-either-way offences. As of 1 April 2015, a separately identifiable crime recording category of modern slavery was introduced. The Modern Slavery Act 2015 consolidated existing slavery and trafficking offences into one Act. These provisions came into force on 31 July 2015.
There were 880 modern slavery crimes recorded by the police in the year ending March 2016 (see Appendix Table 4, year ending September 2016). For more information on modern slavery, see Crime in England and Wales: year ending September 2016.
Notes for: What is happening to trends for different types of violent crime?
See Chapter 5.1 of the User Guide for more information on the offences included in this breakdown.
Figures taken from the Home Office Data Hub. The Home Office Data Hub (HODH) is intended to provide a central database of crime replacing existing statistical returns. Forces have been progressively switching over to the hub with 35 of the 44 police forces providing recorded crime data solely via this route.
The inspections that triggered improvements in recording took place between December 2013 and August 2014, which overlaps with part of the time period covered by the comparator year in this release (year ending March 2015).
Metropolitan Police Service Recorded Crime Figures and Associated Data published on London Datastore.
Calls for service refer to emergency and non-emergency calls from members of the public or police to attend an incident or investigate a case.
6. How are victims and perpetrators of violence related?
In the year ending March 2016 Crime Survey for England and Wales (CSEW), 43% (544,000 offences) of violent offences were perpetrated by an acquaintance1, 37% (467,000 offences) by a stranger2, and the remaining 20% (254,000 offences) were categorised as domestic violence perpetrated by a partner or ex-partner, or a family member (Figure 1.4). These figures have fluctuated over recent years, with acquaintance violence accounting for the largest proportion of offences in some years and stranger violence accounting for the largest proportion of offences in others (Figure 1.4).
Acquaintance violence
CSEW acquaintance violence fell by 70% from the peak of 1.8 million offences in the year ending December 1995 to an estimated 544,000 offences in the year ending March 2016 (Figure 1.4). There was no statistically significant change in the year ending March 2016 compared with the previous year. Acquaintance violence is a large-volume offence, and its substantial changes seen since the mid-1990s have been an important driver of changes in overall violence.
Stranger violence
Incidents of stranger violence have fallen by 53%, from the peak of 1 million offences in the year ending December 1995, to an estimated 467,000 offences in the year ending March 2016 (Figure 1.4). In recent years, stranger violence has shown the largest reduction in number of incidents, decreasing by 45% from 854,000 in the year ending March 2011. There was no statistically significant change in stranger violence in the year ending March 2016 from the previous year; however, the most recent figure is the lowest volume of stranger violence ever recorded by the survey.
Figure 1.4: Trends in violent crime by type of perpetrator, year ending December 1981 to year ending March 2016 Crime Survey for England and Wales
Source: Crime Survey for England and Wales, Office for National Statistics
Notes:
- The year ending December 1991 estimates for domestic, acquaintance and stranger violence were calculated based on the estimate for all violence. Estimates for these individual categories could not be calculated using their individual incidence rates because the data used for calculating these rates were not collected for that year.
Download this chart Figure 1.4: Trends in violent crime by type of perpetrator, year ending December 1981 to year ending March 2016 Crime Survey for England and Wales
Image .csv .xlsDomestic violence
Domestic violence here refers to incidents reported through the CSEW face-to-face interview3, but it is important to bear in mind that domestic violence measured this way is prone to significant under-reporting and is impacted by the current methodology for handling repeat victimisation; therefore the 254,000 incidents of domestic violence measured by the year ending March 2016 CSEW is an under-estimation of the true extent of domestic violence.
Of those aged 16 to 59 who reported being victims of physical domestic abuse in the CSEW self-completion4 module on intimate violence, only 16%5 also reported being a victim of domestic violence in the face-to-face interview. If the main face-to-face survey was able to capture domestic violence more accurately, then the proportion of CSEW violence that is domestic abuse-related would be much higher than the 20% reported here (Figure 1.4).
As mentioned above, the face-to-face CSEW measure of domestic violence is impacted by the current method of handling high frequency repeat victimisation. CSEW estimates of the number of crimes currently only include the first 5 incidents in a “series” of victimisations, that is, “the same thing, done under the same circumstances and probably by the same people”. This restriction to the first 5 incidents in a series has been applied since the CSEW began in order to ensure that estimates are not affected by a very small number of respondents who report an extremely high number of incidents and which are highly variable between survey years. This methodology, which is commonly used in general population surveys, has very little impact on most crime types, but has a larger impact on estimates of domestic violence given its often repeated nature.
We will be changing this methodology in the future (see the ‘Things you need to know’ section of this chapter for more information on the review of the current and alternative methods and the proposed change to the methodology) however, even with the new methodology, estimates obtained from the face-to-face CSEW interview will still be a large under-estimation of the level of domestic violence experienced by adults within England and Wales because of the high level of under-reporting of this type of violence in face-to-face interviews. More information can be found in section 2 of the User Guide for Crime Statistics.
The 254,000 incidents of domestic violence estimated by the face-to-face CSEW in the year ending March 2016 can therefore only tell us that 20% of the violence measured by this source was domestic violence, and does not provide an indication of the true level of domestic violence. The separate self-completion section of the survey, collected on a comparable basis since the year ending March 2005, is the more complete measure of such crime and also uses a broader definition of domestic abuse6. The self-completion module reveals significantly higher levels of domestic abuse victimisation, and provides a greater level of detail (see the ‘Domestic abuse, sexual assault and stalking’ chapter of this release)7.
Notes for: How are victims and perpetrators of violence related?
Acquaintance violence is comprised of wounding and assaults in which the victim knew one or more of the perpetrators at least by sight. It does not include domestic violence.
Stranger violence includes wounding and assaults in which the victim did not have any information about the perpetrator(s), or did not know and had never seen the perpetrator(s) before.
In a “face-to-face” interview, an interviewer reads the questions out to the respondent and records the answers given.
“Self-completion” means that the respondent reads the questions themselves and records their answers directly onto a laptop.
In previous years, this analysis has included victims of any sexual assault by a partner or family member but these victims have now been excluded to be more comparable with the definition of domestic violence used in the face-to-face CSEW interview.
The definition includes emotional or financial abuse and threats to hurt the respondent or someone close to them, rather than just physical violence.
The self-completion module gives a more accurate picture of the extent of domestic abuse as respondents are more willing to report domestic abuse in this self-completion module than in the face-to-face part of the survey.
7. What do we know about sexual offences?
The most recent estimates from the self-completion module on intimate violence in the Crime Survey for England and Wales (CSEW) showed that 2.0% (equivalent to 645,000 victims) of adults aged 16 to 591 had been victims of sexual assaults in the last year2. The prevalence of sexual assault was not statistically significantly different than the previous year’s survey (1.7%). The figure has remained at around 2% since the survey year ending March 2009, albeit with some year-on-year fluctuation (Appendix Table 4.05). More detailed commentary on trends in sexual offences from the CSEW is included in the ‘Domestic abuse, sexual assault and stalking’ chapter of this publication.
There were 106,098 police recorded sexual offences in the year ending March 2016, an increase of 20% compared with the previous year. This continues an upward trend since the year ending March 2012, which appears to be driven by improved recording processes and a greater proportion of victims willing to report such crimes to the police. The latest figure is the highest since the introduction of the National Crime Recording Standard (NCRS) in April 2002. The rate of year-on-year increases, however, appears to be slowing, with the latest increase being considerably less than that for the previous year (38%).
Within the overall increase, the number of offences of rape increased by 22% to 35,699 offences, and the number of other sexual offences increased by 19% to 70,399 offences (Appendix Table 4, year ending September 2016), both of which are the highest figures since the introduction of the NCRS in 2002. Within the category of “other sexual offences”, the largest increases were seen in sexual assault on a female aged 13 and over (20% increase to 27,852), sexual activity involving a child under 16 (31% increase to 11,337) and sexual grooming (51% increase to 1,021).
The increase in police recorded sexual offences is thought to reflect both an improvement in the recording of sexual offences by the police and an increased willingness of victims to come forward to report these crimes to the police. Therefore, it is not thought that these figures currently provide a reliable indication of trends in sexual offences. These figures should be seen in the context of a number of high-profile reports and inquiries, which are thought to have resulted in police forces reviewing and improving their recording practices3, including HMIC’s inspection of crime recording, published in late 2014, which concluded that across England and Wales an estimated 1 in 4 (26%) sexual offences that should have been recorded as crimes were not4.
Previous increases in the number of sexual offences reported to the police were shown to have also been related to a rise in the reporting of non-recent offences (those that took place over 12 months before being reported) following “Operation Yewtree”, which began in 20125. The high-profile coverage of this operation and the police response to it are likely to have increased the willingness of victims to come forward to report such offences, both current and non-recent. Information from the Home Office Data Hub shows that in the year ending March 2016, 80% of sexual offences were recorded within 12 months of the offence taking place (recent offences), with 20% occurring more than one year before they were reported (non-recent offences). There have been increases in both current sexual offences (up 22%) and non-recent sexual offences (up 15%) over the last year. The number of offences that took place over 20 years ago is 8% higher in the year ending March 2016 compared with the previous year. These offences are increasing despite Operation Yewtree starting in October 2012.
Notes for: What do we know about sexual offences?
ONS are considering improving the population coverage by removing this upper age limit for the self-completion module. For more information see section 2 of ‘Improving Crime Statistics for England and Wales – progress update’ published on 19 January 2016.
Including attempted offences.
These high profile reports include the investigation by Her Majesty’s Inspectorate of Constabulary (HMIC) and HM Crown Prosecution Service Inspectorate (HMCPSI) in 2012, which highlighted the need to improve the recording and investigation of sexual offences.
For more information see the ‘Accuracy of the Statistics’ section in the statistical bulletin, Crime in England and Wales: Year Ending September 2014.
For more information see Crime in England and Wales, Year Ending September 2013.
8. Levels of victimisation
The Crime Survey for England and Wales (CSEW) provides victimisation rates for overall violence and for each individual type of violence.
Based on those interviewed in the year ending March 2016, 1.8% of adults aged 16 and over were a victim of violent crime, 0.9% were a victim of violence without injury, 0.5% a victim of wounding, and 0.4% a victim of assault with minor injury in the previous 12 months (Figure 1.6). Figures were similar to the previous year’s survey.
Victimisation rates for violent crime have fallen considerably since 1995 when crime was at its peak. The latest figure (1.8%) is less than half that estimated by the year ending December 1995 survey (4.8%).
Victimisation rates for all types of CSEW violence have dropped by more than half between the year ending December 1995 and the year ending March 2016. The largest decline over this period has been for assault with minor injury, which at 0.4% in the year ending March 2016 was around a fifth of the rate in the year ending December 1995 (1.9%).
Figure 1.5: Violent crime, victimisation of adults aged 16 and over, year ending December 1995 and year ending March 2016 Crime Survey for England and Wales
Source: Crime Survey for England and Wales, Office for National Statistics
Download this chart Figure 1.5: Violent crime, victimisation of adults aged 16 and over, year ending December 1995 and year ending March 2016 Crime Survey for England and Wales
Image .csv .xlsThe year ending March 2016 CSEW estimated that 5.8% of children aged 10 to 15 were a victim of violent crime in the preceding 12 months, showing no statistically significant change from the previous year’s survey. Within all violent crime, children were more commonly victims of violence with injury than violence without injury (4.4% compared with 1.5%)1 (Appendix Table 11, year ending March 2016).
Repeat victimisation
This section provides information on the repeat victimisation experienced by victims of violence. However, the most common type of violence to be experienced on a repeated basis is domestic violence, which is not well measured by the face-to-face interview of the CSEW (see the ‘Domestic violence’ section of this chapter for more information). Therefore, the analysis can only be used to draw conclusions about the repeat victimisation of the violence measured by this source, and cannot be used to draw any conclusions about the overall level of repeat victimisation experienced, or the repeat victimisation of victims of domestic violence.
We are reviewing the current methodology for handling repeat victimisation (see the ‘Things you need to know’ and ‘Domestic violence’ sections of this chapter for more information), but this will not address the high level of under-reporting of domestic violence in face-to-face interviews. In addition, no information on the repeat victimisation of sexual offences is provided as these offences are not included in the survey’s main estimates (see the ‘Domestic abuse, sexual assault and stalking’ chapter of this release for more information).
In the year ending March 2016 survey, the CSEW showed that 75% of victims of violence were victimised once, while 25% were repeat victims in the previous 12 months (11% victimised twice, 14% victimised 3 times or more, Figure 1.6). The level of repeat victimisation shows no significant change from the previous year’s survey, but has significantly decreased by 14 percentage points since 1995 (Annual Trend and Demographic Table D6, year ending March 2016). The latest estimates showed that 51% of violent incidents were experienced by repeat victims, compared with 69% in the year ending December 1995 (when CSEW violence peaked) and 57% in the year ending March 2006 (Annual Trend and Demographic Table D7).
Repeat victimisation was most common for violence without injury (26% of victims). Levels of repeat victimisation were similar for both wounding (18%) and assault with minor injury (17%).
Figure 1.6. Number of times victims were victimised, year ending March 2016 Crime Survey for England and Wales
Source: Crime Survey for England and Wales, Office for National Statistics
Download this chart Figure 1.6. Number of times victims were victimised, year ending March 2016 Crime Survey for England and Wales
Image .csv .xlsRepeat victimisation of assault with minor injury has fluctuated over the years but has decreased significantly by 16 percentage points since 1995 and is at its lowest since the survey began. Repeat victimisation of wounding has shown more volatile fluctuations from year-to-year, but with no significant change from the year ending December 1995. Repeat victimisation of violence without injury has also fluctuated over the years, but has decreased significantly by 13 percentage points since 1995 (Appendix Table 1.08).
In the year ending March 2016, 30% of victims of domestic violence measured by the CSEW were repeat victims (Figure 1.7), higher than for violence by either an acquaintance (27%) or a stranger (10%). However, it should be noted that these proportions fluctuate considerably from year-to-year and this does not provide a complete picture of repeat victimisation suffered by victims of domestic abuse.
The CSEW self-completion module provides a more complete measure and a greater level of detail on domestic abuse. We are also developing questions to better measure frequency of abuse (and therefore repeat victimisation) in the self-completion module (see ‘Domestic abuse, sexual assault and stalking’ chapter of this publication for more information).
Figure 1.7: Proportion of victims of violence aged 16 and over who were victimised more than once, by relationship to perpetrator, year ending December 1981 to year ending March 2016 Crime Survey for England and Wales
Source: Crime Survey for England and Wales, Office for National Statistics
Notes:
- Prior to year ending March 2002, CSEW respondents were asked about their experience of crime in the previous calendar year, so year-labels identify the year in which the crime took place. Following the change to continuous interviewing, respondents' experience of crime relates to the full 12 months prior to interview (i.e. a moving reference period), so year-labels from year ending March 2002 onwards identify the CSEW year of interview.
Download this chart Figure 1.7: Proportion of victims of violence aged 16 and over who were victimised more than once, by relationship to perpetrator, year ending December 1981 to year ending March 2016 Crime Survey for England and Wales
Image .csv .xlsNotes for: Levels of victimisation
- Some methodological differences between the adult and children’s surveys mean that direct comparisons cannot be made between the adult and child victimisation data.
9. Characteristics associated with being a victim
The proportion of adult victims of violent crime in the year ending March 2016 survey varied by certain personal and household characteristics (see Appendix Tables 1.01 to 1.04 for a full breakdown). Many of the characteristics are closely associated with each other, so caution is needed in the interpretation of these different characteristics when viewed in isolation. Separate analysis on the characteristics associated with being a victim of intimate violence is available in the ‘Domestic abuse, sexual assault and stalking’ chapter of this publication.
The main characteristics were:
- Men were more likely to be a victim of violent crime measured by the face-to-face Crime Survey for England and Wales (CSEW) interview than women (2.2% of males compared with 1.4% of females1, Figure 1.8)2, with stranger violence showing the largest difference in victimisation between men and women (1.2% compared with 0.4%).
- Adults aged 16 to 24 were more likely to be a victim of violent crime (3.7%), particularly acquaintance or stranger violence (1.8%) than any other age group (Appendix Table 1.03).
- Those who were widowed (0.5%) or were married or civil partnered (1.1%) were less likely to be a victim of violent crime than adults with any other marital status.
- Adults living in the 20% most deprived output areas were more likely to be a victim of violent crime (2.5%) than those living in other output areas (1.7%) – particularly those living in the 20% least deprived output areas (1.2%).
- Renters (2.8% social and 2.4% private) were more likely to be a victim of violent crime than home owners (1.3%) (Appendix Table 1.02).
Figure 1.8: Characteristics associated with being a victim of violence, year ending March 2016 Crime Survey for England and Wales
Source: Crime Survey for England and Wales, Office for National Statistics
Notes:
- See Section 7.3 of User Guide for definitions of personal characteristics.
Download this chart Figure 1.8: Characteristics associated with being a victim of violence, year ending March 2016 Crime Survey for England and Wales
Image .csv .xlsThe children’s element of the survey, covering respondents aged 10 to 15, showed that boys were more likely than girls to have experienced violent crime (7.3% compared with 4.2%). See Tables D3 and D4 of the Annual Trend and Demographic Tables, year ending March 2016 for more information.
Notes for: Characteristics associated with being a victim
This pattern is different for domestic abuse and sexual assault. For more information please see the ‘Domestic abuse, sexual assault and stalking' chapter of this publication.
These estimates contrast with police recorded data from the Home Office Data Hub, which found that the victim was female in 53% of violent offences and male in 47% of offences (see Chapter 5 of this release for more detail).
10. Profile of perpetrators involved in violent crimes
Victims of violent crime were able to provide some detail about the perpetrator(s) for 99% of incidents (Nature of Crime Table 3.1). The following profiles are based on the victims' recollection and perception of the perpetrator(s).
Perpetrators were most likely to be male, being reported to be the perpetrator in three-quarters of violent incidents (76%). Perpetrators were also most likely to be aged between 25 and 39, with the perpetrator believed to belong to this age group in 42% of violent incidents.
In 74% of violent incidents, a sole perpetrator was reported to have been responsible. For incidents with more than one perpetrator, victims most commonly reported that 4 or more perpetrators (11% of incidents) or 2 perpetrators (10% of incidents) were involved.
The number of perpetrators involved varied by the relationship between the victim and the perpetrator. Only 1% of domestic violence incidents involved more than one perpetrator, compared with 24% of incidents of acquaintance violence and 43% of incidents of stranger violence. Incidents involving 4 or more perpetrators accounted for 14% of acquaintance violence and 15% of stranger violence, but no incidents of domestic violence.
Victims believed the perpetrator(s) to be under the influence of alcohol in 40% (491,000) of violent incidents1. In 19% (237,000) of violent incidents, the victim believed the perpetrator(s) to be under the influence of drugs (Nature of Crime Table 3.11). Characteristics of perpetrators of alcohol-related violent crime can be found in Appendix Table 1.07.
Victims aged 10 to 15 were able to say something about the perpetrator in 94% of violent incidents in the year ending March 2016 Crime Survey for England and Wales (CSEW). Incidents of violence against children were most likely to be committed by someone known well to the victim (52% of incidents), with a small proportion of incidents being committed by strangers (12%). The perpetrator was a pupil at the victim’s school in 68% of violent incidents, and was a friend (including boyfriend or girlfriend) in 11% of incidents. The perpetrator was most likely to be male (81% of incidents) and aged between 10 and 15 (78%) (Nature of Crime Table 4.3).
Notes for: Profile of perpetrators involved in violent crimes
- Questions were asked if the victim was able to say something about the perpetrator(s), which they could do in nearly all (99%) incidents. If there was more than one perpetrator, victims were asked if any of the perpetrators were perceived to be under the influence. Questions were not asked if any perpetrator was perceived to be under 10 years.
11. Reporting violence to the police
Victims of violent crime were asked if they reported the incident to the police. In the year ending March 2016, the Crime Survey for England and Wales (CSEW) estimated that 52% of violent incidents were reported to the police. This is similar to the figure for the previous year (49%), but shows a 10 percentage point increase from the year ending March 2012 survey. However, the figure has remained fairly flat over the last few years (Annual Trend and Demographic Table D8, year ending March 2016). This latest reporting rate for violence compares with a reporting rate for all CSEW crime of 42%.
As in previous years, variations in reporting rates continue to occur by type of violence, with 65% of wounding incidents in the latest survey year being reported to the police compared with 48% of incidents of assault with minor injury or no injury (Figure 1.9). This indicates respondents are more likely to report more serious incidents to the police.
Figure 1.9: Proportion of violent crime incidents reported to the police, year ending March 2016 Crime Survey for England and Wales
Source: Crime Survey for England and Wales, Office for National Statistics
Download this chart Figure 1.9: Proportion of violent crime incidents reported to the police, year ending March 2016 Crime Survey for England and Wales
Image .csv .xlsIn the year ending March 2016, the CSEW showed that 14% of violent incidents experienced by children aged 10 to 15 were reported to the police (Nature of Crime Table 4.5). This figure is likely to reflect the relative low severity of violent incidents experienced by children.
Nôl i'r tabl cynnwys12. When do violent crimes occur?
Victims of violent crime were asked about the circumstances of the incident during the Crime Survey for England and Wales (CSEW) interview, including when it happened. More than half of violent incidents (53%) occurred in the evening or during the night (Nature of Crime Table 3.3). Although the decrease of 4 percentage points from the previous year was not statistically significant, this is the lowest percentage of evening or night violent incidents recorded since the year ending March 2006.
Looking at the days of the week on which violent offences take place, 59% of violent incidents occurred during the week, with 41% occurring at the weekend (Table 1.1). This differs from the previous 2 years, when the majority of violent offences took place at the weekend and is significantly higher than the percentage of violent incidents that occurred during the week in the year ending March 2015. However, there is some fluctuation in this trend, and prior to this, the majority of violent offences took place during the week. It is therefore too early to conclude whether the change seen in the year ending March 2016 is the beginning of a new pattern. Timing of alcohol-related violent crime can be found in Appendix Table 1.05.
In the year ending March 2016, 90% of incidents of violence against children aged 10 to 15 occurred during the week and 10% of incidents occurred at the weekend. This highlights the different lifestyles of children compared with adults, and also reflects the fact that a large proportion of violent incidents against children (71%) occurred in and around school (Nature of Crime Tables 4.1 and 4.2).
Table 1.1: Timing of violent incidents, year ending March 2016 Crime Survey for England and Wales
| England and Wales | Percentage adults aged 16 and over/children aged 10 to 15 | |||||
| Timing | All Violence | Wounding | Assault with minor injury | Violence without injury | Violence against children aged 10 to 15 | |
| Morning/Afternoon1 | 47 | 39 | 37 | 54 | .. | |
| Evening/Night2 | 53 | 61 | 63 | 46 | .. | |
| Unweighted base - number of adults | 631 | 176 | 149 | 306 | ||
| During the week | 59 | 56 | 55 | 62 | 90 | |
| At the weekend3 | 41 | 44 | 45 | 38 | 10 | |
| Unweighted base - number of adults/number of children aged 10 to 15 | 620 | 176 | 143 | 301 | 202 | |
| Source: Crime Survey for England and Wales, Office for National Statistics | ||||||
| Notes: | ||||||
| 1. Morning is from 6am to noon; afternoon is from noon to 6pm. | ||||||
| 2. Evening is from 6pm to midnight; night is from midnight to 6am. | ||||||
| 3. Weekend is from Friday 6pm to Monday 6am. | ||||||
| .. Denotes 'not available' | ||||||
Download this table Table 1.1: Timing of violent incidents, year ending March 2016 Crime Survey for England and Wales
.xls (37.9 kB)13. Where do violent crimes occur?
In addition to asking respondents about the timing of violent crime, the Crime Survey for England and Wales (CSEW) interview also asks about where such crimes took place. Similar to previous years, the location of incidents of violent crime varied by the perpetrator-victim relationship.
As expected, the large majority of incidents of domestic violence occurred around the home (79%), whereas incidents of stranger violence were most likely to occur either around work (28%) or in pubs and clubs (25%). Incidents of acquaintance violence were most likely to take place at work1 (41%, Figure 1.10). Where alcohol-related violent crime occurred can be found in Appendix Table 1.06.
Figure 1.10: Where incidents of violent crime occurred, year ending March 2016 Crime Survey for England and Wales
Source: Crime Survey for England and Wales, Office for National Statistics
Notes:
- 'Around the home' includes home premises, whether inside/outside or garage/shed, home car park or nearby street to home.
- 'Around work' includes work premises, whether inside/outside or work garage/car parks.
- 'Street' includes streets near work/college/sports ground/public entertainment/train or tube stations etc., subway, park/open spaces, waste grounds, and street markets.
- 'Pub or club' includes pub/club premises, whether inside or nearby street/car parks.
- ‘Other location’ includes car parks, inside or grounds of a shop/supermarket, a school/college/university, a friends home, a place of entertainment, sports centre or somewhere else
Download this chart Figure 1.10: Where incidents of violent crime occurred, year ending March 2016 Crime Survey for England and Wales
Image .csv .xlsLooking at the location of these incidents split by type of violence (Nature of Crime Table 3.2), incidents of wounding and assault with minor injury were most likely to occur around the home (43% and 32% respectively). For assault with minor injury this has been the case since the year ending March 2013 with small but non-significant changes year-on-year. However, for wounding the proportion of incidents that occurred around the home has increased by 23 percentage points since the previous year and is the largest figure since the year ending March 20132. Similarly to previous years, incidents of violence without injury were most likely to happen at work (37%).
Notes for: Where do violent crimes occur?
- For more information see Health Safety Executive ‘Violence at work’ report using CSEW data.
- From April 2012, a new location variable was introduced, which means the data from the year ending March 2006 to the year ending March 2012 is not comparable with more recent years.
14. The impact on victims
The Crime Survey for England and Wales (CSEW) asks victims about the impact of the crime they had experienced (Nature of Crime Table 3.4). In 75% of violent incidents the respondent was “emotionally affected”, including 18% who were affected very much (Figure 1.11). The proportion of violent incidents where the victim was emotionally affected “very much” was lower than for incidents of burglary (24%), but higher than for other types of crime (for example, criminal damage, at 12%) (Nature of Crime Tables 8.5 and Focus on Property Crime, 2015 to 2016). The respondent was “not emotionally affected” in 25% of violent incidents. This figure has increased from 19% in the previous year, but tends to fluctuate from year to year.
Incidents of wounding “emotionally affected” a higher proportion of victims (90%) than other types of violence (violence without injury 72%, and assault with minor injury 68%). In terms of the severity of the emotional impact, as expected, wounding was the type of violence where victims were most severely affected, with the majority (68%) reporting that they were “very emotionally affected” or “affected quite a lot”. In comparison, around a third of victims of assault with minor injury (36%) and around a quarter of victims of violence without injury (27%) reported being “very emotionally affected” or “affected quite a lot”.
The most common forms of emotional reaction to violent crimes in the year ending March 2016 CSEW were annoyance (41%), anger (37%) and shock (36%)1. The emotional reaction was broadly similar across different types of injury (Nature of Crime Table 3.4).
Figure 1.11: Emotional response to violent crime victimisation, year ending March 2016 Crime Survey for England and Wales
Source: Crime Survey for England and Wales, Office for National Statistics
Download this chart Figure 1.11: Emotional response to violent crime victimisation, year ending March 2016 Crime Survey for England and Wales
Image .csv .xlsVictims of violence were also asked to rate the seriousness of each incident on a scale of 1 to 20, and the means of these seriousness scores are represented by the bars in Figure 1.122. As in previous years, wounding was considered to be a more serious violent crime (mean score of 9) than assault with minor injury (mean score of 6) and violence without injury (mean score of 6). Over half of all violence victims (59%) rated the incident in the least serious range of 1 to 6, with 12% rating it in the most serious range of 14 to 20 (Nature of Crime Table 3.5).
Figure 1.12: Mean perceived seriousness score of violent crime, year ending March 2016 Crime Survey for England and Wales
Source: Crime Survey for England and Wales, Office for National Statistics
Download this chart Figure 1.12: Mean perceived seriousness score of violent crime, year ending March 2016 Crime Survey for England and Wales
Image .csv .xlsVictims aged 10 to 15 were also asked about their perceptions of any violent incidents they experienced. Based on the year ending March 2016 survey, 21% of victims aged 10 to 15 thought the violent incident was “a crime”, 42% perceived it to be “wrong, but not a crime”, and 37% thought it “was just something that happens”. In addition, 52% of incidents were perceived by the victim to be part of a series of bullying incidents (Nature of Crime Table 4.4). In comparison, 32% of theft victims aged 10 to 15 perceived the incident to be “a crime” (Nature of Crime Table 10.4). This reflects the fact that the measure of violence against children aged 10 to 15 includes a large proportion of low-level incidents, which may involve a crime in law (for example, one child deliberately pushing over another with the intention of hurting them) but which may not be viewed as serious enough to amount to an offence (see report on Experimental statistics on victimisation of children aged 10 to 15).
Notes for: The impact on victims
Respondents can report more than one emotion.
Respondents are asked to use this scale, with 1 being “a very minor crime like theft of milk bottles from a doorstep”, and 20 being “the most serious crime of murder”.
15. Use of weapons and injuries in violent crime
A weapon was used in 21% of violent incidents according to the year ending March 2016 Crime Survey for England and Wales (CSEW) (Nature of Crime Table 3.8). Weapons were used in a higher proportion of incidents of violence without injury (28%) than incidents of violence with injury (13%). The most commonly used weapon was a knife or other stabbing implement1 (used in 6% of violent incidents).
For more information on the use of weapons in violent incidents, please see the ‘Offences involving the use of weapons’ chapter of this publication, which contains analysis of police recorded violent crime involving knives and firearms.
Victims sustained a physical injury in 45% of incidents of violence in the year ending March 2016 CSEW. This varied by perpetrator, with 58% of incidents of domestic violence resulting in physical injury compared with 42% of both acquaintance violence and stranger violence incidents. The most common type of weapon used in domestic violence was a stabbing implement (used in 13% of violent incidents). A hitting implement2 was the most common (8%) in acquaintance violence and stones were the most common (4%) in stranger violence. A stabbing implement was the most common weapon used for wounding (6%) and for violence without injury (8%).
The most common type of injury in incidents of violence was minor bruising or black eye (27% of incidents). A lower proportion of incidents involved more serious injuries such as broken bones (3%), concussion or loss of consciousness (1%) or a broken nose (1%) (Nature of Crime Table 3.7).
The survey also asks children about injuries sustained through violence. Based on the year ending March 2016 CSEW, 78% of victims aged 10 to 15 sustained an injury and 21% of victims received some form of medical attention as a result of the violent incident. Of those incidents where the victim aged 10 to 15 sustained an injury, minor bruising or black eye was the most common injury (67%), followed by scratches (28%) and marks on skin (22%). In 7% of violent incidents where the victim aged 10 to 15 sustained an injury, this was a serious injury3 (Nature of Crime Table 4.6).
Notes for: Use of weapons and injuries in violent crime
Includes screwdrivers and other stabbing implements.
Includes sticks, clubs and other hitting implements.
3.Serious injury includes facial/head injuries, broken nose, concussion, broken bones.
Nôl i'r tabl cynnwys16. Findings from the 2015 Commercial Victimisation Survey (CVS)
The 2015 CVS1,2 examined the extent of crime across 4 business sectors in England and Wales in the previous 12 months3, including, among other crimes, the extent of assaults and threats.
Across the 4 sectors, the wholesale and retail sector experienced the highest number of assaults and threats (401,000) making up 9% of all incidents against this sector. This crime had been experienced by 8% of wholesale and retail premises in the previous 12 months (Figure 1.13). Premises that were victims of assaults and threats experienced a high level of repeat victimisation, with an average of 13 incidents per victimised premises in the 12 months prior to interview.
Figure 1.13: Proportion of premises that experienced assaults and threats in the last 12 months, by industry sector, 2015 Commercial Victimisation Survey England and Wales
Source: Home Office, 2015 CVS headline tables
Download this chart Figure 1.13: Proportion of premises that experienced assaults and threats in the last 12 months, by industry sector, 2015 Commercial Victimisation Survey England and Wales
Image .csv .xlsThe information and communication sector experienced a much lower number of assaults and threats (4,000) in the previous 12 months compared with the wholesale and retail sector. Such crimes accounted for 14% of all crimes against the information and communication sector. Within this sector, a smaller proportion of premises experienced assaults and threats (3%) compared with the wholesale and retail sector (Commercial Victimisation Survey: data tables).
In the construction sector, a lower number of assaults and threats (45,000) were experienced compared with the wholesale and retail sector, but these crimes accounted for almost a third (32%) of all crimes against the construction sector, the largest proportion of all 4 sectors.
The agriculture, forestry and fishing sector had the lowest proportion of premises experiencing assaults and threats (2%, 8,000 incidents) in the 12 months prior to interview. Such crimes accounted for 8% of all crimes against this sector.
The number of assaults and threats experienced per 1,000 premises increased with the size of the premises for all sectors4 (Figure 1.14).
Figure 1.14: Proportion of premises that experienced assaults and threats in the last 12 months, by number of employees and sector type, 2015 Commercial Victimisation Survey England and Wales
Source: Home Office, 2015 CVS Headline Tables
Notes:
- There were no respondents in 10 - 49 and 50+ employee premises for the Information and Communication sector.
Download this chart Figure 1.14: Proportion of premises that experienced assaults and threats in the last 12 months, by number of employees and sector type, 2015 Commercial Victimisation Survey England and Wales
Image .csv .xlsNotes for: Findings from the 2015 Commercial Victimisation Survey (CVS)
Some of the offences covered in the CVS could also be picked up by the CSEW estimates and police recorded crime.
Results from the 2016 CVS will be published in May 2017.
The CVS is a telephone interview, for which the 2015 survey was based on 3,204 interviews with respondents at premises in the 4 industry sectors of wholesale and retail; construction; information and communication; and agriculture, forestry and fishing. Nearly half of these interviews were with respondents from the wholesale and retail sector. Between them, these 4 sectors accounted for just over two-fifths of all business premises in England and Wales in 2015.
Except information and communications as there were no respondents in the larger premises in this sector.
17. Annex 1 – Drivers of the increase in police recorded violent crime
The 65% increase in police recorded violent crime between the years ending March 2013 and March 2016 has been largely driven by the police response to findings of 2 recent HM Inspectorate of Constabulary (HMIC) inspections.
Firstly, the Crime-recording: making the victim count report published by HMIC found that violence against the person offences had the highest under-recording rates across police forces in England and Wales. Action taken by police forces to improve their compliance with the National Crime Recording Standard (NCRS) given the renewed focus on the accuracy of crime recording has resulted in an increase in the number of offences recorded. For more information see the ‘Accuracy of the statistics’ section in the statistical bulletin, Crime in England and Wales, year ending March 2016.
Secondly, it is likely that there has been an increase in the reporting of domestic abuse and subsequent recording of these offences by the police, as a result of an improved response by police to domestic abuse following a HMIC inspection in 2013 on the handling of domestic abuse incidents. The 2015 HMIC report, Increasingly everyone’s business: A progress report on the police response to domestic abuse found there was an increased focus among police forces to developing evidence-led prosecutions around domestic abuse. The report also found that response officers now have a greater awareness of the importance of collecting evidence at the scene (for example, using body-worn cameras) so that prosecutions can continue even if the victim does not support further action.
The renewed focus on the quality of crime recording means that caution is needed when interpreting statistics on police recorded crime. While we know that it is likely that improvements in compliance with the NCRS have led to increases in the number of crimes recorded by the police (for example, violent crime and sexual offences), it is not possible to quantify the scale of this or assess how this effect and timing of improvements varied between different police forces.
Increases in police force area data may reflect a number of factors including improved recording practice1, increases in reporting by victims and also possibly some genuine increases in the levels of crime in some police forces.
Notes for: Annex 1 – Drivers of the increase in police recorded violent crime
- For further information on possible explanations of increasing police recorded crime levels see Chapter 3 of the User Guide.