Cynnwys
- Main points
- Things you need to know
- Background
- Context
- Births by socio-economic status and age of mothers
- Births by socio-economic status and age of mothers for UK and non-UK born women
- Socio-economic status and average age of mother for UK and non-UK born women
- Socio-economic status of mother and birth order
- Birth order, socio-economic status and mother’s age
- Related links to publications within ONS
- Quality and methodology
1. Main points
In 2014, the most common NS-SEC category (8-class grouping) for women giving birth was lower managerial and professional occupation (such as nurses, teachers and journalists). This accounted for 22% of all births.
Women aged 30 and over who were having children in 2014 were more likely to be in managerial and professional occupational groups.
A third (33%) of the births to UK born women in 2014 were to mothers in managerial and professional occupations, this compared with a quarter (23%) of the births to non-UK born women in the same occupational group.
UK born women having their first birth in 2014 were most likely to be in managerial and professional occupations whereas non-UK born mothers having their first birth were more likely to have an unclassified occupation.
Nôl i'r tabl cynnwys2. Things you need to know
This article is based on birth registration data for England and Wales for the year 2014. Births data for 2015 have now been published. Only births to mothers with a usual residence in England and Wales have been included within this analysis.
This article focuses on the woman’s socio-economic status (as measured by the National Statistics Socio-economic Classification or NS-SEC) at birth registration – rather than the socio-economic status of the household or the father. This is so we can look at the interactions between women’s age and socio-economic status and the impact that this can have on childbearing. In the context of a household’s socio-economic status, some women’s childbearing outcomes will be affected by their partner’s NS-SEC. It should be noted that this differs to the Births by Parent’s Characteristics release, in which we use a combined method for reporting NS-SEC, using the most advantaged NS-SEC of either parent and creating a household level classification.
Nôl i'r tabl cynnwys3. Background
The literature on fertility and socio-economic status has mainly concentrated on the effects of educational attainment (Berrington, Stone, Beaujouan, 2015)1, and wealth or "social standing" (Skirbekk, 2008)2 on childbearing behaviour.
More recently, attention has concentrated on the impact of applying a combined approach to NS-SEC (Pope, 2013)3, where a household level classification is used (taking the highest NS-SEC in the household) while other research has focused on investigating couples’ procreative behaviour with regard to the gender socio-economic (in) equality between partners (Osiewalska, 2015)4.
By contrast, this article only focuses on National Statistics Socio-economic Classification (NS-SEC) based on the mother’s occupation, which is recorded when a birth is registered. As such the article seeks to explore the association between a woman’s NS-SEC and her childbearing outcomes. While women’s childbearing outcomes may be affected by the father’s NS-SEC, this is out of the scope of this article.
Notes:
Berrington, A et all (2015) Educational differences in childbearing widen in Britain.
Pope, M. (2013) A combined approach to NS-SEC: an investigation into the potential impact on birth and infant mortality statistics. Office for National Statistics.
Osiewalska, (2015) Couple socioeconomic gender equality and fertility: A Bayesian analysis.
4. Context
In 2014, the standardised1 mean age of all mothers giving birth in England and Wales was 30.22 years. This has been rising over time, as has the standardised mean age of women having a first birth. In 2014, this was 28.5 years, compared with 27.1 years a decade earlier in 2004.
In 2014 in England and Wales, 38% of live births were first births, 36% were second births and 16% were third births3.
The total fertility rate (TFR)4 for all women in England and Wales decreased slightly in 2014 to an average of 1.83 children per woman, from 1.85 in 2013. The TFR for UK born women remained fairly stable in 2014 at 1.76.
The estimated TFR for non-UK born women in 2014 was higher at 2.10 children, but was down from 2.13 in 2013. This is the lowest non-UK born TFR recorded since 2004 and follows a broadly decreasing trend. The TFR for non-UK born women has fallen despite the fact that there were more births to non-UK born women in 2014. This is because the total population of non-UK born women of a childbearing age has increased proportionally more than the number of births and so non-UK born women were having more births as a group, but fewer each on average5.
Over a quarter of births (27.0%) in 2014 were to mothers born outside the UK, a slight increase from 2013 (26.5%). The number of live births in England and Wales to UK born women decreased by 1.1% compared with 2013, while live births to non-UK born women rose by 1.4%.
Marriage or civil partnership remains the most common family setting for births in England and Wales as a whole, despite the steady fall in the percentage of births registered to married couples since the 1960s. In 2014, just over half of births occurred within marriage or civil partnership (53%).
Table 1 shows the breakdown of NS-SEC for the total female population aged 16 and over in England and Wales from the 2011 Census. The largest percentage (22%) of women aged 16 to 49 were in lower managerial, administrative and professional occupations. Table 1 can be used to provide comparisons between women who are childbearing and the total female population.
Table 1: NS-SEC by age group for the total female population aged 16 and over, 2011, England and Wales
| Age | 16-49 | 50+ | ||
| NS-SEC | Number | Percentage | Number | Percentage |
| 1. Higher managerial, administrative and professional occupations | 1,048,599 | 472,760 | ||
| 1.1 Large employers and higher managerial and administrative occupations | 222,153 | 1.7 | 135,528 | 1.3 |
| 1.2 Higher professional occupations | 826,446 | 6.3 | 337,232 | 3.3 |
| 2. Lower managerial, administrative and professional occupations | 2,904,964 | 22.2 | 2,170,106 | 21.1 |
| 3. Intermediate occupations | 2,240,748 | 17.1 | 2,197,972 | 21.4 |
| 4. Small employers and own-account workers | 599,149 | 4.6 | 687,296 | 6.7 |
| 5. Lower supervisory and technical occupations | 484,774 | 3.7 | 469,291 | 4.6 |
| 6. Semi-routine occupations | 1,994,066 | 15.3 | 2,157,742 | 21 |
| 7. Routine occupations | 977,066 | 7.5 | 1,401,923 | 13.6 |
| 8. Never worked and long-term unemployed | 970,737 | 7.4 | 688,630 | 6.7 |
| L15 Full-time students | 1,849,276 | 14.1 | 25,667 | 0.2 |
| Total | 13,069,379 | 10,271,387 | ||
| Source: 2011 Census data, Table: DC6114EW, Office for National Statistics | ||||
Download this table Table 1: NS-SEC by age group for the total female population aged 16 and over, 2011, England and Wales
.xls (27.6 kB)Notes:
The standardised average (mean) age of mother is used in order to eliminate the impact of any changes in the distribution of the population by age and this enables trends over time to be analysed. Standardised means are calculated using rates per 1,000 female population by single year of age of mother.
This figure as well as all other figures in this introduction section are available on our website.
Births by parents characteristics in England and Wales, 2014.
The total fertility rate (TFR) is the average number of live children that a group of women would each bear if they experienced the age-specific fertility rates of the calendar year in question throughout their childbearing lifespan.
5. Births by socio-economic status and age of mothers
Table 2 shows the number of births in England and Wales by age group and full (8-class) NS-SEC of the mother for 2014.
Detailed NS-SEC occupations reveal that, for all births in 2014 in England and Wales, 8% of babies were born to mothers who had a higher managerial and professional occupation. This compared with 22% of births to mothers with lower managerial and professional occupations. A further 14% of births were to mothers in intermediate occupations and 12% were to mothers in semi-routine occupations. A larger percentage (33%) of births were to mothers who had an unclassified NS-SEC1.
Table 2: Births by age group of mother by NS-SEC, 2014, England and Wales
| NS-SEC | 15-19 | 20-24 | 25-29 | 30-34 | 35-39 | 40 and over | All | ||||||||||||||
| Number | % | Number | % | Number | % | Number | % | Number | % | Number | % | Number | % | ||||||||
| 1.1 | 0 | 0% | 120 | 0% | 1,168 | 1% | 4,147 | 2% | 3,037 | 3% | 757 | 3% | 9,228 | 1% | |||||||
| 1.2 | 30 | 0% | 559 | 0% | 7,610 | 4% | 23,043 | 11% | 15,456 | 13% | 3,333 | 11% | 50,030 | 7% | |||||||
| 2 | 357 | 1% | 8,182 | 7% | 37,782 | 19% | 60,896 | 28% | 34,670 | 30% | 8,742 | 30% | 150,629 | 22% | |||||||
| 3 | 1,278 | 5% | 13,210 | 12% | 29,895 | 15% | 31,196 | 14% | 15,165 | 13% | 3,344 | 12% | 94,088 | 14% | |||||||
| 4 | 208 | 1% | 1,966 | 2% | 6,709 | 3% | 8,675 | 4% | 5,132 | 4% | 1,769 | 6% | 24,459 | 4% | |||||||
| 5 | 277 | 1% | 2,983 | 3% | 6,254 | 3% | 4,980 | 2% | 2,185 | 2% | 685 | 2% | 17,365 | 2% | |||||||
| 6 | 3,042 | 12% | 22,210 | 20% | 27,966 | 14% | 19,720 | 9% | 9,081 | 8% | 2,382 | 8% | 84,400 | 12% | |||||||
| 7 | 1,437 | 6% | 8,451 | 8% | 10,786 | 5% | 7,781 | 4% | 3,288 | 3% | 1,002 | 3% | 32,745 | 5% | |||||||
| 8 | 0 | 0% | 0 | 0% | 10 | 0% | 0 | 0% | 0 | 0% | 0 | 0% | 10 | 0% | |||||||
| Unclassified | 19,342 | 74% | 54,906 | 49% | 68,588 | 35% | 55,153 | 26% | 27,113 | 24% | 6,984 | 24% | 232,085 | 33% | |||||||
| All | 25,971 | 112,586 | 196,768 | 215,591 | 115,126 | 28,998 | 695,040 | ||||||||||||||
| Source: Office for National Statistics | |||||||||||||||||||||
| Notes: | |||||||||||||||||||||
| 1. Some births occur to mothers aged under 15. These births have been grouped with 15 year olds for this analysis. | |||||||||||||||||||||
| 1.1. Large employers and higher managerial and administrative occupations | |||||||||||||||||||||
| 1.2. Higher professional occupations | |||||||||||||||||||||
| 2. Lower managerial, administrative and professional occupations | |||||||||||||||||||||
| 3. Intermediate occupations | |||||||||||||||||||||
| 4. Small employers and own-account workers | |||||||||||||||||||||
| 5. Lower supervisory and technical occupations | |||||||||||||||||||||
| 6. Semi-routine occupations | |||||||||||||||||||||
| 7. Routine occupations | |||||||||||||||||||||
| 8. Never worked and long-term unemployed | |||||||||||||||||||||
Download this table Table 2: Births by age group of mother by NS-SEC, 2014, England and Wales
.xls (32.3 kB)In 2014, ignoring births to mothers who have an unclassified NS-SEC, the largest number of births to women under the age of 30 were to women in semi-routine occupations (16%), this was followed by women in lower managerial and professional occupations (14%). Only 3% of births to women under the age of 30 were in higher managerial and professional occupations (classifications 1.1 and 1.2).
A larger proportion (74%) of births to mothers aged 15 to 19 had an unclassified NS-SEC, this is because they are more likely to be students or not have an occupation. The percentage of births that are unclassified reduces as the age of the mother increases.
Semi-routine occupations account for 20% of births to 20 to 24 year olds, this reduces to 8% for mothers aged 40 and over in 2014. For 25 to 29 year olds the largest percentage of mothers were in lower managerial and professional occupations (19%) closely followed by mothers in intermediate occupations (15%).
In 2014, for women giving birth aged 30 and over, the largest number were in the lower managerial and professional occupations (29%). Intermediate occupations were the next highest group at 14% of births to women aged 30 and over. Higher managerial and professional occupations (classifications 1.1 and 1.2) represented a further 14% of births to women aged 30 and over.
Women aged 30 and over were more likely to be in managerial and professional occupational groups than women aged under 30. In 2014, around 16% of births to mothers aged 35 to 39 and 14% of births to mothers aged 40 and over were in the higher managerial and professional occupations; this compared with only 5% of mothers aged 25 to 29 in 2014.
Notes:
- A woman may have an unclassified NS-SEC at birth registration due to; a misunderstanding of the question which means occupations are not stated or inadequately described and students and occupations not classifiable for other reasons are also categorised as ‘Unclassified’.
6. Births by socio-economic status and age of mothers for UK and non-UK born women
From this section onwards, this analysis refers to the 3-class version of NS-SEC which includes the categories: higher managerial, administrative and professional occupations, intermediate occupations, routine and manual occupations and unclassified. This is described in full in the data sources and methodology section.
There is variation in the socio-economic context of births according to the country in which the mother was born.
In 2014, there were 507,587 live births to UK born mothers compared with 187,610 births to non-UK born mothers1.
In 2014, a third (33%) of all births to UK born women were to mothers in managerial and professional occupations, compared with 23% of all births to non-UK born mothers. Higher occupational groups were more common amongst the over 30s for UK-born and over 35s for non-UK born women. Nearly half (45%) of non-UK born women giving birth in 2014 had their occupational group recorded as unclassified and this proportion was highest for women under the age of 30.
Around a fifth of births to both UK-born and non-UK born women were in routine and manual occupations. A further fifth (19%) of births to UK born women who were in intermediate occupations, compared with 12% of births to non-UK born women.
Figure 1: Percentage of live births to UK and non-UK born mothers, by age group and by NS-SEC, 2014
England and Wales
Source: Office for National Statistics
Download this chart Figure 1: Percentage of live births to UK and non-UK born mothers, by age group and by NS-SEC, 2014
Image .csv .xlsIn 2014, 82% of births to non-UK born mothers and 74% of births to UK-born mothers aged 15 to 19 had an unclassified NS-SEC.
Managerial and professional occupations represented the largest percentage of births for UK born mothers aged 30 to 34, 35 to 39 and 40 and over. In 2014, around 51% of births to UK born mothers aged 35 to 39 were in managerial and professional occupations, this compares with 37% of births to non-UK born mothers of the same age group.
While the patterns in NS-SEC by age group were similar for both UK born mothers and non-UK born mothers in 2014, the non-UK born mothers have a higher percentage of births in the unclassified category in every age group compared with UK born mothers.
Notes:
Nôl i'r tabl cynnwys7. Socio-economic status and average age of mother for UK and non-UK born women
Table 3 shows that the unstandardised mean age1 of all UK born mothers, combining all NS-SEC categories, was 29.7 years in 2014. UK born mothers employed in routine and manual occupations as well as UK born mothers who had an unclassified occupation had a mean age at birth of under 30 years, while UK born mothers employed in managerial and professional occupations and intermediate occupations had a mean age of over 30 years.
In contrast, the mean age of mothers born outside the UK, combining all NS-SEC categories, was above 30 years (31.3 years). Non-UK born mothers employed in each NS-SEC category also had a mean age above 30 years.
Table 3: Unstandardised mean age of mother by NS-SEC and country of birth of mother, 2014, England and Wales
| UK born | Non-UK born | |
| Managerial and professional occupations | 32.6 | 33.7 |
| Intermediate occupations | 30.5 | 32.3 |
| Routine and manual occupations | 27.9 | 30.7 |
| Unclassified | 27.3 | 30.1 |
| ALL | 29.7 | 31.3 |
| Source: Office for National Statistics | ||
Download this table Table 3: Unstandardised mean age of mother by NS-SEC and country of birth of mother, 2014, England and Wales
.xls (25.6 kB)Notes:
- Unstandardised Mean Age is subject to changes in the structure of the population by age and therefore should only be used when requiring a mean for a particular year.
8. Socio-economic status of mother and birth order
In 2014, first births were the most common birth order for births in England and Wales accounting for 38% of all live births. First births also represented the highest proportion of all births for each NS-SEC category, with 47% of mothers in managerial and professional occupations, 43% of mothers in intermediate occupations and 43% of mothers in routine and manual occupations, registering a first birth.
Looking at UK born mothers (Figure 2), the largest proportion of first or second births were to those in managerial and professional occupations. Overall, the proportion of first births, second births and third births to mothers in intermediate occupations and routine and manual occupations were almost equal. The largest proportion of third births or fourth and subsequent births is to mothers in unclassified occupations.
Figure 2: UK born mothers, percentage of live births by birth order and by NS-SEC, 2014
England and Wales
Source: Office for National Statistics
Download this chart Figure 2: UK born mothers, percentage of live births by birth order and by NS-SEC, 2014
Image .csv .xlsFigure 3 shows that within each birth order, the greatest proportion of non-UK born women had their occupation recorded as "unclassified" in 2014. For those non-UK born women who did have an occupation classified, the largest proportion of first births or second births were to women in managerial and professional occupations.
Third births or fourth and subsequent births to non-UK born mothers were most likely to be to women in routine and manual occupations or with an unclassified occupation.
Figure 3: Non-UK born mothers, percentage of live births by birth order and NS-SEC, 2014
England and Wales
Source: Office for National Statistics
Download this chart Figure 3: Non-UK born mothers, percentage of live births by birth order and NS-SEC, 2014
Image .csv .xls9. Birth order, socio-economic status and mother’s age
Birth order is the number assigned to a birth based on the mother’s number of previous live births.
Table 4: Percentage of live births by mother’s age, for 1st and 2nd births by NS-SEC, England and Wales, 2014
| First births | Second births | |||||||
| Managerial and professional occupations | Intermediate occupations | Routine and manual occupations | Unclassified | Managerial and professional occupations | Intermediate occupations | Routine and manual occupations | Unclassified | |
| 15-19 | 0% | 2% | 7% | 25% | 0% | 0% | 2% | 6% |
| 20-24 | 6% | 20% | 36% | 34% | 3% | 9% | 22% | 29% |
| 25-29 | 28% | 35% | 32% | 24% | 19% | 31% | 37% | 31% |
| 30-34 | 42% | 28% | 18% | 12% | 43% | 37% | 27% | 23% |
| 35-39 | 19% | 12% | 6% | 4% | 29% | 19% | 10% | 9% |
| 40+ | 4% | 3% | 2% | 1% | 6% | 4% | 2% | 2% |
| Total | 100% | 100% | 100% | 100% | 100% | 100% | 100% | 100% |
| Source: Office for National Statistics | ||||||||
Download this table Table 4: Percentage of live births by mother’s age, for 1st and 2nd births by NS-SEC, England and Wales, 2014
.xls (18.4 kB)
Table 5: Percentage of live births by mother’s age, for 3rd and 4th and higher births by NS-SEC, England and Wales, 2014
| Third births | Fourth and higher order births | |||||||
| Managerial and professional occupations | Intermediate occupations | Routine and manual occupations | Unclassified | Managerial and professional occupations | Intermediate occupations | Routine and manual occupations | Unclassified | |
| 15-19 | 0% | 0% | 0% | 1% | 0% | 0% | 0% | 0% |
| 20-24 | 1% | 5% | 10% | 18% | 0% | 2% | 3% | 6% |
| 25-29 | 14% | 26% | 32% | 35% | 11% | 15% | 24% | 27% |
| 30-34 | 40% | 38% | 33% | 29% | 32% | 38% | 34% | 36% |
| 35-39 | 36% | 24% | 20% | 13% | 40% | 32% | 29% | 23% |
| 40+ | 10% | 6% | 5% | 3% | 17% | 12% | 11% | 7% |
| Total | 100% | 100% | 100% | 100% | 100% | 100% | 100% | 100% |
| Source: Office for National Statistics | ||||||||
Download this table Table 5: Percentage of live births by mother’s age, for 3rd and 4th and higher births by NS-SEC, England and Wales, 2014
.xls (19.5 kB)Table 4 and 5 show that for all birth orders, those in higher occupational groups were more likely to be over the age of 30. Relatively few women having their first birth over the age of 30 have their occupation recorded as unclassified. As the birth order increases it becomes more likely for the mother’s occupation to be recorded as unclassified.
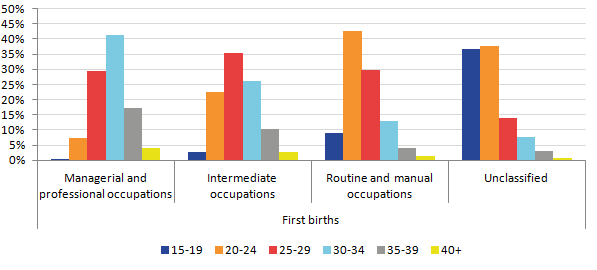
Figure 4: Percentage of first births to UK born mothers by mother’s NS-SEC and age, 2014
England and Wales
Source: Office for National Statistics
Download this image Figure 4: Percentage of first births to UK born mothers by mother’s NS-SEC and age, 2014
.png (10.2 kB) .xls (27.6 kB)
Looking at UK born women having their first birth in 2014 (Figure 4), the age of mother increases as NS-SEC increases.
UK born mothers having their first birth who were in intermediate occupations were most likely to be aged 25 to 29 and UK born mothers in routine and manual occupations were most likely to be aged 20 to 24. Mothers who were in unclassified occupations and having their first birth were most likely to be under 25, but just over a third of them (37%) were aged 15 to 19. UK born mothers having their first birth who were in managerial and professional occupations were most likely to be aged 30 to 34.
Figure 5: Percentage of first births to non-UK born mothers by mother’s NS-SEC and age,2014
England and Wales

Source: Office for National Statistics
Download this image Figure 5: Percentage of first births to non-UK born mothers by mother’s NS-SEC and age,2014
.png (10.6 kB) .xls (27.6 kB)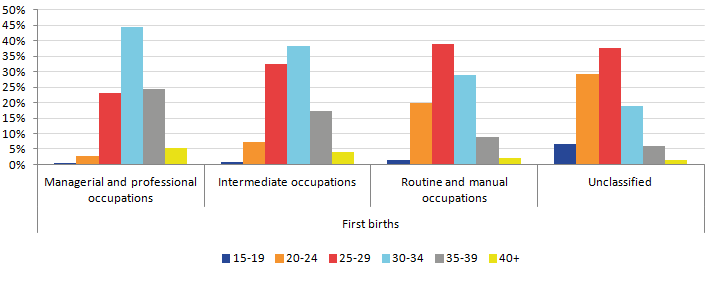
Similarly to UK born mothers, the higher the NS-SEC of non-UK born mothers having their first birth in 2014, the more likely they were to be aged 30 and over.
Unlike UK born women, non-UK born women in intermediate occupations having their first birth were also more likely to be older, with the most common age being 30 to 34. Non-UK born mothers in routine and manual occupations were most likely to be aged 25 to 29, again slightly older than the equivalent UK born mothers. For mothers who were in unclassified occupations and having their first birth, they were most likely to be 25 to 29, with a smaller proportion of births being registered for mothers in the youngest age group (15 to 19) when you compare with UK born mothers. Non- UK born mothers having their first birth who were in managerial and professional occupations were most likely to be aged 30 to 34 which was the same as for UK born mothers.
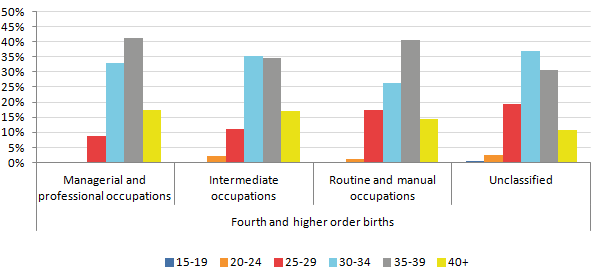
For each NS-SEC, UK-born women having their fourth or higher birth tend to be over the age of 30, with women in managerial and professional occupations most likely to be 35 to 39 (Figure 6).
Figure 6: Percentage of fourth and higher births to UK born mothers by mother’s NS-SEC and age, 2014
England and Wales
Source: Office for National Statistics
Download this image Figure 6: Percentage of fourth and higher births to UK born mothers by mother’s NS-SEC and age, 2014
.png (11.1 kB) .xls (28.2 kB)
Overall, UK born women who were having their fourth and subsequent birth in any NS-SEC group were most likely to be aged 30 to 34, except for the managerial and professional group where they were most likely to be aged 35 to 39. Fourth or higher order births to women aged 40 and over represent a much larger share of births in all NS-SEC groups compared with women having their first birth at age 40 and over.
As for UK born women, fourth and subsequent births to non-UK born women in each NS-SEC were also most likely to be to older mothers aged 30 and over (Figure 7).
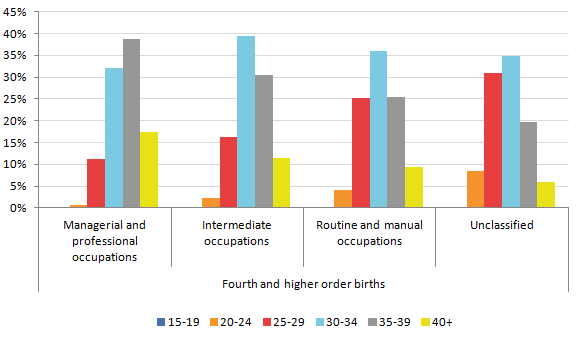
Figure 7: Percentage of fourth and higher births to non-UK born mothers by mother’s NS-SEC and age, 2014
England and Wales
Source: Office for National Statistics
Download this image Figure 7: Percentage of fourth and higher births to non-UK born mothers by mother’s NS-SEC and age, 2014
.png (10.6 kB) .xls (28.2 kB)
Non-UK born women in managerial and professional occupations who were having their fourth and subsequent birth were most likely to be aged 35 to 39. This is also true for those in routine and manual occupations.
Non-UK born women who were in unclassified or intermediate occupations were most likely to be aged 30 to 34. Those mothers in intermediate occupations who were aged 40 and over represent a much larger share of the births compared with the proportion for UK born women.
Nôl i'r tabl cynnwys11. Quality and methodology
The Births Quality and Methodology Information document contains important information on:
- the strengths and limitations of the data
- the quality of the output: including the accuracy of the data and how it compares with related data
- uses and users
- how the output was created
Registration of a birth is legally required within 42 days of its occurrence. High quality data on numbers of births by, for example mother’s age and mother’s country of birth, are available from this compulsory birth registration.
Information about the father’s and mother’s occupation (based on current or most recent employment) and employment status is provided by the informant at birth registration. Occupation is coded for only a sample of 1 in 10 (10%) births and is combined with employment status to derive the National Statistics Socio-economic Classification (NS-SEC)1 of the father and mother. Compared with fathers’ NS-SEC, a higher proportion of mothers’ NS-SEC are coded as “unclassified”.
The mother’s NS-SEC data from the birth registrations has been weighted up from the 10% sample to agree with known totals derived from the 100% processing of birth registrations by mother’s age, country of birth and number of previous live-born children. For each age group, an apportionment method is used to assign un-coded births (where mother’s NS-SEC is unknown) to coded births (where mother’s NS-SEC is known). This ensures consistency with sub-totals.
The estimates of birth by NS-SEC will be subject to sampling error, for more information on this please see the User guide to births statistics.
This report uses the 8-class version of the National Statistics Socio-economic Classification (NS-SEC). From Section 6 onwards the categories are collapsed into broader categories using the 3-class NS-SEC as follows:
Higher managerial, administrative and professional occupations
Higher managerial, administrative and professional occupations (for example, doctors, lawyers and architects).
Large employers and higher managerial and administrative occupations.
Higher professional occupations.
Lower managerial, administrative and professional occupations (for example,. nurses, teachers, journalists).
Intermediate occupations
Intermediate occupations (for example,. armed forces – sergeant and below, paramedics, bank staff).
Small employers and own-account workers (for example, farmers, shopkeepers, driving instructors).
Routine and manual occupations
Lower supervisory and technical occupations (for example, electricians, plumbers, chefs).
Semi-routine occupations (for example, receptionists, telephone salespersons, care workers).
Routine occupations (for example, labourers, bar staff, lorry drivers).
Never worked and long-term unemployed.
Unclassified