1. Introduction
This technical appendix provides the detail around the data and methods used in the following publications: -
- Coronavirus (COVID-19) related deaths by ethnic group, England and Wales: 2 March 2020 to 15 May 2020
- Coronavirus (COVID-19) related deaths by religious group, England and Wales: 2 March to 15 May 2020
- Coronavirus (COVID-19) related deaths by disability status, England and Wales: 2 March to 15 May 2020
From 16 October 2020 the methodology around related deaths by ethnic group has been updated to incorporate new data. The updated methodology has been published alongside Explaining ethnic contrasts in deaths involving the coronavirus (COVID-19), England and Wales: deaths occurring 2 March to 28 July 2020.
Nôl i'r tabl cynnwys2. Data
These analyses are based on a unique linked dataset that encompasses Census 2011 records and death registrations with England and Wales coverage. It was created by first linking the 2011 Census to NHS Patient Register (PR) records between 2011 and 2013 where NHS number was added to those census records identified in the Patient Register. Second, by using NHS number and a deterministic match key linkage method where NHS number was unavailable, death registrations were linked to 2011 Census records up to 29 May 2020.
The linked population has a very similar distribution across a range of characteristics as the full census population, and so can be considered representative of the general population of England and Wales in 2011. Examination of linkage rates for ethnic and religious groups showed distributions at 2011 Census and the linked population were relatively consistent across all categories, although there was more significant variation in unlinked records. For all ethnic groups, linkage rates of NHS number exceeded 80% in all cases.
The study population included all usual residents coded to an ethnic group in 2011 and not known to have died before 2 March 2020 (number surveyed (N) equals 48,422,583). Those enumerated in 2011 answering the “Intention to Stay” question, because they had entered the UK in the year before the 2011 Census took place, were excluded from the analyses because of their high propensity to have left the UK before the analysis period under investigation. However, this leaves uncertainty in the extent of emigration of usual residents between 27 March 2011 and 2 March 2020, which is dealt with later in this section.
We use data from the NHS Patient Register and the International Passenger Survey (IPS) to estimate emigration between March 2011 and March 2020 by broad age group and ethnicity. As we only have IPS data up to year ending March 2019, we assume emigration rates observed between March 2019 and March 2020 are the same as those observed in the previous year.
These emigrations and deaths are used to ensure that this analysis refers to people still in the population of England and Wales and at risk of the coronavirus (COVID-19) from 2 March 2020 by applying out migration adjustment factors to deplete the population sizes resulting from expected out migration since the 2011 Census.
The number of deaths occurring between 2 March 2020 and 15 May 2020 that were registered by 29 May 2020 amounted to 154,759. Of these, 140,585 were successfully linked to the 2011 Census record (90.84%). However, only 140,550 were usable because 33 were linked to non-usual residents and 2 to individuals over 110 years of age, which we excluded from our study population.
Deaths were defined using the International Classification of Diseases, 10th Revision (ICD-10). Deaths involving COVID-19 include those with an underlying cause, or any mention, of ICD-10 codes U07.1 (COVID-19, virus identified) or U07.2 (COVID-19, virus not identified).
The study population is not currently refreshed with new births or immigrations. Therefore, some deaths will have occurred to immigrants entering since 2011; deaths involving COVID-19 to those born since the 2011 Census and resident in England and Wales will be very small as they will be 9 years old or younger.
For the modelling analysis, we restrict the analysis to those who lived in private households at the time of the 2011 Census. In further work we plan to model the risk of death involving COVID19 separately for those living in communal establishments and in private households. However, we have no information on the type of residence in which people currently live. We are investigating options to obtain this information.
Nôl i'r tabl cynnwys3. Age-standardisation method
This Microsoft Excel template demonstrates how age-standardised rates and 95% confidence intervals are calculated.
Age-standardised rates are calculated as follows:
where:
- i is the age group
- wi is the number, or proportion, of individuals in the standard population in age group i
- ri is the observed age-specific rate in the subject population in age group i, given by:
where:
- di is the observed number of deaths in the subject population in age group i
- ni is the population at risk in age-group i
The age-standardised rate is a weighted sum of age-specific death rates where the age-specific weights represent the relative age distribution of the standard population (in this case the 2013 European Standard Population (ESP)). The variance is the sum of the age-specific variances and its standard error is the square root of the variance:
ri is the crude age-specific rate in the local population in age group i
di is the number of deaths in the local population in age group i
Confidence intervals
The mortality data in this release are not subject to sampling variation as they were not drawn from a sample. Nevertheless, they may be affected by random variation, particularly where the number of deaths or probability of dying is small. To help assess the variability in the rates, they have been presented alongside 95% confidence intervals.
The choice of the method used in calculating confidence intervals for rates will, in part, depend on the assumptions made about the distribution of the deaths data these rates are based on. Traditionally, a normal approximation method has been used to calculate confidence intervals on the assumption that deaths are normally distributed. However, if the number of deaths is relatively small (fewer than 100), it may be assumed to follow a Poisson probability distribution. In such cases, it is more appropriate to use the confidence limit factors from a Poisson distribution table to calculate the confidence intervals instead of a normal approximation method.
The method used in calculating confidence intervals for rates based on fewer than 100 deaths was proposed by Dobson and others (1991) as described in APHO (2008). In this method, confidence intervals are obtained by scaling and shifting (weighting) the exact interval for the Poisson distributed counts (number of deaths in each year). The weight used is the ratio of the standard error of the age-standardised rate to the standard error of the number of deaths.
The lower and upper 95% confidence intervals are denoted as ASR lower and ASR upper, respectively, and calculated as:
where:
Dland Du are the exact lower and upper confidence limits for the number of deaths, calculated using confidence limit factors from a Poisson probability distribution table
D is the number of deaths in each year
v(ASR) is the variance of the age-standardised rate
v(D) is the variance of the number of deaths
Where there are 100 or more deaths in a year, the 95% confidence intervals for age-standardised rates are calculated using the normal approximation method:
ASRLL/UL = ASR± 1.96*SE
where:
ASRLL/U represents the upper and lower 95% confidence limits, respectively, for the age-standardised rate and SE is the standard error.
Nôl i'r tabl cynnwys4. Modelling analysis - method
We use Cox proportional hazard models to assess how the risk of dying from the coronavirus (COVID-19) varies among groups for exposure variables of interest (ethnicity, religion, and disability status) once we adjust for a range of geographical, demographic, socio-economic, household and occupational exposure factors. All individual characteristics are retrieved from the 2011 Census and therefore may not appropriately reflect individual circumstances at the time of the pandemic.
We model the hazard of dying of COVID-19 between 2 March 2020 and 15 May 2020. In our analytical dataset, we include all those who died from COVID-19 in this period and a weighted 1% random sample of those who did not. The regression estimates are further weighted using the probability not to have migrated between 2011 and 2020.
We estimate separate models for males and females, as the risk of death involving COVID19 differs markedly across sex. We present results from several models, adding different control variables step by step. This allows us to see how the differences across ethnic groups varies as we include further explanatory variables.
All our models are adjusted for age. We include age as a second-order polynomial to account for the non-linear relationship between age and the hazard of death involving COVID19.
We then adjust for geographical factors. The probability to be infected by COVID-19 is likely to vary by region of residence. Therefore, we include a binary indicator for each region. We also adjust for population density for the Lower Super Output Area (LSOA) of residence at the time of the 2011 Census. To account for the non-linear relationship between population density and the hazard of death involving COVID19 we include population density as a second-order polynomial, allowing for different slopes for the top 1% of the population density distribution to account for outliers.
We then account for deprivation and wider measures of socio-economic status. We adjust for neighbourhood deprivation by adding decile of the Index of Multiple Deprivation (IMD) 2015 and Welsh Index of Multiple Deprivation (WIMD) 2014 of the LSOA of the residence at the time of the census in our model. The IMD and WIMD are overall measures of deprivation based on factors such as income, employment and health.
We also adjust for the level of household deprivation, a summary measure of disadvantage based on four selected household characteristics (employment, education, health and housing). We include in our model the level of highest qualification (degree, A-level or equivalent, GCSE or equivalent, no qualification) of the individual and the National Statistics Socio-economic Classification (NS-SEC) of the household head (higher managerial, administrative and professional occupations, intermediate occupations, routine and manual occupations, never worked, not applicable).
We further adjust for household composition and circumstances. We include in our models the number of people in the household, the family type (not a family, couple with children, lone parent), and binary variables for living in a multigenerational household (defined as three generations living together) or with any children (aged 18 years or less). We also adjust for the tenure of the household (owned outright, owned with mortgage, social rented, private rented, other).
In addition, we adjust for some measures of health from the 2011 Census. We include in the model self-reported health (very good, good, fair, poor, very poor) and whether the individual suffers from any disability (not disabled, daily activity limited a lot, daily activity limited a little).
Finally, we adjust for a set of measures of occupational exposure. We include binary variables indicating if the individual is a key worker, and if so, what type. This data is taken from occupation as recorded on the 2011 Census. We also include a binary variable indicating if anyone in the household is a key worker. We account for exposure to diseases and contact with others using scores ranging from 0 (no exposure) to 100 (maximum exposure).
Exposure to disease and physical proximity were originally obtained using O*NET data based on US Standard Occupational Classification (SOC) codes and were mapped to UK SOC codes. See this article for more details on how these measures were derived. We include these scores for all individuals with a valid occupation and derive the maximum value amongst all household members.
To allow for the effect of all these characteristics to vary depending on the age of the individuals, we interact them all with a binary variable indicating if the individual is aged 70 years or over.
Nôl i'r tabl cynnwys5. Results from all models for ethnicity
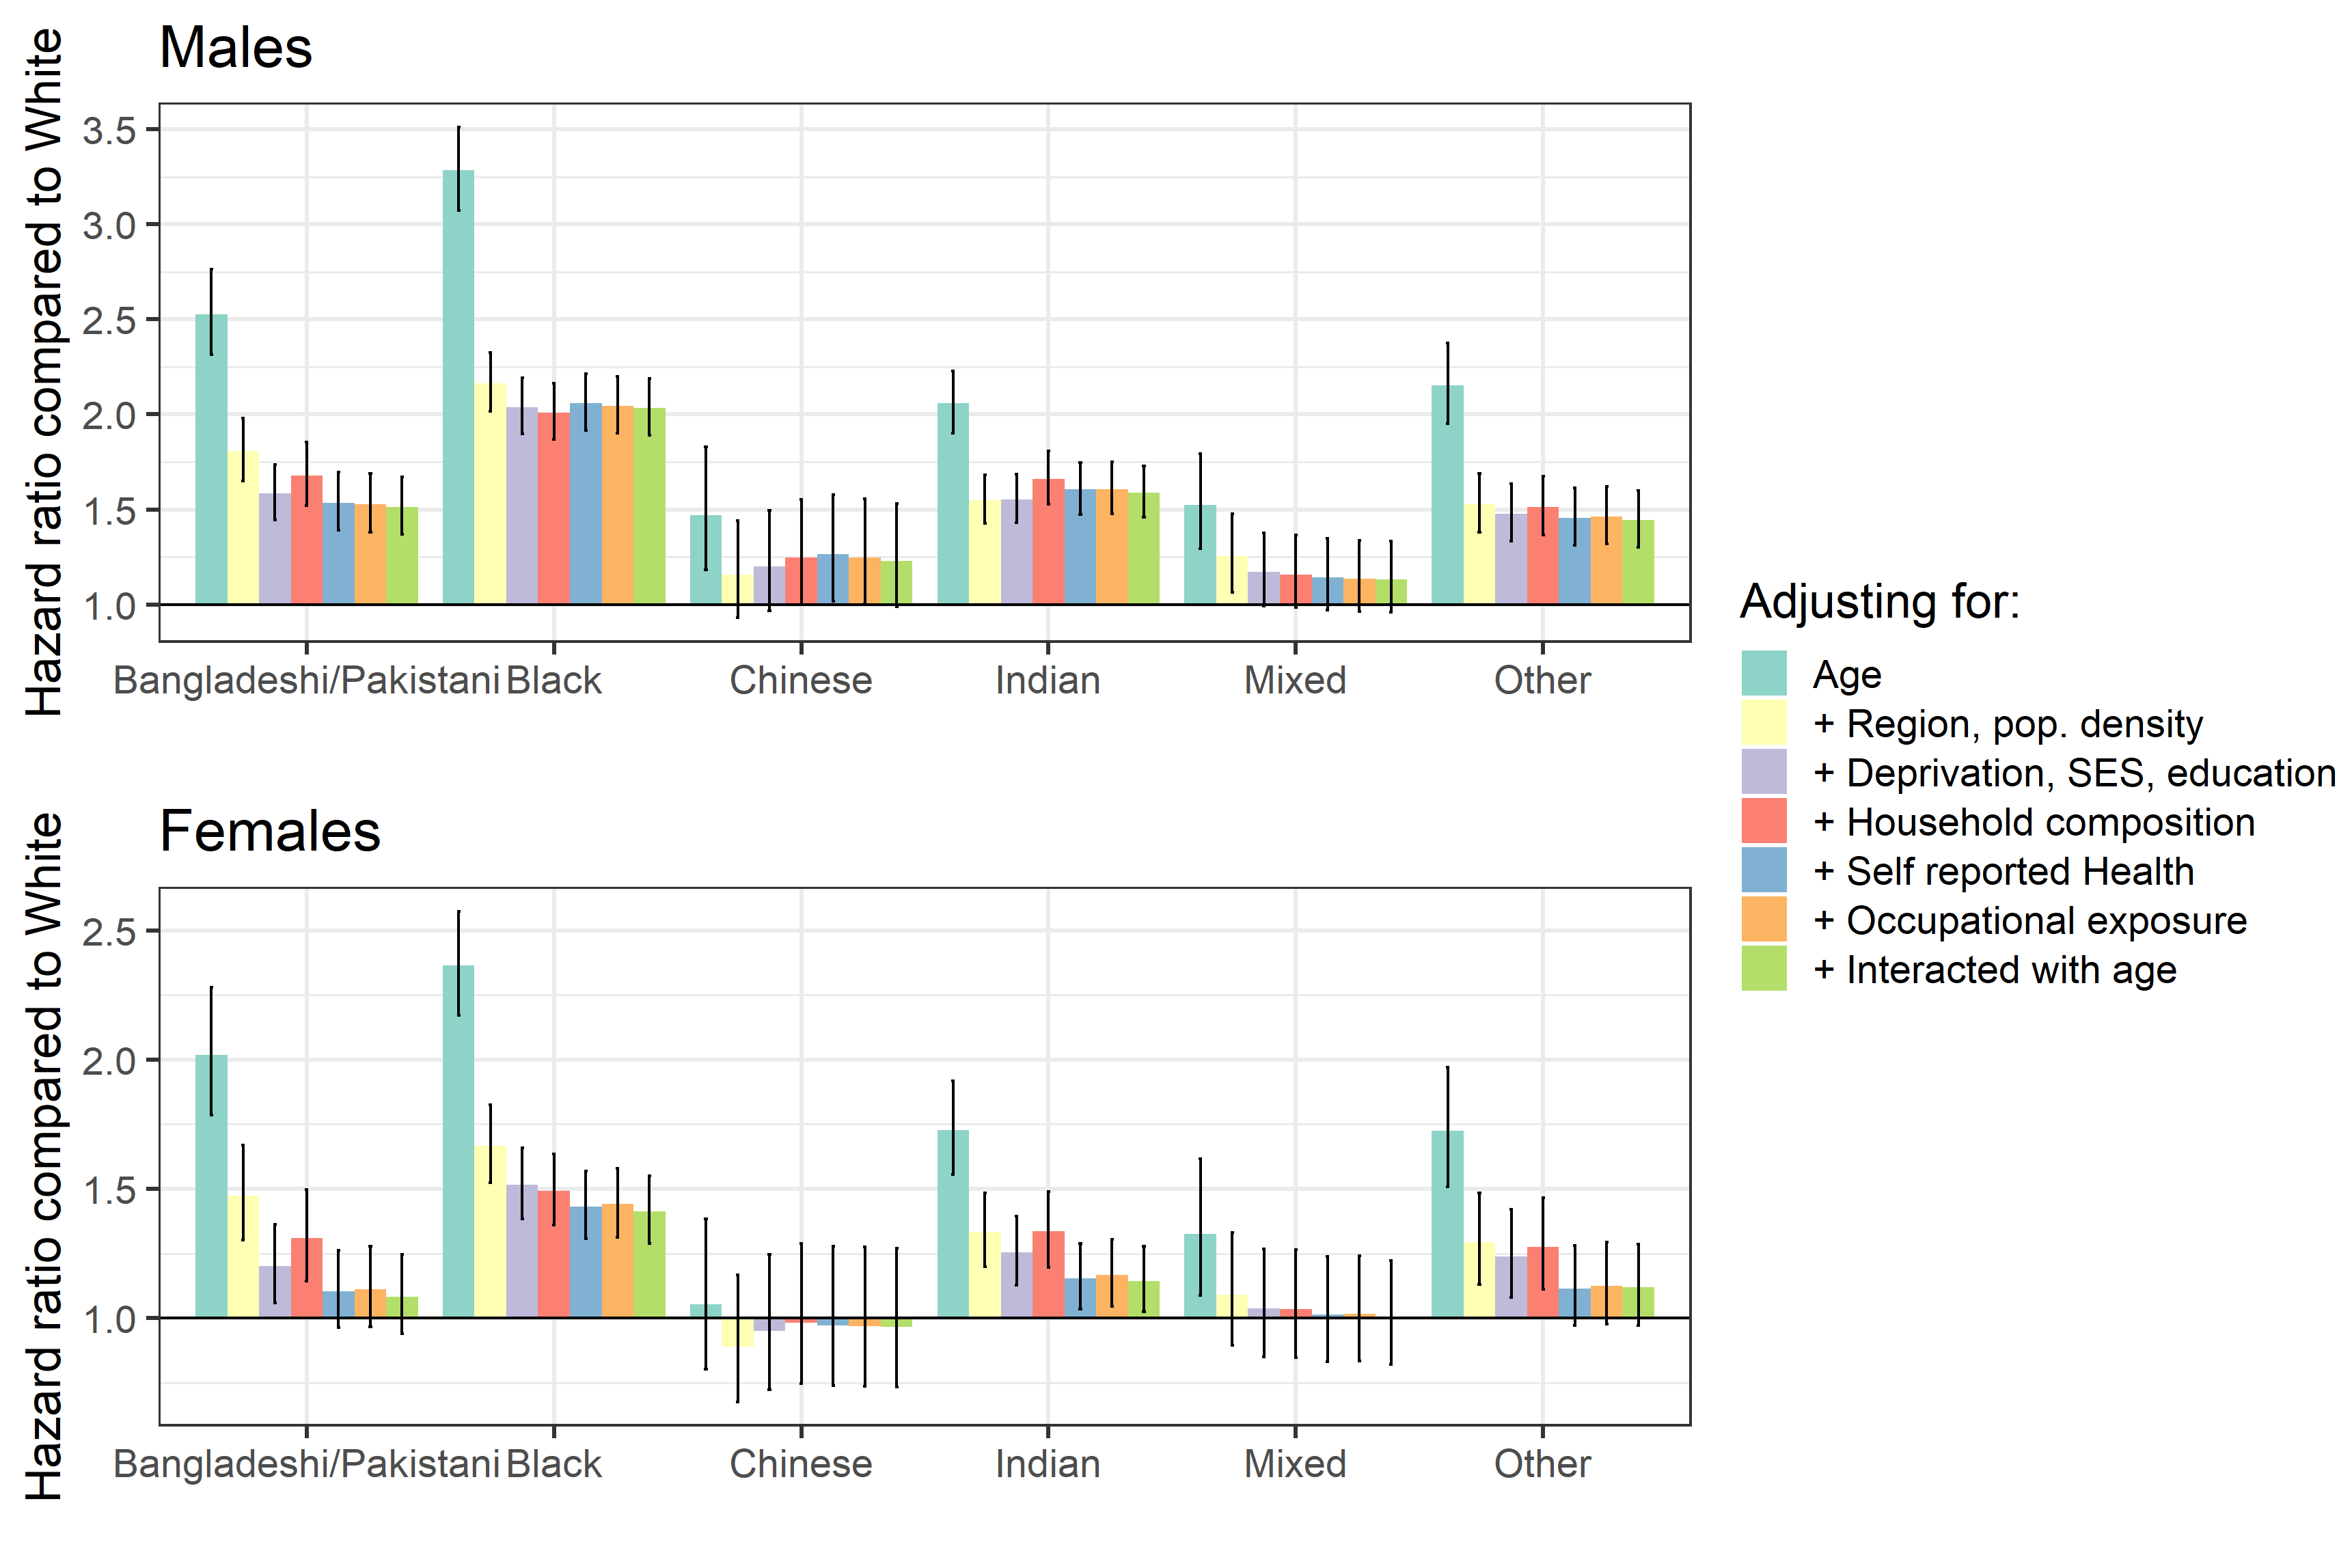
In Coronavirus (COVID-19) related deaths by ethnic group, England and Wales: 2 March 2020 to 15 May 2020 (Figure 3) we reported the hazard ratios for each minority ethnic group relative to the White population, after adjusting for age and for the full range of characteristics described previously. In Figure 1 in this section we show how the hazard ratio for each minority ethnic group varies depending on the set of household and individual characteristics we adjust for. We report the corresponding model goodness-of-fit statistics in Reference Table Model diagnostics.
We find that adjusting for region of residence and population density improves the model fit and reduces substantially the hazard ratios for all ethnic groups. The probability to be infected by the coronavirus (COVID-19) is likely to vary by region of residence and to be higher in more densely populated urban areas.
Adjusting for deprivation and socio-economic status reduces the hazard ratios for almost all ethnic groups, albeit to a relatively small extent. The change is the largest for those of Bangladeshi or Pakistani ethnicity. Adjusting for further characteristics (household composition, self-reported health and disability, and occupational exposure) improves the goodness-of-fit of our models but has little effect on the estimated hazard ratios. Interacting all the covariates with an indicator for being aged 70 years or above improves the goodness-of-fit of the model but has no effect on the estimated hazard ratios.
Figure 1: Risk of death involving COVID19 by ethnic group, different model specifications
Source: Office for National Statistics
Notes:
- Causes of death was defined using the International Classification of Diseases, 10th Revision (ICD-10) codes U07.1 and U07.2. Figures include deaths where coronavirus (COVID-19) was the underlying cause or was mentioned on the death certificate as a contributory factor. Figures do not include neonatal deaths (deaths under 28 days).
- Figures are for persons usually resident in England and Wales, based on 2011 Census enumerations, and not known to have died before 2 March 2020.
- Figures are for deaths occurring between 2 March 2020 and 15 May 2020. Figures only include deaths that were registered by 29 May 2020. More information on registration delays can be found on the ONS website:
- The lower and upper 95% confidence limits form a confidence interval, which is a measure of the statistical precision of an estimate and shows the range of uncertainty around the figure. As a general rule, if the confidence intervals around two figures do not overlap then the observed difference between the estimates is unlikely to have occurred by chance if there is actually no underlying difference between the groups.
- The reference category is to the White ethnic group.
- Model definitions: 1 Age 2 + Region, Population Density 3 + Deprivation, SES, education 4 + Household composition 5 + Self-reported health 6 + occupational exposure 7 + interacted with age
Download this image Figure 1: Risk of death involving COVID19 by ethnic group, different model specifications
.png (269.4 kB) .xlsx (21.3 kB)
6. Results from all models for religion
In Coronavirus (COVID-19) related deaths by religious group, England and Wales: 2 March to 15 May 2020 (Figure 3) we reported the hazard ratios for each religious group relative to the Christian population, after adjusting for age and for the full range of characteristics described previously. In Figure 2 in this section we show how the hazard ratio for each religion group varies depending on the set of household and individual characteristics we adjust for. We report the corresponding model goodness-of-fit statistics in Reference Table Model diagnostics.
We find that adjusting for region of residence and population density improves the model fit and reduces the hazard ratios for all religion groups. Population density has the most explanatory power for Buddhists, Sikhs, Muslims, Hindus and Jews; including population density combined with region, substantially reduces the hazard ratios. The probability to be infected by the coronavirus (COVID-19) is likely to vary by region and to be higher in more densely populated urban areas.
Adjusting for deprivation and socio-economic status alters the hazard ratios for each group, for Jews, Hindus and Buddhists the hazard ratio increases, however, for Sikhs and Muslims the Hazard ratio is reduced. Adjusting for further characteristics (household composition, self-reported health and disability, and occupational exposure) improves the goodness-of-fit of our models but has little effect on the estimated hazard ratios. Including ethnicity in the model substantially reduces the hazard ratio for each religious group except Jews, where the hazard ratio increases.
The hazard ratios for groups affiliating with No religion are relatively constant across all adjustments. Interacting all the covariates with an indicator for being aged 70 years or above improves the goodness-of-fit of the model but has little effect on the estimated hazard ratios
Figure 2: Risk of death involving COVID19 by religious group, different model specifications

Source: Office for National Statistics
Notes:
- Causes of death was defined using the International Classification of Diseases, 10th Revision (ICD-10) codes U07.1 and U07.2. Figures include deaths where coronavirus (COVID-19) was the underlying cause or was mentioned on the death certificate as a contributory factor. Figures do not include neonatal deaths (deaths under 28 days).
- Figures are for persons usually resident in England and Wales, based on 2011 Census enumerations, and not known to have died before 2 March 2020.
- Figures are for deaths occurring between 2 March 2020 and 15 May 2020. Figures only include deaths that were registered by 29 May 2020. More information on registration delays can be found on the ONS website:
- The lower and upper 95% confidence limits form a confidence interval, which is a measure of the statistical precision of an estimate and shows the range of uncertainty around the figure. As a general rule, if the confidence intervals around two figures do not overlap then the observed difference between the estimates is unlikely to have occurred by chance if there is actually no underlying difference between the groups.
- The reference category is to the White ethnic group
- Model definitions: 1 Age 2 + Region, Population Density 3 + Deprivation 4 + Household composition 5 + Self-reported health 6 + Occupational exposure 7 + Ethnicity 8 + Interactions including Ethnicity 9 + Interactions not including Ethnicity
Download this image Figure 2: Risk of death involving COVID19 by religious group, different model specifications
.png (350.7 kB) .xlsx (21.9 kB)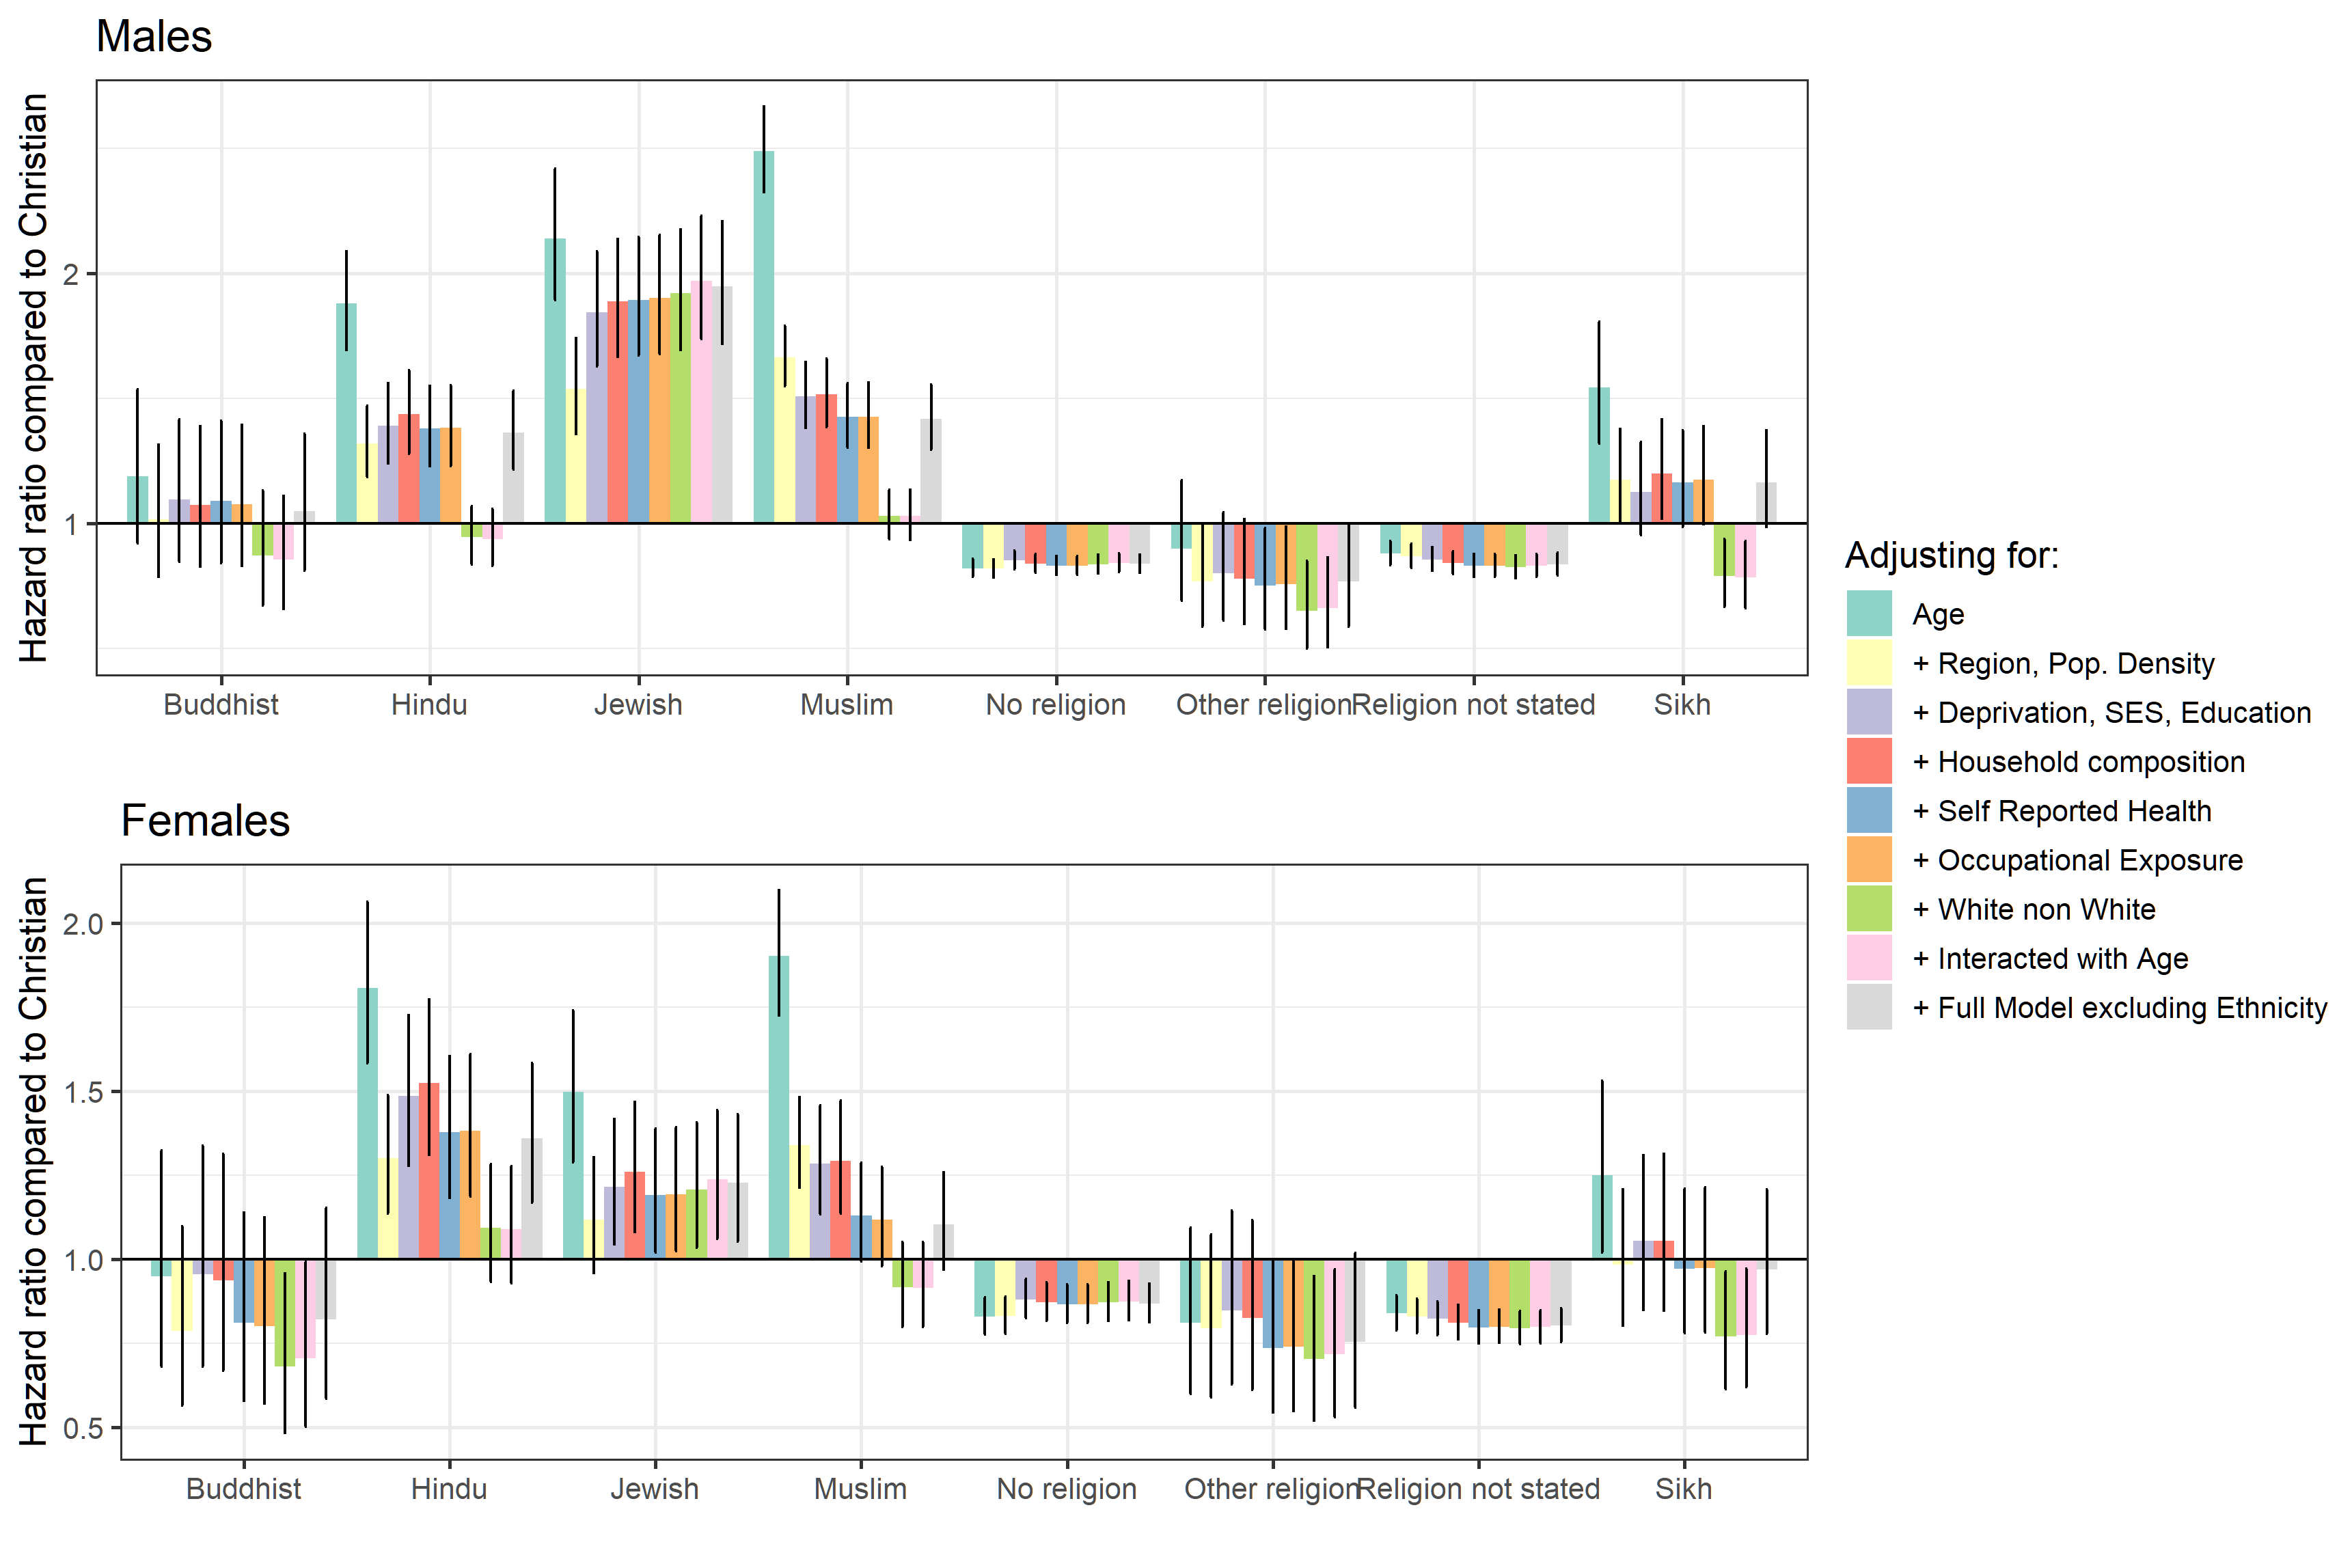
The most comprehensive source of data on religion is from the 2011 Census where individuals self-identify their religion. Links between affiliation and religious practice are an area where further work is needed. We provided information on many aspects of health and demography in our previous publication. Further data and work are required.
Nôl i'r tabl cynnwys7. Results from all models for disability
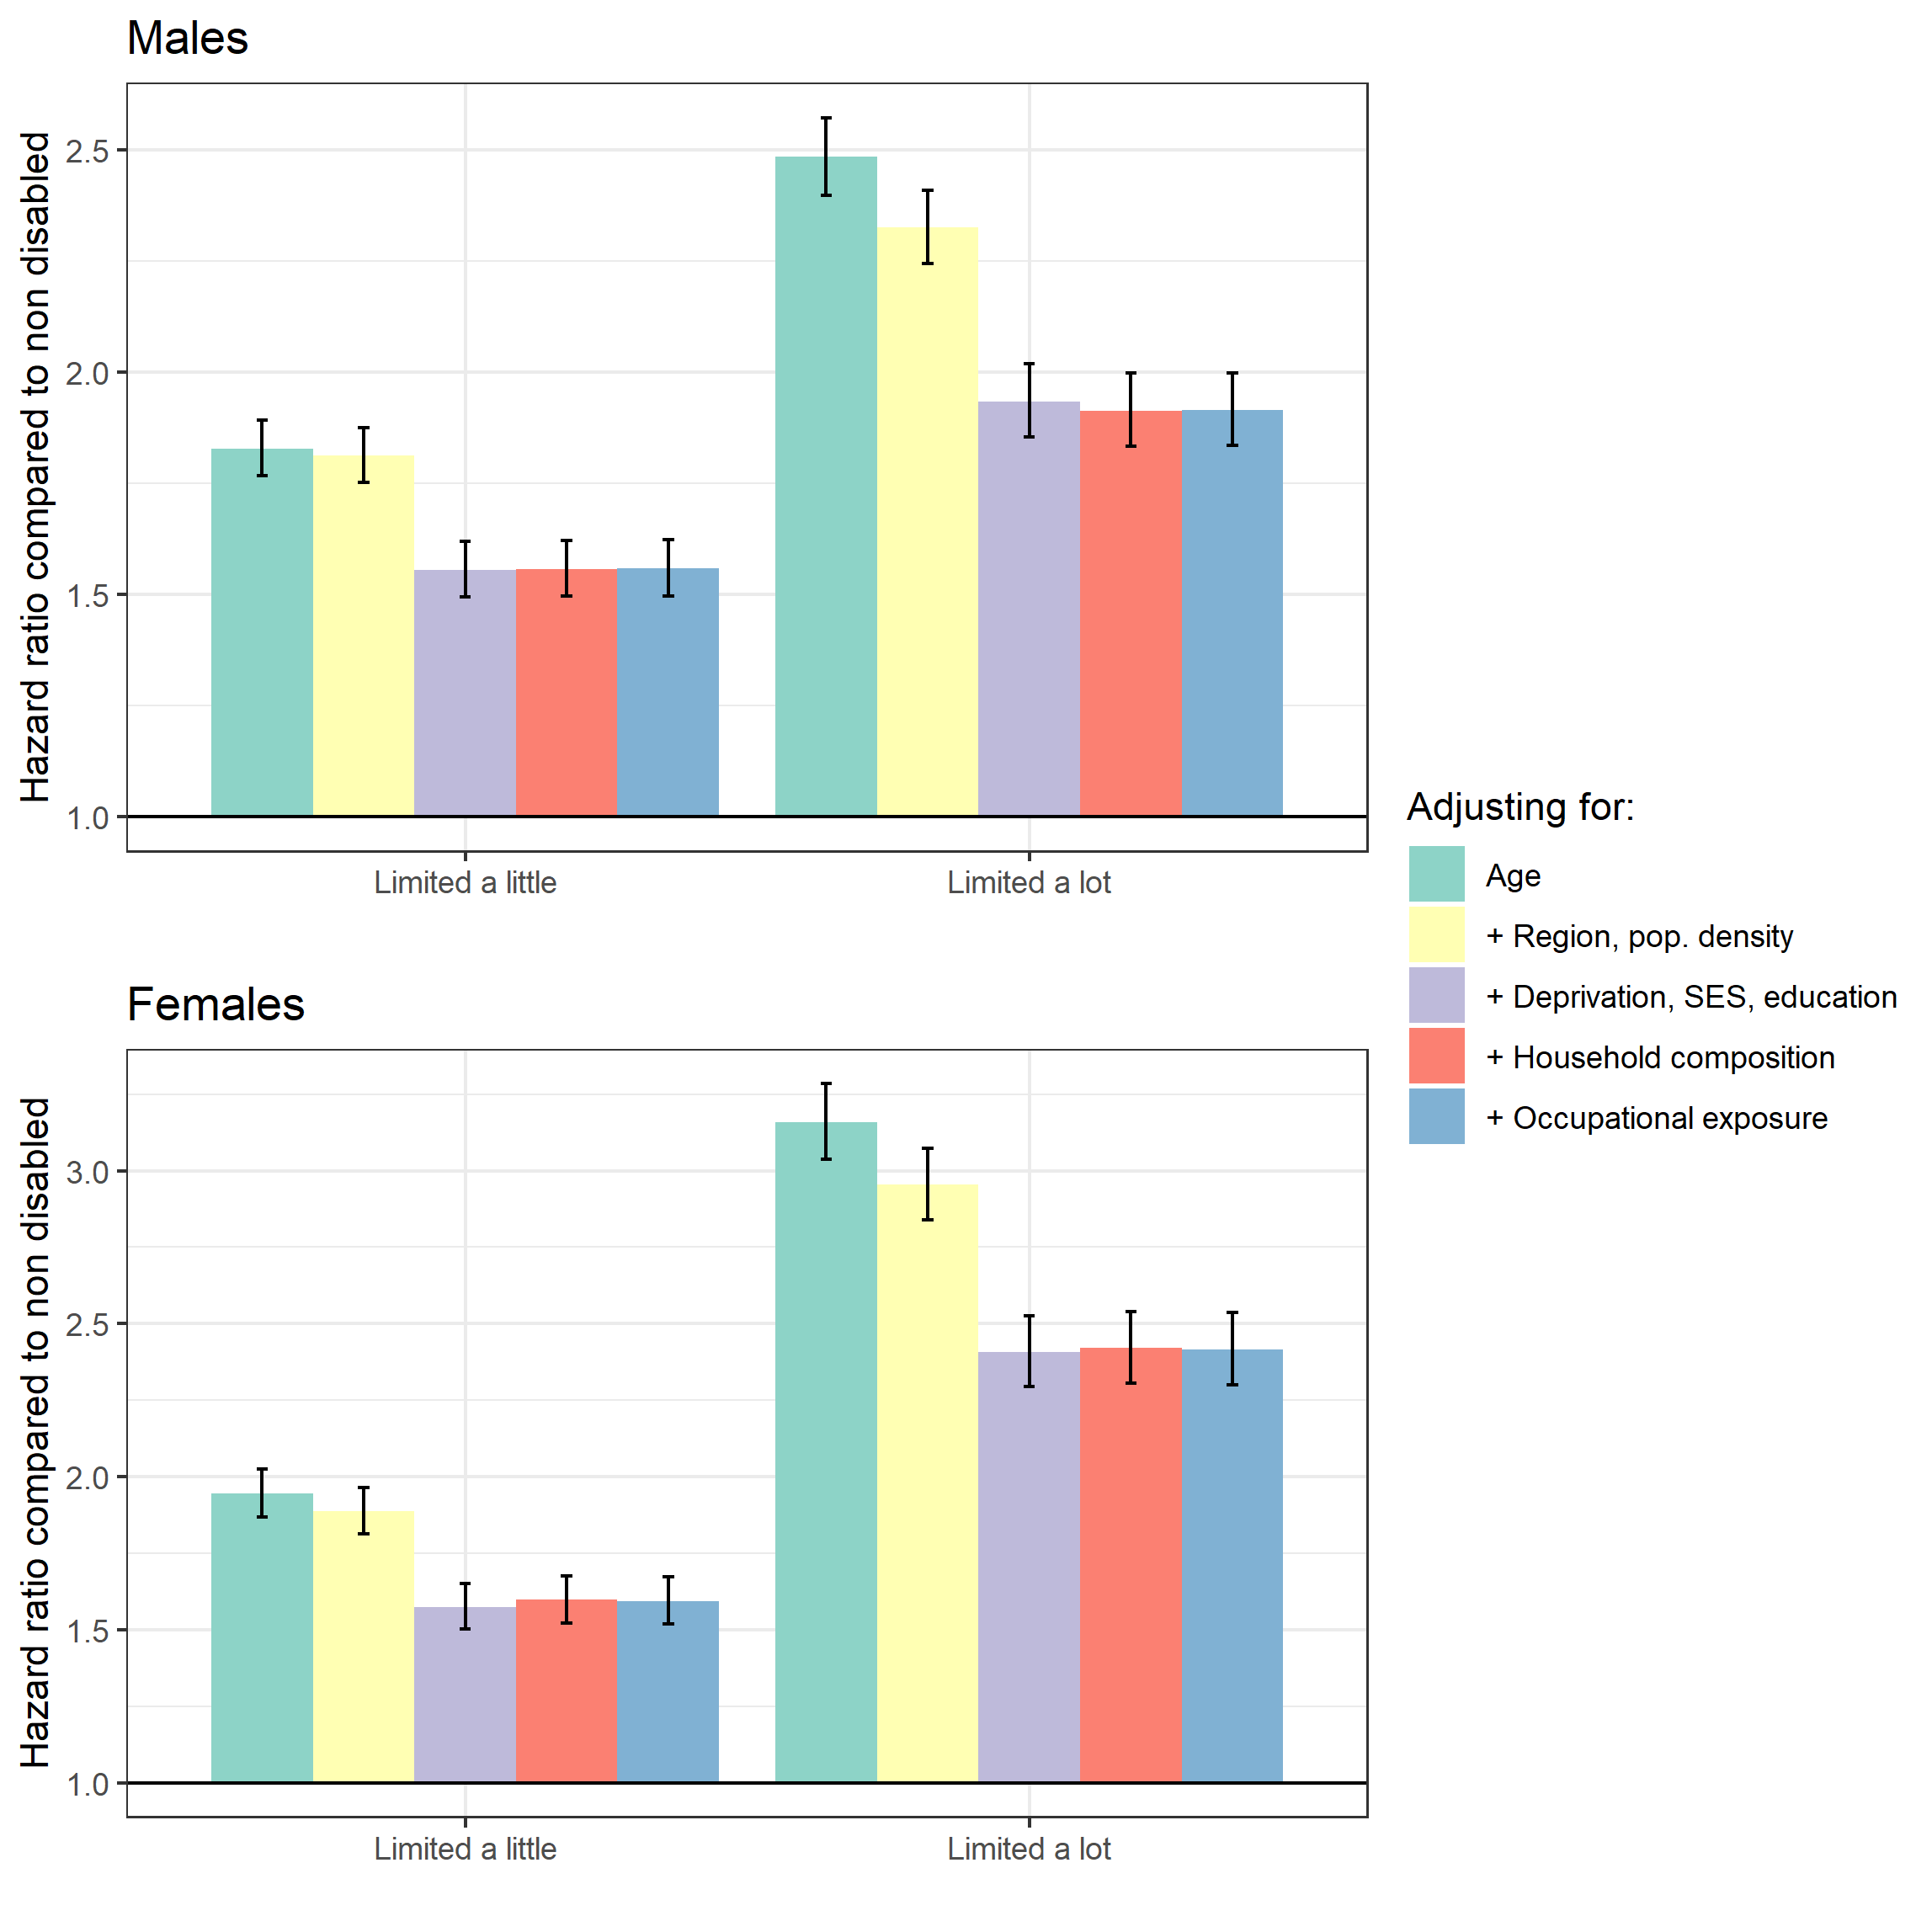
In Coronavirus (COVID-19) related deaths by disability status, England and Wales: 2 March to 15 May 2020 (Figure 3) we reported the hazard ratios for disability status relative to the non-disabled people, after adjusting for age and for the geographical factors, demographic and socio-economic characteristics and occupational exposure.
In Figure 3 in this section we show how the hazard ratio for disability group varies depending on the set of household and individual characteristics we adjust for. We report the corresponding model goodness-of-fit statistics in Reference Table Model diagnostics.
Adjusting for region and population density makes little difference for those whose activities were “limited a little” but reduces the difference for those whose activities were “limited a lot”. Adjusting for deprivation and socio-economic status (SES) substantially reduces the estimated differences in risk of coronavirus (COVID-19)-related death for those whose activities were “limited a little” and those whose activities were “limited a lot”. Adjusting for household composition and occupational exposure makes little difference to the hazard ratios.
Figure 3: Risk of death involving COVID19 by disability status, different model specifications
Source: Office for National Statistics
Notes:
- Causes of death was defined using the International Classification of Diseases, 10th Revision (ICD-10) codes U07.1 and U07.2. Figures include deaths where coronavirus (COVID-19) was the underlying cause or was mentioned on the death certificate as a contributory factor. Figures do not include neonatal deaths (deaths under 28 days).
- Figures are for persons usually resident in England and Wales, based on 2011 Census enumerations, and not known to have died before 2 March 2020.
- Figures are for deaths occurring between 2 March 2020 and 15 May 2020. Figures only include deaths that were registered by 29 May 2020. More information on registration delays can be found on the ONS website:
- The lower and upper 95% confidence limits form a confidence interval, which is a measure of the statistical precision of an estimate and shows the range of uncertainty around the figure. As a general rule, if the confidence intervals around two figures do not overlap then the observed difference between the estimates is unlikely to have occurred by chance if there is actually no underlying difference between the groups.
- The reference category is to the White ethnic group
- Model definitions: 1 Age 2 + Region, Population Density 3 + Deprivation, SES, education 4 + Household composition 5 + Occupational exposure
Download this image Figure 3: Risk of death involving COVID19 by disability status, different model specifications
.png (142.8 kB) .xlsx (17.8 kB)
Manylion cyswllt ar gyfer y Methodoleg
Related publications
- Updated estimates of coronavirus (COVID-19) related deaths by disability status, England: 24 January 2020 to 9 March 2022
- Coronavirus (COVID-19) related deaths by ethnic group, England and Wales: 2 March 2020 to 15 May 2020
- Coronavirus (COVID-19) related deaths by religious group, England and Wales: 2 March to 15 May 2020