Cynnwys
- Main points
- Death registrations and the overall mortality rate for February 2021
- Deaths due to COVID-19 registered in February 2021
- Leading causes of death
- Age-standardised mortality rates by sex and age group, in February 2021
- Deaths registered in the year-to-date
- Death occurrences in February 2021 and year-to-date
- Pre-existing conditions of people whose death was recorded with an underlying cause of COVID-19, deaths registered in 2020
- Monthly mortality data
- Glossary
- Measuring the data
- Strengths and limitations
- Related links
1. Main points
In February 2021, there were 55,489 deaths registered in England, 11,421 deaths (25.9%) more than the five-year average (2015 to 2019) for February; in Wales, there were 3,199 deaths registered, 260 deaths (8.9%) more than the five-year average for February.
The coronavirus (COVID-19) was the leading cause of death in February 2021 for the fourth consecutive month in both England (accounting for 30.1% of all deaths registered in February) and in Wales (22.2% of all deaths).
The second-leading cause of death was dementia and Alzheimer's disease in England, and ischaemic heart diseases in Wales; COVID-19 accounted for more than three times the number of deaths than the second-leading cause in England and more than two times in Wales.
The age-standardised mortality rate (ASMR) of deaths due to COVID-19 in February 2021 was 392.3 deaths per 100,000 people in England, the first decrease since August 2020, and 272.2 deaths per 100,000 people in Wales, the first decrease since September 2020.
The East of England was the English region with the highest mortality rate for deaths due to COVID-19 in February 2021 (477.1 deaths per 100,000 people), followed by London (465.5 deaths per 100,000 people); the South West continued to have the lowest COVID-19 mortality rate, at 258.5 deaths per 100,000 people.
In England, the mortality rate for deaths due to COVID-19 in February 2021 in the most deprived areas was 585.4 deaths per 100,000 people; this was 2.1 times the mortality rate in the least deprived areas (282.0 deaths per 100,000 people).
In Wales, the COVID-19 mortality rate in the most deprived areas was 1.3 times the mortality rate in the least deprived areas (324.4 deaths per 100,000 people in the most deprived areas, 247.0 deaths per 100,000 people in the least deprived areas).
This month's bulletin includes an interactive map of deaths due to COVID-19 in each Middle layer Super Output Area (see Section 3). The accompanying datasets also include mortality rates for deaths due to COVID-19 by local area and deprivation, deaths involving COVID-19 for the UK and pre-existing conditions of people who died due to COVID-19 in 2020.
2. Death registrations and the overall mortality rate for February 2021
Based on provisional data, there were 55,489 deaths registered in England in February 2021. This was 14,680 more deaths than in February 2020 and 11,421 deaths more than the five-year average (2015 to 2019). The five-year average has been provided for 2015 to 2019 (rather than 2016 to 2020) because of the impact of the coronavirus (COVID-19) pandemic on deaths registered in 2020. The average for 2015 to 2019 provides a comparison of the number of deaths expected per month in a usual (non-pandemic) year. Of the deaths registered in February 2021, 28,190 were males and 27,299 were females.
In Wales, the provisional number of deaths registered in February 2021 was 3,199. This was 450 more deaths than in February 2020 and 260 more deaths than the five-year average for February. Of the deaths registered in February in Wales, there were 1,593 male deaths and 1,606 female deaths.
Age-standardised mortality rates (ASMRs) are used for comparisons over time rather than numbers of deaths, as ASMRs account for changes to the population size and age structure. In England, mortality rates for the month of February had been generally decreasing since our data time series began in 2001, from 1,339.3 deaths per 100,000 people in 2001, to a low of 943.6 deaths per 100,000 people in February 2020. The statistically significant decrease in age-standardised mortality rates from 2001 was seen in both males and females (Figure 1).
In England, the February 2021 mortality rate (1,304.5 deaths per 100,000 people) was significantly higher than the mortality rate for February in every year back to 2006. The first year in this analysis, 2001, was the only year to have a significantly higher February mortality rate than 2021. The mortality rate in February 2021 was 1,533.7 deaths per 100,000 males (compared with 1,616.5 in February 2001) and 1,113.0 deaths per 100,000 females (compared with 1,148.7 in February 2001).
In Wales, 2001 (the start of our data time series) was also the year with the highest February mortality rate. Over time, mortality rates in Wales have decreased from 1,431.2 deaths per 100,000 people in February 2001 to a low of 1,042.1 deaths per 100,000 people in February 2020. In February 2021, the mortality rate significantly increased (compared with February 2020) to 1,229.0 deaths per 100,000 people, with both males and females experiencing an increase in deaths.
Figure 1: Mortality rates for the month of February were significantly higher in 2021 than in 2020, for males and females in England and Wales
Age-standardised mortality rates by sex, England and Wales, deaths registered in February 2001 to February 2021
Source: Office for National Statistics – Monthly mortality analysis
Notes:
- Age-standardised mortality rates per 100,000 people, standardised to the 2013 European Standard Population. Monthly rates in this bulletin are adjusted to allow for comparisons with annual rates. For more information, see Section 11: Measuring the data.
- Figures are for deaths registered rather than deaths occurring in each period.
- Figures for 2020 and 2021 are based on provisional mortality data and projected populations.
- Figures exclude non-residents.
- The five-year average has been provided for 2015 to 2019 (rather than 2016 to 2020) because of the impact of the coronavirus (COVID-19) pandemic on deaths registered in 2020. The average for 2015 to 2019 provides a comparison of the number of deaths expected per month in a usual (non-pandemic) year.
Download this chart Figure 1: Mortality rates for the month of February were significantly higher in 2021 than in 2020, for males and females in England and Wales
Image .csv .xls3. Deaths due to COVID-19 registered in February 2021
The doctor certifying a death can list all causes in the chain of events that led to the death and pre-existing conditions that may have contributed to the death. Using this information, we determine an underlying cause of death. More information on this process can be found in our user guide.
In February in most cases (87.6% in England and 84.1% in Wales) where the coronavirus (COVID-19) was mentioned on the death certificate, it was found to be the underlying cause of death. For more information on our definition of COVID-19 deaths, see Section 11: Measuring the data.
In this bulletin, we use the term “due to COVID-19” when referring only to deaths with an underlying cause of death of COVID-19 and we use the term “involving COVID-19” when referring to deaths that had COVID-19 mentioned anywhere on the death certificate, whether as an underlying cause or not.
Of the 55,489 deaths registered in February 2021 in England, 30.1% (16,682 deaths) were due to COVID-19. Taking into account all deaths involving COVID-19 increases the percentage to 34.3% of all deaths (19,049 deaths) in England in February 2021.
In Wales, 22.2% of the 3,199 deaths registered in February 2021 were due to COVID-19 (711 deaths). Taking into account all deaths involving COVID-19 increases the percentage to 26.4% of all deaths (845 deaths) in Wales.
Deaths due to COVID-19 in England and Wales
Age-standardised mortality rates (ASMRs) allow us to adjust for the size and age structure of the population. ASMRs for deaths due to COVID-19 had been increasing month-on-month (since the increase between August and September 2020 in England and between September and October 2020 in Wales), but significantly decreased in February 2021 (Figure 2).
In England, the ASMR for deaths due to COVID-19 significantly decreased for the first time since August 2020, with a rate of 392.3 deaths per 100,000 people in February 2021.
In Wales, the ASMR for deaths due to COVID-19 significantly decreased in February 2021, with a rate of 272.2 deaths per 100,000 people. This is the first significant decrease since July 2020.
In January 2021, the mortality rates for deaths due to COVID-19 were similar in England and Wales (549.6 deaths due to COVID-19 per 100,000 people in England and 541.7 deaths per 100,000 people in Wales). The COVID-19 mortality rate dropped significantly in both countries in February 2021, but the mortality rate in England was 44.1% higher than in Wales (392.3 deaths per 100,000 people in England compared with 272.2 deaths per 100,000 people in Wales). This is the largest percentage difference between the two countries since March 2020.
Figure 2: Mortality rates due to COVID-19 in February 2021 significantly decreased in both England and Wales
Age-standardised mortality rates for deaths due to COVID-19, per 100,000 people, England and Wales, deaths registered in March 2020 to February 2021
Source: Office for National Statistics – Monthly mortality analysis
Notes:
- Age-standardised mortality rates per 100,000 people, standardised to the 2013 European Standard Population. Monthly rates in this bulletin are adjusted to allow for comparisons with annual rates. For more information, see Section 11: Measuring the data.
- Figures are for deaths registered rather than deaths occurring in each period.
- Figures for 2020 and 2021 are based on provisional mortality data and projected populations.
- Figures exclude non-residents of England and Wales.
- Deaths "due to COVID-19" include only deaths where COVID-19 was the underlying cause of death. Age-standardised mortality rates for all deaths involving COVID-19 are available in the accompanying dataset.
- The International Classification of Diseases, 10th Edition (ICD-10) definitions are as follows: coronavirus (COVID-19) (U07.1, U07.2 and U10.9). For more information on our definitions of COVID-19 deaths, see Section 11: Measuring the Data.
Download this chart Figure 2: Mortality rates due to COVID-19 in February 2021 significantly decreased in both England and Wales
Image .csv .xlsIn England, the ASMR for deaths due to COVID-19 significantly decreased in February 2021 for both males (from 680.8 to 483.8 per 100,000 males) and females (from 448.5 to 319.2 per 100,000 females). The mortality rate for deaths due to COVID-19 was significantly higher in males than in females in every month from March 2020 to February 2021.
In Wales, the ASMR for deaths due to COVID-19 also significantly decreased in February 2021 for both males (from 673.0 to 335.1 per 100,000 males) and females (from 440.0 to 223.0 per 100,000 females). Males in Wales also had a higher mortality rate for deaths due to COVID-19 than females between March 2020 and February 2021, though this difference was not statistically significant in every month. More information on mortality rates by sex is available in Tables 3a and 3b of the accompanying dataset.
Deaths due to COVID-19 in each Middle layer Super Output Area in England and Wales
Super Output Areas (SOAs) are small-area statistical geographies covering England and Wales. Each area has a similarly sized population and remains stable over time. For this analysis, Middle layer Super Output Areas (MSOAs) have been used. The accompanying dataset shows the number of deaths from all causes as well as deaths due to COVID-19.
The following interactive map allows you to see the cumulative number of monthly deaths due to COVID-19 in each area.
Figure 3: Number of deaths due to COVID-19 in Middle layer Super Output Areas, England and Wales, deaths registered between March 2020 and February 2021
Embed code
Notes:
- Points on the map are placed at the centre of the local area they represent and do not show the actual location of deaths. The size of the circle is proportional to the number of deaths.
- To protect confidentiality, a small number of deaths have been reallocated between neighbouring areas. Given the method used for this, figures for some areas may be different to previously published data.
- Figures are for deaths registered rather than deaths occurring in each month.
- Figures exclude death of non-residents; geographical boundaries are based on the most up-to-date information available at the time of publication.
- Deaths "due to COVID-19" include only deaths where COVID-19 was the underlying cause of death.
- Locally adopted Middle-layer Super Output Area (MSOA) names are provided by House of Commons Library. While these names are not officially supported for National Statistics, they are provided here to help local users.
- Figures are provisional.
Download the data
Embed code
4. Leading causes of death
Our leading causes of death groupings are based on a list developed by the World Health Organization (WHO). This categorises causes of death using the International Classification of Diseases, 10th edition (ICD-10) into groups that are epidemiologically more meaningful than single ICD-10 codes, for the purpose of comparing the most common causes of death in the population.
Leading causes of death registered in February 2021
Figures 4 and 5 show the 10 most common underlying causes of death registered in February 2021 for England and Wales, compared with the five-year average for February (2015 to 2019).
Figure 4: In England, COVID-19 was the leading cause of death in February 2021 for the fourth consecutive month
Age-standardised mortality rate for selected leading causes of death, per 100,000 people, England, deaths registered in February 2021
Source: Office for National Statistics – Monthly mortality analysis
Notes:
- Age-standardised mortality rates per 100,000 population, standardised to the 2013 European Standard Population. Monthly rates in this bulletin are adjusted to allow for comparisons with annual rates. For more information, see Section 11: Measuring the data.
- Figures are for deaths registered rather than deaths occurring in each period.
- Figures for 2020 and 2021 are based on provisional mortality data and projected populations.
- Figures exclude deaths of non-residents.
- "COVID-19” includes only deaths where COVID-19 was the underlying cause of death.
- The five-year average has been provided for 2015 to 2019 (rather than 2016 to 2020) because of the impact of the coronavirus (COVID-19) pandemic on deaths registered in 2020. The average for 2015 to 2019 provides a comparison of the number of deaths expected per month in a usual (non-pandemic) year.
Download this chart Figure 4: In England, COVID-19 was the leading cause of death in February 2021 for the fourth consecutive month
Image .csv .xls
Figure 5: In Wales, COVID-19 was the leading cause of death in February 2021 for the fourth consecutive month
Age-standardised mortality rate for selected leading causes of death, per 100,000 people, Wales, deaths registered in February 2021
Source: Office for National Statistics – Monthly mortality analysis
Notes:
- Age-standardised mortality rates per 100,000 population, standardised to the 2013 European Standard Population. Monthly rates in this bulletin are adjusted to allow for comparisons with annual rates. For more information, see Section 11: Measuring the data.
- Figures are for deaths registered rather than deaths occurring in each period.
- Figures for 2020 and 2021 are based on provisional mortality data and projected populations.
- Figures exclude deaths of non-residents.
- "COVID-19" includes only deaths where COVID-19 was the underlying cause of death.
- The five-year average has been provided for 2015 to 2019 (rather than 2016 to 2020) because of the impact of the coronavirus (COVID-19) pandemic on deaths registered in 2020. The average for 2015 to 2019 provides a comparison of the number of deaths expected per month in a usual (non-pandemic) year.
- There are 11 leading causes for Wales as diseases of the urinary system and malignant neoplasms, stated or presumed to be primary of lymphoid, haematopoietic and related tissue both had the same number of deaths in February 2021.
Download this chart Figure 5: In Wales, COVID-19 was the leading cause of death in February 2021 for the fourth consecutive month
Image .csv .xlsIn both England and Wales, the coronavirus (COVID-19) was the leading cause of death in February 2021, with 392.3 deaths per 100,000 people in England (16,682 deaths) and 272.2 deaths per 100,000 people in Wales (711 deaths). This was the fourth consecutive month where COVID-19 was the leading cause of death.
The rate of deaths due to COVID-19 was significantly higher than the next-leading cause of death in both England and Wales. In England, the second-most common cause of death in February 2021 was dementia and Alzheimer’s disease, with 112.9 deaths per 100,000 people (4,841 deaths). The COVID-19 mortality rate was more than three times the second-leading cause of death in England.
In Wales, the second-most common cause of death was ischaemic heart diseases, with 134.8 deaths per 100,000 people (349 deaths). The COVID-19 mortality rate was more than two times the second-leading cause of death in Wales.
In England in February 2021, 7 of the 10 leading causes of death were significantly lower than the five-year average (2015 to 2019), with signs, symptoms and ill-defined conditions, and malignant neoplasm of colon, sigmoid, rectum and anus both having a similar mortality rate to the five-year average. In particular, the mortality rate for deaths with an underlying cause of Influenza or Pneumonia was 64.8% lower in February 2021 than the five-year average for February.
In Wales, 4 of the 11 leading causes were significantly lower than the five-year average. Similar to England, the February 2021 mortality rate for Influenza or Pneumonia was 73.2% lower than the five-year average.
Nôl i'r tabl cynnwys5. Age-standardised mortality rates by sex and age group, in February 2021
Generally, since 2001 (the beginning of our data time series), the age-standardised mortality rates for people aged both 0 to 74 years and 75 years and over have been decreasing in England and Wales. However, similar to the trend seen in all ages (Section 2), mortality rates in both England and Wales have increased in 2020 and 2021 for the age group 75 years and over and in England for the under 75 years age group. More information on mortality rates by sex and age group (including age-specific mortality rates by five-year age group for people aged 75 years and over) is available in Tables 5 to 9 of the accompanying dataset.
Nôl i'r tabl cynnwys6. Deaths registered in the year-to-date
There were 124,287 deaths registered in England and 7,630 in Wales during the first two months (January to February) of 2021.
To gain a better idea of year-to-year differences in mortality rates, we calculated year-to-date age-standardised mortality rates (ASMR) based on deaths registered in January to February of each year from 2001 to 2021 (Figure 6). For England, the year-to-date age-standardised mortality rate for 2021 was 1,387.2 deaths per 100,000 people, which was statistically significantly higher than all years between 2004 and 2020.
For Wales, the year-to-date age-standardised mortality rate for 2021 was 1,390.9 deaths per 100,000 people. This was significantly higher than the same period in 2019 and 2020.
Figure 6: The mortality rate for January to February 2021 was significantly higher than the same period in 2019 and 2020 in both England and Wales
Age-standardised mortality rates, England and Wales, deaths registered in January to February 2001 to 2021
Source: Office for National Statistics – Monthly mortality analysis
Notes:
- Age-standardised mortality rates per 100,000 people, standardised to the 2013 European Standard Population. Monthly rates in this bulletin are adjusted to allow for comparisons with annual rates. For more information, see Section 11; Measuring the data.
- Figures are for deaths registered rather than deaths occurring in each period.
- Figures for 2020 and 2021 are based on provisional mortality data and projected populations.
- Figures exclude non-residents.
Download this chart Figure 6: The mortality rate for January to February 2021 was significantly higher than the same period in 2019 and 2020 in both England and Wales
Image .csv .xlsThe age-standardised mortality rate for January to February was higher in Wales than in England in every year since our data time series began in 2001. This difference was significant in most years (only years 2008, 2012 and 2021 showed no significant difference). The smallest difference between England and Wales was in January to February 2021, with the two countries showing similar year-to-date mortality rates (1,387.2 deaths per 100,000 people in England, 1,390.9 in Wales).
Nôl i'r tabl cynnwys7. Death occurrences in February 2021 and year-to-date
This section is based on the date a death occurred – rather than the date of registration used in the previous sections – to monitor current mortality trends. Analysis of deaths by date of registration is useful as the figures are comparable across time and geography. Because of the length of time that it takes a death to be registered, using data based on registration can mean that we are not monitoring the most current death trends. For example, a death registered in February 2021 could have occurred in a previous month or even a previous year. Further information regarding death occurrences and registration delays can be found in Section 11: Measuring the data.
Between 1 January and 28 February 2021, 114,812 deaths occurred in England (and were registered by 7 March 2021). This was 19,682 more deaths than the five-year average (2015 to 2019) for January to February (20.7% higher). Of the 114,812 deaths that occurred, 35.3% were due to the coronavirus (COVID-19) (40,523 deaths).
In Wales, 7,062 deaths occurred in January to February 2021 (and were registered by 7 March 2021). This was 721 more deaths than the five-year average (11.4% higher). COVID-19 was the underlying cause of death in 29.8% of all deaths that occurred (2,108 deaths).
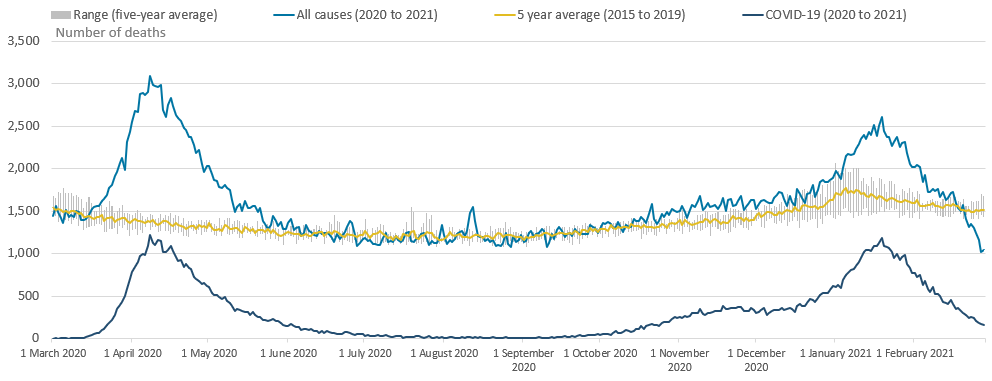
In England, the first death due to COVID-19 occurred on 30 January 2020 (Figure 7). Since 11 March 2020, the number of COVID-19 deaths occurring on each day rose (except for 6 April 2020, when it decreased by 14 deaths) until the peak of 1,223 deaths that occurred on 8 April 2020. Since 8 April, the number of COVID-19 deaths each day had generally been decreasing but began increasing again from mid-September. The number of daily COVID-19 deaths had continued to increase, reaching 1,182 deaths on 19 January 2021 (the highest since 8 April 2020 at 1,223 deaths). Since then, the number of COVID-19 deaths has been decreasing, with 154 deaths due to COVID-19 occurring on 28 February 2021 (though the number of death occurrences on more recent dates is likely to rise as we receive more death registrations).
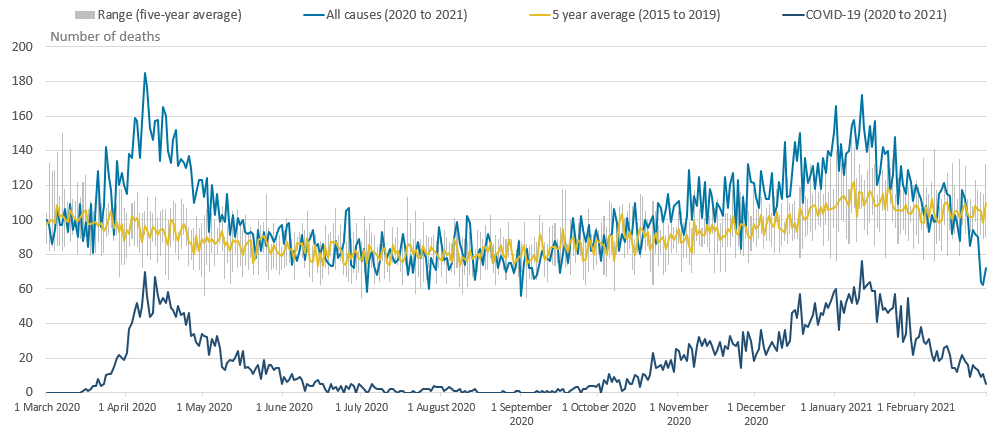
In Wales, the first death with an underlying cause of COVID-19 occurred on 15 March 2020. As in England, the number of COVID-19 deaths per day reached the peak on 8 April 2020, when 70 deaths due to COVID-19 occurred in Wales.
Since 8 April, the number of COVID-19 deaths occurring each day in Wales had been gradually decreasing, with no COVID-19 deaths occurring on 41 days between June and September. However, daily COVID-19 deaths increased throughout October 2020 to January 2021, with 76 deaths occurring on 11 January 2021 (though this may be higher due to registration delays). This is the highest number of daily deaths due to COVID-19 in Wales to-date. Since then, the number of COVID-19 deaths has been decreasing in Wales; trends on more recent dates should be treated with caution as numbers of deaths are likely to rise as we receive more death registrations. In particular, instances where the number of death occurrences on each day in February was below the range of the last five years, are likely to be a result of when the data extract was created.
Figure 7: In England, daily deaths due to COVID-19 started to decrease in mid-January 2021
Number of deaths occurring on each day from March 2020 to February 2021¹, five-year average and range, England
Source: Office for National Statistics - Monthly mortality analysis
Notes:
- Figures are for deaths occurring on each day rather than deaths registered, registered up to 7 March 2021. Death occurrences will increase as more deaths are registered, particularly for later dates.
- The range is the difference between the minimum and maximum value observed on each day during the five-year period (2015 to 2019).
- Figures exclude non-residents.
Download this image Figure 7: In England, daily deaths due to COVID-19 started to decrease in mid-January 2021
.png (54.6 kB) .xls (80.9 kB)
Figure 8: In Wales, daily deaths due to COVID-19 decreased from mid-January 2021 onwards
Number of deaths occurring on each day in from March 2020 and February 2021¹, five-year average and range, Wales
Source: Office for National Statistics - Monthly mortality analysis
Notes:
- Figures are for deaths occurring on each day rather than deaths registered, registered up to 7 March 2021. Death occurrences will increase as more deaths are registered, particularly for later dates.
- The range is the difference between the minimum and maximum value observed on each day during the five-year period (2015 to 2019).
- Figures exclude non-residents.
Download this image Figure 8: In Wales, daily deaths due to COVID-19 decreased from mid-January 2021 onwards
.png (100.7 kB) .xls (79.9 kB)
8. Pre-existing conditions of people whose death was recorded with an underlying cause of COVID-19, deaths registered in 2020
Data on pre-existing conditions of people who died due to the coronavirus (COVID-19) in England and Wales for 2020 can be found in the accompanying dataset. Detailed information on this analysis is available in the January 2021 edition of this bulletin. This analysis will be updated on a quarterly basis in the April edition.
Nôl i'r tabl cynnwys9. Monthly mortality data
Monthly mortality analysis, England and Wales
Dataset | Released 18 March 2021
Monthly data on death registrations and death occurrences in England and Wales, broken down by sex and age. Includes deaths due to the coronavirus (COVID-19) by date of death occurrence, and comparisons of COVID-19 with the leading causes of death.
Deaths due to COVID-19 by local area and deprivation
Dataset | Released 18 March 2021
Provisional age-standardised mortality rates for deaths due to COVID-19 by sex, local authority and deprivation indices, and numbers of deaths by Middle layer Super Output Area.
Deaths involving COVID-19 by month of registration, UK
Dataset | Released 18 March 2021
Provisional age-standardised mortality rates for deaths involving COVID-19 by sex and month of death registration, for England, Wales, Scotland, and Northern Ireland.
Deaths registered monthly in England and Wales
Dataset | Released 18 March 2021
Number of deaths registered each month by area of usual residence for England and Wales, by region, county, local and unitary authority, and London borough.
Pre-existing conditions of people who died due to COVID-19, England and Wales
Dataset | Released 25 February 2021
Pre-existing conditions of people who died due to COVID-19, England and Wales, 2020.
10. Glossary
Age-specific mortality rates
Age-specific mortality rates are used to allow comparisons between specified age groups.
Age-standardised mortality rates
Age-standardised mortality rates (ASMRs) are used to allow comparisons between populations that may contain different proportions of people of different ages. The 2013 European Standard Population is used to standardise rates. In this bulletin, we have adjusted the monthly ASMRs to allow for comparisons with annual rates. For more information see Section 11: Measuring the data.
Coronaviruses
The World Health Organization (WHO) defines coronaviruses as “a large family of viruses that are known to cause illness ranging from the common cold to more severe diseases such as Middle East Respiratory Syndrome (MERS) and Severe Acute Respiratory Syndrome (SARS)”. Between 2001 and 2018, there were 12 deaths in England and Wales due to a coronavirus infection, with a further 13 deaths mentioning the virus as a contributory factor on the death certificate.
Coronavirus (COVID-19)
COVID-19 refers to the “coronavirus disease 2019” and is a disease that can affect the lungs and airways. It is caused by a type of coronavirus. Further information is available from the WHO.
Pre-existing condition
A pre-existing condition is defined as any condition that either preceded the disease of interest (for example, COVID-19) in the sequence of events leading to death or was a contributory factor in the death but was not part of the causal sequence.
Main pre-existing condition
The main pre-existing condition is defined as the one pre-existing condition that is, on average, mostly likely to be the underlying cause of death for a person of that age and sex.
Registration delay
Mortality statistics are compiled from information supplied when deaths are certified and registered as part of civil registration, a legal requirement. According to the Births and Deaths Registration Act 1953, a death should be registered within five days unless it is referred to a coroner for investigation. Mortality statistics for a given time period can be based on occurrence (death date) or registration (registration date); registration delay is the difference between date of occurrence and date of registration.
Statistical significance
The term “significant” refers to statistically significant changes or differences. Significance has been determined using the 95% confidence intervals, where instances of non-overlapping confidence intervals between estimates indicate the difference is unlikely to have arisen from random fluctuation.
95% confidence intervals
A confidence interval is a measure of the uncertainty around a specific estimate. If a confidence interval is 95%, it is expected that the interval will contain the true value on 95 occasions if repeated 100 times. As intervals around estimates widen, the level of uncertainty about where the true value lies increases. The size of the interval around the estimate is strongly related to the number of deaths, prevalence of health states and the size of the underlying population. At a national level, the overall level of error will be small compared with the error associated with a local area or a specific age and sex breakdown. More information is available on our uncertainty pages.
Nôl i'r tabl cynnwys11. Measuring the data
More quality and methodology information on strengths, limitations, appropriate uses, and how the data were created is available in the Mortality statistics in England and Wales QMI and User guide to mortality statistics.
The purpose of this bulletin is to provide timely surveillance of mortality in England and Wales, based on the best available provisional data, including all-cause mortality and deaths where the coronavirus (COVID-19) was the underlying cause.
The analysis contains deaths registered in February 2021 by age and sex, and also includes deaths that occurred in February 2021 by date of death. This expands on the quarterly data for England that were previously published in the Quarterly mortality report. Non-residents of England and Wales are excluded from this analysis. In February 2021, there were 79 deaths of non-residents that were registered in England and Wales.
More in-depth analysis on deaths involving the coronavirus (COVID-19) is included in this bulletin in some months to meet user needs. In the November 2020 edition, we added analysis of deaths due to COVID-19 by local area and deprivation, and in December 2020 we added mortality rates for deaths involving COVID-19 for the UK. In January 2021, we added an analysis of pre-existing conditions of deaths due to COVID-19.
Analysis by month of death registration is consistent with the weekly death registrations release and allows for a more timely analysis than would be possible using death occurrences. This is because a proportion of deaths that occurred in the previous month would not yet have been registered. On average, there is a delay of five days between a death occurring and it being registered, but this can be much longer, especially for certain causes of death. More information on this issue can be found in our impact of registration delays publication.
Deaths data sources
This bulletin is based primarily on death registrations, with a section on death occurrences for surveillance of recent mortality trends. Death occurrences show the number of deaths that occurred within a calendar period and give a better indication than registrations of exactly when deaths were at their highest. This allows mortality to be related to other factors such as weather patterns.
A provisional extract of death registrations and death occurrences data is taken on the first working day after the 8th of the month, to allow time for deaths to be registered. Death registrations data for 2020 and 2021 are provisional; however, we would expect only very small changes to total death registration counts once data are made final. Death occurrences are likely to change, especially for dates towards the end of the current month, as some deaths will not have been registered when the extract is taken.
Figures on deaths due to COVID-19 in this bulletin are different from the daily surveillance figures on COVID-19 deaths published by the Department of Health and Social Care (DHSC) on the GOV.UK website as figures in this report are derived from the formal process of death registration. More information on the different sources of COVID-19 deaths data is available in Deaths registered weekly in England and Wales.
Definition of COVID-19
The doctor certifying a death can list all causes in the chain of events that led to the death and pre-existing conditions that may have contributed to the death. Using this information, we determine an underlying cause of death. We use the term “due to COVID-19” when referring only to deaths with an underlying cause of death of COVID-19. When taking into account all of the deaths that had COVID-19 mentioned anywhere on the death certificate, whether as an underlying cause or not, we use the term “involving COVID-19”. Age-standardised rates for deaths due to COVID-19 and involving COVID-19 are available in the accompanying dataset.
Our definition of COVID-19 (regardless of whether it was the underlying cause or mentioned elsewhere on the death certificate) includes some cases where the certifying doctor suspected the death involved COVID-19 but was not certain. For example, a doctor may have clinically diagnosed COVID-19 based on symptoms, but this diagnosis may not have been confirmed because no test was available, or the test result was inconclusive. Of the 118,145 deaths due to COVID-19, 3,992 (3.4%) were classified as “suspected” COVID-19. Including all deaths involving COVID-19 (131,788 deaths), “suspected” COVID-19 was recorded on 3.5% (4,578 deaths) of all deaths involving COVID-19 in England and Wales.
From the February 2021 bulletin, new International Classification of Diseases (ICD-10) codes for COVID-19 issued by the World Health Organization (WHO) have been implemented for COVID-19 deaths. The new codes are U09.9 (Post-COVID condition, where the acute COVID had ended before the condition immediately causing death occurred) and U10.9 (Multisystem inflammatory syndrome associated with COVID-19 (also called Kawasaki-like syndrome), a specific, uncommon effect of COVID-19 in children). These are in addition to the existing codes of U07.1 (COVID-19, virus identified) and U07.2 (COVID-19, virus not identified, that is, COVID-19 stated to be unconfirmed or suspected).
As ICD-10 code U09.9 cannot be assigned to the underlying cause of death, our deaths due to COVID-19 definition does not include this code. For more information on our definitions of COVID-19 deaths please see the definitions tab of the accompanying dataset.
Monthly mortality rates
We publish the mid-year population estimates used for calculating rates; these are currently available up to 2019. For 2020 onwards, population projections were used.
Calculation of mortality rates for monthly deaths requires adjustments to be made to annual population estimates to calculate rates that are comparable with annual rates. We calculate an annual population centred on the midpoint of the month using two years’ worth of population estimates (or where these are not available, population projections). For the first half of the year (January to June), populations for the current year and the previous year are used; for the second half of the year (July to December), populations for the current year and the following year are used.
This is then multiplied by the number of days within the month as a proportion of the total number of days within that year. The output is used as the population denominator in calculations of age-standardised and age-specific mortality rates.
For example:
June 2020 population equals
where m is the number of days from 1 July 2019 (the start of the mid-year for the population estimate) to the midpoint of June inclusive, N is the number of days in June 2020, M is the number of days in 2020 and (i) is the age group.
July 2020 population equals
where m is the number of days from 1 July 2019 (the start of the mid-year for the population estimate) to the midpoint of July inclusive, N is the number of days in July 2020, M is the number of days in 2020 and (i) is the age group.
For geographies where population projections are not available (such as deprivation deciles quintiles, which are based on Lower layer Super Output Areas), we calculate the proportion of the country-level population that is within each geography. Then we apply this proportion to the country-level population projections to estimate a population projection for that area. This estimated projection is then used in the monthly population method previously described. Mid-year population estimates for 2019 are used to calculate the proportions as these are the most up-to-date estimates available. The monthly population method for geographies below country level was updated in the January 2021 edition and the data back series revised. For more information see the accompanying dataset.
Acknowledgement
We would like to thank Charlee Humphries, Georgia Brett, Emyr John, Rachael Hopkin and Steve Reynolds for their valued contribution to this bulletin.
Nôl i'r tabl cynnwys12. Strengths and limitations
Provisional data are used
Provisional death registrations and death occurrences data are used in this bulletin. This enables timely analysis to be completed to monitor mortality trends. However, as the data for 2020 and 2021 are provisional, they are subject to change.
Data coverage, timeliness and registration delays
Mortality data give complete population coverage. They ensure the estimates are of high precision and are representative of the underlying population at risk. However, because of registration delays, monthly death occurrence data are always somewhat incomplete. This is especially true for deaths that occurred towards the end of the month.
Further information can be found in the Mortality statistics in England and Wales Quality and Methodology Information (QMI) report and the User guide to mortality statistics.
Nôl i'r tabl cynnwys