Cynnwys
- Introduction
- Main points
- Things you need to know
- Suicide registrations in Wales since 1981
- Rates of suicide by age
- Method of suicide since 2001 to 2003
- The relationship between suicide and deprivation in Wales
- Other data included in the accompanying data tables
- Rates of suicide in Wales by occupation group, 2011 to 2015
- Background notes on the suicide by occupation analysis
- Acknowledgements
1. Introduction
Suicide is one of the leading causes of death in adults aged under 50. There is seldom a single reason why someone takes their own life and the factors leading to suicide are complex.
The most recent suicide prevention strategy for Wales (Talk to me 2) sets out the main aims and objectives to prevent and reduce suicide and self-harm over the period 2015 to 2020. This followed Talk to me (PDF, 358KB), the national action plan from 2009 to 2014.
The Office for National Statistics publishes suicide statistics for the UK on an annual basis. This analysis specifically focuses on bringing together data to report on suicide trends in Wales. The analyses included in this article can be used to inform targeted suicide prevention measures and provide a broader understanding of suicide in Wales.
This article includes suicide death registrations in Wales from 1981 to 2017 (latest available data) including deaths analysed by:
- sex
- age
- method of suicide
- local area deprivation
For the very first time, we also include data on suicide by occupation groups, based on an analysis of deaths registered in Wales between 2011 and 2015.
The number of suicides in Wales, particularly where males, females and age groups are analysed separately, can be small, as demonstrated by the relatively wide confidence intervals. For this reason, any comparisons should be interpreted with caution and particular attention paid to overlapping confidence intervals where differences are then not statistically significant. The confidence intervals surrounding the data can be found in the accompanying reference tables.
Nôl i'r tabl cynnwys2. Main points
In 2017, the suicide rate in Wales (13.2 deaths per 100,000) was significantly higher than the rate in the UK (10.1 deaths per 100,000) and England (9.2 deaths per 100,000) but comparable to Scotland (13.9 deaths per 100,000).
The suicide rate for males has seen an increase from 2008 to 2010 (16.1 deaths per 100,000 men) to the latest period (20.6 deaths per 100,000 men in 2015-2017); for females the rate of suicide has remained relatively stable since the mid-1990s (5.1 deaths per 100,000 females in 2015 to 2017).
Males aged 25 to 44 years have had the highest age-specific suicide rate since the early 1990s with a rate of 28.3 deaths per 100,000 in latest period (2015 to 2017); for females the highest rate seen for the latest period was among those aged 45 to 64 years (6.9 per 100,000).
Suicide deaths by hanging, strangulation and suffocation has consistently been the most common method of suicide among males since 2001; this method has been the most common in females since 2011 to 2013, overtaking deaths caused by poisonings.
Males working in the lowest-skilled occupations had a 71% higher risk of suicide than the male national average; for females working in the lowest-skilled occupations the risk was 57% higher than the female national average.
3. Things you need to know
Information for the media
If you are a journalist covering a suicide-related issue, please consider following the Samaritans’ media guidelines on the reporting of suicide. Responsible reporting can potentially mitigate any imitation. In particular, the guidelines advise on terminology, avoidance of excessive detail on method used and include links to sources of support for anyone affected by the themes in the article, such as Samaritans.
Where to go for help
If you are struggling to cope, please call Samaritans free on 116 123 (UK and Republic of Ireland), email jo@samaritans.org, or visit the main Samaritans website or Samaritans Cymru to find details of the nearest branch. Samaritans is available round the clock, every single day of the year, providing a safe place for anyone struggling to cope, whoever they are, however they feel, whatever life has done to them.
Further sources of support can be found on Mental health helpline for Wales and Talk to me too.
Resources are also available online: “U can Cope” includes a film and resources that are designed for people in distress and those trying to support them, to instil hope, promote appropriate self-help and inform people regarding useful strategies and how they can access help and support; “Staying safe if you’re not sure life’s worth living” includes practical, compassionate advice and many useful links for people in distress.
Suicide definition
This release is based on the National Statistics definition of suicide; this includes all deaths from intentional self-harm for persons aged 10 years and over, and deaths where the intent was undetermined for those aged 15 years and over. This definition was revised in January 2016 and further information on the impact can be found in the 2014 suicide registrations bulletin.
Deaths from an event of undetermined intent in 10- to 14-year-olds are not included because, although for older teenagers and adults we assume that in these deaths the harm was self-inflicted, for younger children it is not clear whether this assumption is appropriate.
Nôl i'r tabl cynnwys4. Suicide registrations in Wales since 1981
Between 1981 and 2017, a total of 11,500 deaths have been registered as suicide in Wales, an average of around 300 registered deaths per year. Most deaths registered as suicide in Wales since 1981 have been among men (76%, 8,715 deaths) compared with women (24%, 2,785 deaths).
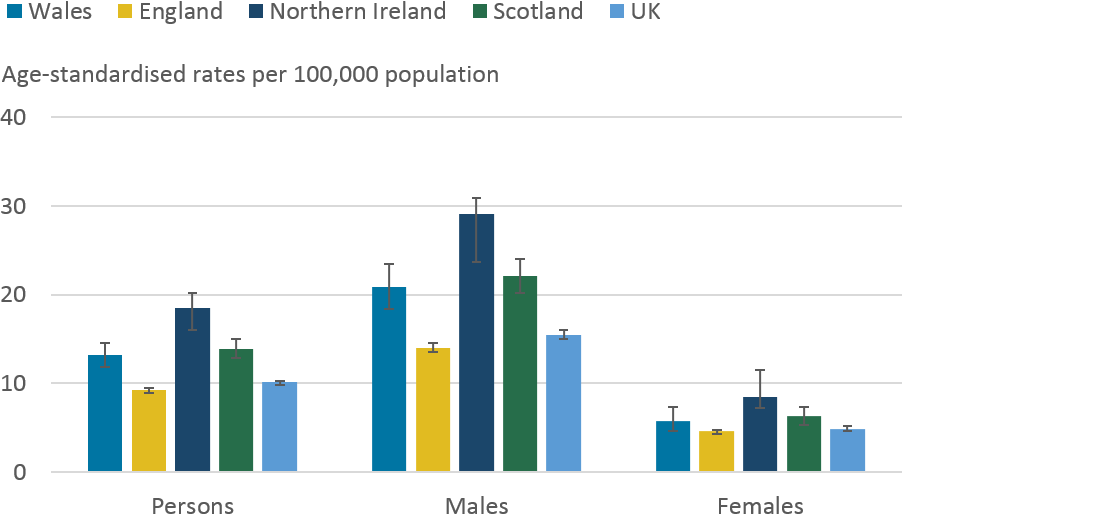
Data from our latest annual release showed that there were 13.2 suicide deaths per 100,000 people in Wales in 2017, equivalent to 360 deaths; this rate was also found to be statistically significantly higher than that of the UK (10.1 deaths per 100,000 people) as seen in Figure 1. Comparing across nations, Wales has a higher suicide rate than England (9.2 deaths per 100,000) but comparable to Scotland (13.9 deaths per 100,000). This was also true when looking at male suicides.
Figure 1: Age-standardised suicide rates by sex, deaths registered in the UK in 2017
Source: Office for National Statistics, National Records of Scotland, Northern Ireland Statistics and Research Agency
Notes:
- The National Statistics definition of suicide is given in "Things you need to know” section.
- Figures are for persons aged 10 years and over.
- Age-standardised suicide rates per 100,000 population, standardised to the 2013 European Standard Population. Age-standardised rates are used to allow comparison between populations that may contain different proportions of people of different ages.
- Figures are for persons usually resident in each area, based on boundaries as of May 2018.
- Figures are for deaths registered, rather than deaths occurring in each calendar year. Due to the length of time it takes to complete a coroner's inquest, it can take months or even years for a suicide to be registered. More details can be found in the Quality and methodology Information report.
Download this image Figure 1: Age-standardised suicide rates by sex, deaths registered in the UK in 2017
.png (21.2 kB) .xls (11.7 kB)
For more than a decade, our annual data has shown a general upward trend in the male suicide rate in Wales, something that has been less evident in the female rate which has been stable. In 2017, the suicide rate among men in Wales continued to be more than two times higher than the female rate (20.9 per 100,000 males compared to 5.8 per 100,000 females). Furthermore, the latest annual rate for men in Wales was statistically significantly higher than the male suicide rate in the UK (15.5 per 100,000). The latest female suicide rate in Wales (5.8 deaths per 100,000 females) was not statistically different than the rate for females in the UK (4.9 per 100,000) or any devolved nation. For further information in relation to the UK and individual nations, please see the Suicides in the UK release.
Data from the Suicides in the UK release is presented by single year of death registration, where small number of yearly deaths can make it difficult to understand trends over time and to determine statistically meaningful changes. The remainder of this section focuses on suicide trends based on three years of aggregated data to provide more granular detail and explanation of changes over time.
Suicide trends in Wales, based on three year rolling averages
Since the period 1981 to 1983 there has been a general downward trend in the Wales suicide rate, however, in recent years there has been a marked increase, particularly among males. For females, the suicide rate in Wales has been generally stable since the mid-1990s.
Figure 2: Age-standardised suicide rates by sex, Wales, registered between 1981 and 2017
Source: Office for National Statistics
Notes:
- The National Statistics definition of suicide is given in "Things you need to know” section.
- Figures are for persons aged 10 years and over.
- Age-standardised suicide rates per 100,000 population, standardised to the 2013 European Standard Population. Age-standardised rates are used to allow comparison between populations which may contain different proportions of people of different ages.
- Figures exclude deaths of non-residents.
- Figures are for deaths registered, rather than deaths occurring in each calendar year. Due to the length of time it takes to complete a coroner's inquest, it can take months or even years for a suicide to be registered. More details can be found in the Quality and methodology Information report
Download this chart Figure 2: Age-standardised suicide rates by sex, Wales, registered between 1981 and 2017
Image .csv .xlsThe suicide rate for all persons in Wales saw a statistically significant decrease from the period 1981 to 1983 (13.6 deaths per 100,000 population) to the period 2008 to 2010 (10.2 deaths per 100,000 population). Since then, however, there has been a statistically significant increase to 12.7 deaths per 100,000 in the latest period, 2015 to 2017.
The recent increase in the suicide rate is also evident in males. Since 2008 to 2010, when the rate was at its lowest (16.1 deaths per 100,000 men), there has been a statistically significant increase to 20.6 deaths per 100,000 men in 2015 to 2017. Although the factors contributing to suicide are many and complex, one explanation for the latest increase could be related to improved reporting from coroners in narrative conclusions, in addition to improved coding of narrative conclusions since 2011. This change in data processing has previously been reported on, for further information please see the Quality and Methodology Information paper.
The suicide rate for females in Wales has seen a statistically significant decrease over the full timeseries from 9.0 deaths per 100,000 females in 1981 to 83 to 5.1 deaths per 100,000 females in 2015 to 2017. Among females, the rate of suicide has remained relatively stable since the mid-1990s.
Nôl i'r tabl cynnwys5. Rates of suicide by age
In this section we refer to broad age groups as these provide clearer trends over time, due to small numbers of deaths.
In Wales, male suicide rates by age have changed considerably since 1981 (see Figure 3a). At the beginning of the time series, men aged 45 years and above had the highest rates. Over time, older men above the age of 65 years have seen substantial reductions in their suicide rates, whereas men aged between 25 and 64 years have seen increases.
Males aged 25 to 44 years have had the highest age-specific suicide rate since the early 1990s. The rate of suicide in this age group has seen a statistically significant increase from the start of the time series in 1981 to 1983 (16.3 deaths per 100,000) to the latest period (28.3 deaths per 100,000 in 2015 to 2017). Since the early 2000's, men aged 45 to 64 years have had the second highest suicide rate.
Older men, particularly those aged 75 years and above, have seen the greatest reduction in their rates. Since 1981 to 1983, the suicide rate for men aged 75 years and above halved from 25.6 deaths to 12.2 deaths per 100,000 in 2001 to 2003 and has since remained relatively stable. A similar pattern has also been seen for men aged 65 to 74 years.
Among young males, aged 10 to 24 years, the rate increased significantly from 1981-1983 (7.6 deaths per 100,000) to 1997-1999 (15.2 deaths per 100,000). Since then, the rate among this group has decreased to 9.5 deaths per 100,000 in 2015 to 2017 but has shown signs of an upward trend in recent years.
Figure 3a: Age-specific suicide rates, males, registered in Wales from 1981 to 2017
Source: Office for National Statistics
Notes:
- The National Statistics definition of suicide is given in "Things you need to know” section.
- Figures are for persons aged 10 years and over.
- Age-specific suicide rate per 100,000 population.
- Rates were not calculated where there were fewer than three death registrations.
- Figures exclude deaths of non-residents.
- Figures are for deaths registered, rather than deaths occurring in each calendar year. Due to the length of time it takes to complete a coroner's inquest, it can take months or even years for a suicide to be registered. More details can be found in the Quality and methodology Information report.
Download this chart Figure 3a: Age-specific suicide rates, males, registered in Wales from 1981 to 2017
Image .csv .xlsAmong females, the most noticeable change over time has been a substantial fall in the suicide rates among those aged over 45 years (see Figure 3b). From 1981 to 1983 to 2015 to 2017, the female rate has fallen by 51% for those aged 45 to 64 years (from 14.1 to 6.9 deaths per 100,000), by 73% for those aged 65 to 74 years (from 14.5 to 3.9 deaths per 100,000) and by 75% for those aged 75 years and over (from 10.0 to 2.5 deaths per 100,000).
In contrast, the rate of suicide in women aged 10 to 24 years statistically significantly increased from 1.4 deaths per 100,000 in 1981 to 1983 to 4.8 deaths per 100,000 in 2015 to 2017, which is equivalent to 39 deaths in the latest period compared to 14 deaths in 1981 to 1983.
Figure 3b: Age-specific suicide rates, females, registered in Wales from 1981 to 2017
Source: Office for National Statistics
Notes:
- The National Statistics definition of suicide is given in "Things you need to know” section.
- Figures are for persons aged 10 years and over.
- Age-specific suicide rate per 100,000 population.
- Rates were not calculated where there were fewer than three death registrations.
- Figures exclude deaths of non-residents.
- Figures are for deaths registered, rather than deaths occurring in each calendar year. Due to the length of time it takes to complete a coroner's inquest, it can take months or even years for a suicide to be registered. More details can be found in the Quality and methodology report.
Download this chart Figure 3b: Age-specific suicide rates, females, registered in Wales from 1981 to 2017
Image .csv .xls6. Method of suicide since 2001 to 2003
In this section we refer to deaths registered since 2001 for simplicity. Prior to this time, method of suicide was coded using an earlier version of the International Classification of Diseases.
Since 2001, hanging, strangulation and suffocation has been the most common method of suicide among males (see Figure 4a). The proportion of male suicides by this method has increased from 50% of all suicide deaths in the period 2001 to 2003 to 66% in the latest period (2015 to 2017). Poisoning as a method of suicide for males has decreased from 27% in 2001 to 2003 to 13% in 2015 to 2017.
Figure 4a: Proportion of suicide by method, males, Wales, registered between 2001 and 2017
Source: Office for National Statistics
Notes:
- The National Statistics definition of suicide is given in "Things you need to know” section.
- “Other” category includes methods of suicide such as firearm, contact with sharp object and jumping or lying in front of a moving object.
- Figures are for persons aged 10 years and over.
- Figures exclude deaths of non-residents.
- Figures are for deaths registered, rather than deaths occurring in each calendar year. Due to the length of time it takes to complete a coroner's inquest, it can take months or even years for a suicide to be registered. More details can be found in the Quality and methodology report.
- Table 7 in the reference table, named “Suicide in Wales”, has more information regarding definitions.
Download this chart Figure 4a: Proportion of suicide by method, males, Wales, registered between 2001 and 2017
Image .csv .xlsAmong females, poisoning was the most common method of suicide from 2001 to 2003 to 2006 to 2008, accounting for 50% of all suicides in 2004 to 2006 at its peak (see Figure 4b). Suicide by poisoning accounted for a third (33%) of female deaths in the latest period compared to 43% in 2001 to 2003. Since 2011 to 2013 hanging, strangulation and suffocation has been the most common suicide method in females accounting for 49% of all suicides in 2015 to 2017 compared to 32% in 2001 to 2003.
Analysis reported in the academic literature has shown an increase in the proportion of suicides from hanging in the UK, particularly among females. This may be related to restrictions on the availability of other methods, such as drugs used in overdose, and to a misconception that hanging is a quick and painless way to die. Analysis conducted using our data in 2012 revealed that there was a major reduction in deaths involving the pain-killing drug co-proxamol following its withdrawal in 2005. A separate study published in 2013 found that UK legislation to reduce the size of paracetamol packages was followed by a significant reduction in the number of deaths due to paracetamol overdose.
Figure 4b: Proportion of suicide by method, females, Wales, registered between 2001 and 2017
Source: Office for National Statistics
Notes:
- The National Statistics definition of suicide is given in "Things you need to know” section.
- “Other” category includes methods of suicide such as firearm, contact with sharp object and jumping or lying in front of a moving object.
- Figures are for persons aged 10 years and over.
- Figures exclude deaths of non-residents.
- Figures are for deaths registered, rather than deaths occurring in each calendar year. Due to the length of time it takes to complete a coroner's inquest, it can take months or even years for a suicide to be registered. More details can be found in the Quality and methodology report.
- Table 7 in the reference table, named “Suicide in Wales”, has more information regarding definitions.
Download this chart Figure 4b: Proportion of suicide by method, females, Wales, registered between 2001 and 2017
Image .csv .xlsSeveral differences also exist when looking at method of suicide by age group and sex. Among men, hanging, strangulation and suffocation was the most common method for all age-groups (see Figure 5a), however, the proportion of suicides from this cause decreases by age with the highest proportion among 10 to 24 year olds (72% of all suicides) and the lowest among those aged 75 years and above (45% of all suicides). The proportion of male suicides by poisoning generally increases with age with the highest proportion seen in those aged 75 years and over (22% of all suicides) and the lowest seen in 10 to 24-year olds (7% of all suicides).
Figure 5a: Proportion of suicide by method and age, males, Wales, registered between 2013 and 2017
Source: Office for National Statistics
Notes:
- The National Statistics definition of suicide is given in "Things you need to know” section.
- “Other” category includes methods of suicide such as firearm, contact with sharp object and jumping or lying in front of a moving object.
- Figures are for persons aged 10 years and over.
- Figures exclude deaths of non-residents.
- Figures are for deaths registered, rather than deaths occurring in each calendar year. Due to the length of time it takes to complete a coroner's inquest, it can take months or even years for a suicide to be registered. More details can be found in the Quality and methodology report.
- Table 8 in the reference table, named “Suicide in Wales”, has more information regarding definitions.
Download this chart Figure 5a: Proportion of suicide by method and age, males, Wales, registered between 2013 and 2017
Image .csv .xlsFor females, hanging, strangulation and suffocation was the most common suicide method for those aged under 65 years; 10 to 24 years (78%), 25 to 44 years (57%) and 45 to 64 years (44%). The proportion of female suicides by this method decreases with age, with poisoning being the most common suicide method for females aged 65 to 74 years (36%) and 75 years and over (38%) as seen in Figure 5b.
Figure 5b: Proportion of suicide by method and age, females, Wales, registered between 2013 and 2017
Source: Office for National Statistics
Notes:
- The National Statistics definition of suicide is given in "Things you need to know” section.
- “Other” category includes methods of suicide such as firearm, contact with sharp object and jumping or lying in front of a moving object.
- Figures are for persons aged 10 years and over.
- Figures exclude deaths of non-residents.
- Figures are for deaths registered, rather than deaths occurring in each calendar year. Due to the length of time it takes to complete a coroner's inquest, it can take months or even years for a suicide to be registered. More details can be found in the Quality and methodology report.
- Table 8 in the reference table, named “Suicide in Wales”, has more information regarding definitions.
Download this chart Figure 5b: Proportion of suicide by method and age, females, Wales, registered between 2013 and 2017
Image .csv .xls7. The relationship between suicide and deprivation in Wales
As with many causes of death, in Wales rates of suicide are higher in the most deprived local areas when compared to the least deprived local areas. Since 2010 to 2012, rate of suicide has always been statistically higher in the most deprived local areas of Wales compared to the least deprived areas, with the suicide rate for the most deprived areas (15.4 deaths per 100,000) being nearly double that in the least deprived areas (8.6 deaths per 100,000 people) for the latest period.
When looking at data over time, suicide rates in Wales’ most deprived areas have generally decreased despite a recent upward trend that is not statistically significant (see Figure 6). In contrast, suicide rates in Wales’ least deprived areas have generally been stable in recent years.
Figure 6: Age-standardised suicide rates, all persons, most and least deprived quintiles in Wales and Wales average, registered between 2010 and 2017
Source: Office for National Statistics
Notes:
- The National Statistics definition of suicide is given in the “Things you need to know” section.
- Figures are for persons aged 10 years and over.
- Figures exclude deaths of non-residents.
- Age-standardised suicide rates per 100,000 population, standardised to the 2013 European Standard Population. Age-standardised rates are used to allow comparison between populations which may contain different proportions of people of different ages.
- Figures are for deaths registered, rather than deaths occurring in each calendar year. Due to the length of time it takes to complete a coroner's inquest, it can take months or even years for a suicide to be registered. More details can be found in the Quality and methodology report.
- Deprivation quintiles are based on the Welsh Index of Multiple Deprivation (WIMD), which is the official measure of relative deprivation with quintile 1 representing the most deprived areas and quintile 5 representing the least deprived areas, WIMD 2011 was used for years 2010 to 2013 and WIMD 2014 was used for years 2014 to 2017.
Download this chart Figure 6: Age-standardised suicide rates, all persons, most and least deprived quintiles in Wales and Wales average, registered between 2010 and 2017
Image .csv .xls8. Other data included in the accompanying data tables
Rates of suicide based on the date of death since 1981. In all, occurrence data based on the date of death provides similar trends to data based on the date of death registration.
Rates of suicide based on five-year age groups. This provides more granular detail than the age-specific rates discussed in the report, however, the patterns are more volatile due to the relatively smaller number of deaths.
Rates of suicide for sub-national geographies including Local Authority Areas and Welsh Local Health Boards based on latest available boundaries. In all, due to small numbers of deaths, there tend to be few statistical differences when comparing small area suicide rates with each other and with the national suicide rate for Wales.
9. Rates of suicide in Wales by occupation group, 2011 to 2015
In this final section of the article, we look at how rates of suicide in Wales differ by occupation group, following the approach and method used in previously published analysis for England. Our commentary largely focuses on high-level groups of occupations, referred to as major groups, due to small numbers of deaths when looking at specific occupations.
Our findings here are similar to the previous analysis for England. For example, of all the occupation groups, and among both sexes, the highest level of suicide risk was found among low-skilled elementary occupations.
The analyses are based on deaths registered in Wales between 2011 and 2015. Occupation-specific suicide risk was estimated using data from two sources: occupation was established using the information provided on the death certificate by the informant at the time of death registration, and occupation-specific population counts were taken from the 2011 Census to define the population at risk. In the analysis, we focused on those aged 20 to 64 years to improve the comparability between the occupation recorded at census and that at the time of death registration.
During the period 1,335 deaths were recorded as suicide. Of these records 973 (73%) had information on the deceased’s occupation. Of these suicides with a recorded occupation, 806 (83%) were among men and 167 (17%) were among women; the mean age of those with occupation data was 43 years. Further information on the precise methodology can be found in the background notes.
Among men three major groups of occupation had elevated risk of suicide: elementary low-skilled occupations, caring, leisure and other service occupations, and skilled trades occupations.
Among men, three of the nine major occupation groups had statistically elevated risk of suicide, when compared to the level of risk among all men in Wales (see Figure 7, where the suicide risk is compared to 'the national average'). The lowest risks were seen among professional occupations and managers, directors and senior officials.
Low-skilled elementary occupations (that is mostly involving routine tasks, often with the use of handheld tools and, in some cases, requiring a degree of physical effort), had the highest level of risk (71% higher than the risk among all men in Wales) and accounted for 20% of male suicide deaths where an occupation was stated (162 deaths). When looking at this group in finer detail, the highest risk was seen in low-skilled construction workers, where the level of risk was four times higher than that observed among all men in Wales. Elevated risk of suicide was also found among low-skilled workers in processing plants (around three times higher).
The next major group with elevated risk was caring, leisure and other service occupations (70% higher than the risk among all men in Wales). Among the specific occupations in this group, the highest risk was seen among care workers and home carers (2.5 times higher), however, this group had a small number of deaths overall (24 deaths).
The final major group with elevated risk was males working in skilled trades occupations (41% higher than the risk among all men in Wales). This group also accounted for the highest proportion of deaths, around one third of male suicides where an occupation was stated (260 deaths). When looking at this group in finer detail, the highest level of risk was seen in building finishing trades (around twice the level of risk among all men in Wales). The risk of suicide was also found to be elevated among those working in construction and building trades (around two times higher).
Figure 7: Male suicides in each major occupational group, deaths registered in Wales 2011 to 2015

Source: Office for National Statistics
Notes:
- Occupation-specific risks of suicide are summarised here using the standardised mortality ratio (SMR). This establishes whether the number of suicides in an occupation is high or low relative to age- and gender-specific patterns of suicide in the general population (that is all usual residents in Wales aged 20 to 64 years).
- An SMR higher than 100 indicates a greater risk in that occupation; values less than 100 suggest lower than expected risk (for example an SMR of 150 means a 50% increase in the risk relative to peers of the same age group and gender in the population).
- Occupations have a statistically significant increased or decreased risk of suicide where the 95% confidence limits exclude 100.
Download this image Figure 7: Male suicides in each major occupational group, deaths registered in Wales 2011 to 2015
.png (44.9 kB) .xls (39.4 kB)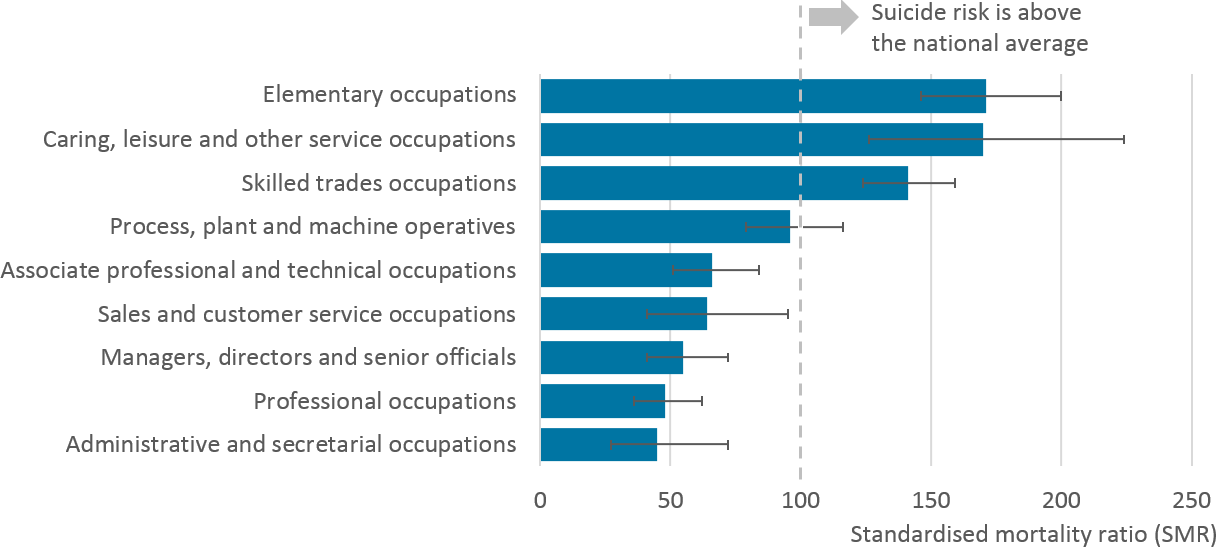
Among females, despite a relatively small overall number of deaths, those working in low skilled-elementary occupations had significantly elevated risk of suicide.
Focusing on the nine major occupation groups, only those working in low-skilled elementary occupations were identified as having significantly higher risk of suicide compared to all women in Wales (see Figure 8). In this group, the risk of suicide was 57% higher than that observed among all females in Wales, however, this group had a small overall number of deaths (29 deaths) creating a high degree of statistical uncertainty.
Due to the relatively small number of female suicides, the risk of suicide in the other major occupation groups was not found to differ to the level of risk in the general population. That said, the overall pattern was consistent with findings among men, with lower risk among managers, directors and senior officials and professional occupations, and higher risks among skilled trades and elementary occupations.
Figure 8: Female suicides in each major occupational group, deaths registered in Wales 2011 to 2015

Source: Office for National Statistics
Notes:
- Standard mortality ratios have not been produced for the following occupation groups for females due to small numbers of deaths: 1) Managers, directors and senior official 5) skilled trades occupations and 8) process, plant and machine operatives.
- Occupation-specific risks of suicide are summarised here using the standardised mortality ratio (SMR). This establishes whether the number of suicides in an occupation is high or low relative to age- and gender-specific patterns of suicide in the general population (that is all usual residents in Wales aged 20 to 64 years).
- An SMR higher than 100 indicates a greater risk in that occupation; values less than 100 suggest lower than expected risk (for example an SMR of 150 means a 50% increase in the risk relative to peers of the same age group and gender in the population).
- Occupations have a statistically significant increased or decreased risk of suicide where the 95% confidence limits exclude 100.
Download this image Figure 8: Female suicides in each major occupational group, deaths registered in Wales 2011 to 2015
.png (36.3 kB) .xls (27.1 kB)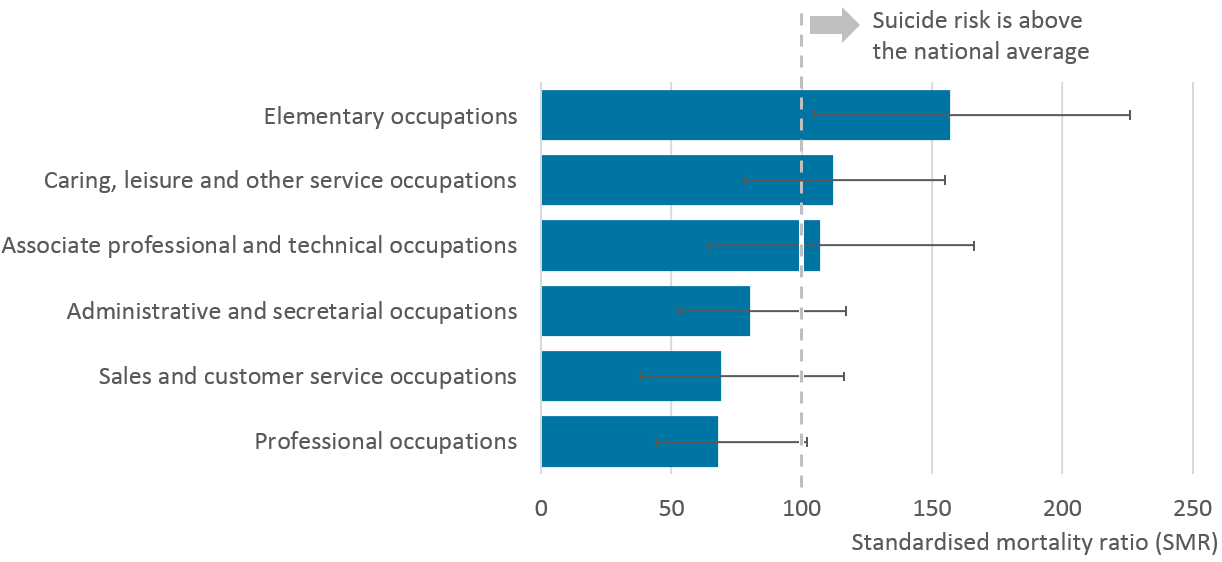
Why do rates of suicide differ by occupation group?
Three factors are thought to contribute to occupation specific suicide risk. First, job-related features such as low pay, low job security and risk of injury are important. Second, selection effects whereby people who are potentially more vulnerable to suicide because of specific personality or behavioural characteristics may choose particular occupations, for example caring professions. Third, some occupations provide ready access to, or technical knowledge about, highly lethal methods of suicide such as drugs.
For Wales, when looking at the occupation groups with the highest level of suicide risk, the pattern of findings was largely consistent with those previously reported for England; a fuller discussion of relevant literature can be found in Suicide by occupation, England: 2011 to 2015.
Nôl i'r tabl cynnwys10. Background notes on the suicide by occupation analysis
Classification of occupation
Data on occupation is coded using the Standard Occupation Classification (SOC 2010). Full lists of occupations used in the analysis are reported in the accompanying data tables, and descriptions of these can be found in the ONS Standard Occupation Classification Hierarchy.
Data analysis
Occupation-specific risks of suicide are summarised in this report using the standardised mortality ratio (SMR). This establishes whether the number of suicides in an occupation is high or low relative to age- and gender-specific patterns of suicide in the general population (that is all usual residents in Wales aged 20 to 64 years).
An SMR higher than 100 indicates a greater risk in that occupation; values less than 100 suggest lower than expected risk against the national average (for example an SMR of 150 means a 50% increase in the risk relative to peers of the same age group and gender in the population).
In addition, the value of the SMR should be interpreted with respect to its lower and upper 95% confidence limits. These provide the range of values within which we are 95% confident the true value of the SMR lies. In other words, the confidence limits capture the statistical uncertainty in our estimates due to the often small number of deaths – the smaller the number of deaths, the wider the range of the lower and upper confidence limits. Only when the 95% confidence limits exclude 100 do we have statistical evidence that an occupation is at increased or decreased risk of suicide. Further information on the SMR, including the calculations involved have been published by Public Health England (Excel, 150KB).
Missing data
Reasons for missing occupation data include: insufficient detail on occupation being provided at the time of death registration to enable accurate coding; the deceased did not have an occupation; the deceased was recorded as retired, permanently sick, unemployed; living by independent means or a student.
Further information
Further information on the methods and approach behind the analysis is detailed in previously published analysis for England.
Nôl i'r tabl cynnwys11. Acknowledgements
We'd like to thank Professor Ann John for her invaluable comments to this piece of work.
Nôl i'r tabl cynnwys