1. Key points
The overall number of deaths registered in the United Kingdom was 13% lower in 2013 than in 1983.
There was a 59% reduction in the number of infant deaths for boys and 58% for girls over the period 1983 to 2013.
Cancer was the most common broad disease group in 2013 for both men and women in the UK. A decade earlier circulatory diseases were the most common broad disease group.
The age-standardised mortality rates (ASMRs) for circulatory diseases decreased substantially over the period 1983 to 2013, by 711 deaths per 100,000 men and 450 deaths per 100,000 women.
The ASMRs for Scotland were the highest of all the constituent countries over the period 1983 to 2013.
The majority of all deaths registered in 2013 were in the 80+ age group (46% for men and 63% for women).
2. Total deaths
The number of deaths registered in the United Kingdom (UK) in 2013 was 576,458, an overall reduction of 13% from the total number of deaths (659,101) registered in the UK 30 years ago. The number of deaths declined for both men and women between 1983 and 2013, by 15% for males and 10% for females. These declines have occurred despite the overall increase in population and the ageing of the population. However there have been slight increases in the number of deaths over the last couple of years, due to the increase in and ageing of the population.
Nôl i'r tabl cynnwys3. Infant mortality
In 2013, there were 3,065 infant deaths (under 1 year of age) registered in the UK. This was a reduction of 59% for boys and 58% for girls since 1983. The 30 year period has seen a steady decline in the infant mortality rate, from 10 deaths per 1,000 live births in 1983 to 4 in 2013 (see Figure 1). Infant mortality declined in all of the constituent countries between 1983 and 2013. General improvements in healthcare and more specific improvements in midwifery and neonatal intensive care can partly explain the overall fall in the rate of change1.
Figure 1: Infant mortality rate, UK and constituent countries
1983 to 2013
Source: Office for National Statistics
Notes:
- The number of deaths registered to babies aged less than 1 year and the number of live births registered in a year were used to calculate the infant mortality rates.
Download this chart Figure 1: Infant mortality rate, UK and constituent countries
Image .csv .xlsNotes for Infant mortality
- Childhood, Infant and Perinatal Mortality in England and Wales, 2012 http://www.ons.gov.uk/ons/rel/vsob1/child-mortality-statistics--childhood--infant-and-perinatal/2012/stb-child-mortality-stats-2012.html#tab-Background
4. Age-standardised mortality rates, 1983-2013, UK
Figure 2: Age-standardised mortality rates
1983 to 2013, UK and constituent countries

Source: Office for National Statistics
Notes:
- The number of deaths registered in a year and mid-year population estimates by age and sex were used to calculate age-specific mortality rates for all ages except for babies aged less than 1 year where the number of live births registered in a year was used as the denominator.
- Age-standardised to the 2013 European Standard Population using 5 year age groups up to 95+.
Download this image Figure 2: Age-standardised mortality rates
.png (38.9 kB) .xls (34.3 kB)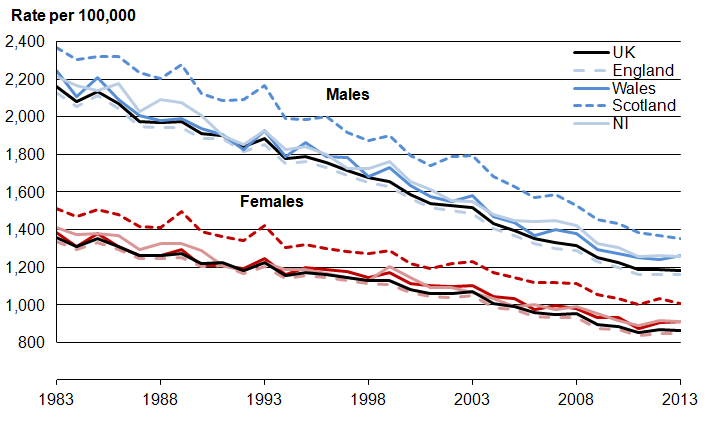
In 2013, the overall age-standardised mortality rate (ASMR) in the UK for males and females combined was 1,002 deaths per 100,000 persons. When looking at men and women separately there were 1,183 deaths per 100,000 males and 865 deaths per 100,000 females. In contrast the rates in 1983 were 2,158 and 1,357 respectively. Female ASMRs for the UK and each constituent country have been consistently lower than those for males over the 30 year period 1983 to 2013 (see Figure 2).
Age-standardised rates allow for differences in the age structure of populations and allow valid comparisons to be made between different countries and over time. The European Standard Population (ESP) is a hypothetical population and is the same for both males and females so the rates may be compared between the sexes.
The ASMRs for the period 1983 to 2013 show a decline in mortality of 45% for males in the UK and 36% for females. The decline over this period has been fairly constant, with the difference between the male and female ASMRs gradually reducing. In 2013 the difference between male and female ASMRs was around 300 deaths per 100,000 persons compared with the difference of just over 800 deaths per 100,000 in 1983.
The ASMRs for Scotland have been the highest of all the constituent countries, for both men and women throughout the period 1983 to 2013. In 2013 the ASMR for men in Scotland was 1,354 deaths per 100,000 and for women it was 1,005. There are differences of 195 and 159 respectively, when comparing with England, which had the lowest ASMRs of the constituent countries at 1,159 for males and 846 for females. In 1983 the differences between the highest ASMRs (Scotland) and the lowest ASMRs (England) were 235 deaths per 100,000 population for males and 176 for females, so the gap has narrowed.
The ASMRs for Wales and Northern Ireland are similar to England in both levels and trends, although there has been some divergence in the last few years.
Nôl i'r tabl cynnwys5. Deaths by broad disease group
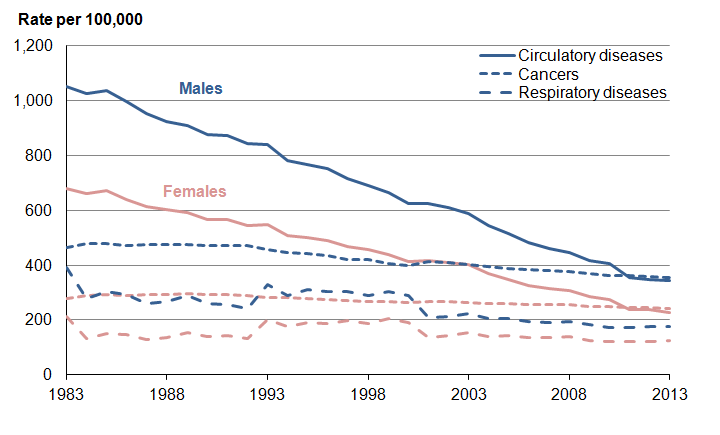
Figure 3: Age-standardised mortality rates by three main broad disease groups
1983 to 2013, UK
Source: Office for National Statistics
Notes:
- The number of deaths registered in a year and mid-year population estimates by age and sex were used to calculate age-specific mortality rates for all ages except for babies aged less than 1 year where the number of live births registered in a year was used as the denominator.
- Age-standardised to the 2013 European Standard Population using 5 year age groups up to 90+.
- International Classification of Diseases (ICD-10) cause codes: C00-D48 Neoplasms (Cancers); I00-I99 Diseases of the circulatory system; and J00-J99 Diseases of the respiratory system.
Download this image Figure 3: Age-standardised mortality rates by three main broad disease groups
.png (24.3 kB) .xls (32.3 kB)
The three main broad disease groups, circulatory diseases, cancers and respiratory diseases, accounted for 71% of all UK deaths in 2013, a smaller proportion than in 1983 when these were 87% of all deaths. In 2013 eight of the top ten causes of death in England and Wales were within these three major cause groups1.
Cancer was the most common broad disease group in 2013 for both men and women in the UK. This was a change from a decade earlier, where circulatory diseases (including heart disease and stroke) were the most common cause of death. Cancers accounted for 353 deaths per 100,000 population of the UK in 2013 for men and 243 deaths per 100,000 population for women. The ASMRs for cancers in the UK have declined gradually over the 30 year period 1983 to 2013, with a slightly larger (24%) decline in the ASMR for males than for females (13%).
Circulatory diseases were the leading cause of death in the UK until 2010 for both males and females. Circulatory diseases accounted for 342 deaths per 100,000 males in 2013 and 229 deaths per 100,000 females. The ASMRs for circulatory diseases have decreased by two thirds over the period 1983 to 2013 by 711 deaths per 100,000 males and 450 deaths per 100,000 females.
Although mortality from respiratory diseases is relatively low compared with cancers and circulatory diseases, the ASMRs have decreased by 54% for males and 41% for females over the period 1983 to 2013. In 2013, there were 178 deaths per 100,000 population for males and 127 deaths per 100,000 population for females from respiratory diseases. Some of the decreases and increases in ASMRs between 1983 and 2001 (see figure 3) are as a result of changes in the rules for coding cause of death to pneumonia.
Over the last 30 years there have been steady declines in the ASMRs for the main three broad causes of death in the UK. The reasons for this include improvements in the treatment and diagnosis of these diseases, and the introduction of preventative programmes, such as NHS Breast screening which was introduced in 19882.
Notes for Deaths by broad disease group
Deaths Registered in England and Wales (Series DR), 2013 http://www.ons.gov.uk/ons/rel/vsob1/mortality-statistics--deaths-registered-in-england-and-wales--series-dr-/2013/stb-deaths-registered-in-england-and-wales-in-2013-by-cause.html#tab-Leading-Causes-of-Death-in-2013
Deaths Registered in England and Wales (Series DR), 2013 http://www.ons.gov.uk/ons/rel/vsob1/mortality-statistics--deaths-registered-in-england-and-wales--series-dr-/2013/stb-deaths-registered-in-england-and-wales-in-2013-by-cause.html#tab-Deaths-and-Mortality-Rates-by-Broad-Disease-Group
6. Deaths by age group
Figure 4: Percentage distribution of all deaths by age group for selected years
UK

Source: Office for National Statistics
Download this image Figure 4: Percentage distribution of all deaths by age group for selected years
.png (17.6 kB) .xls (29.7 kB)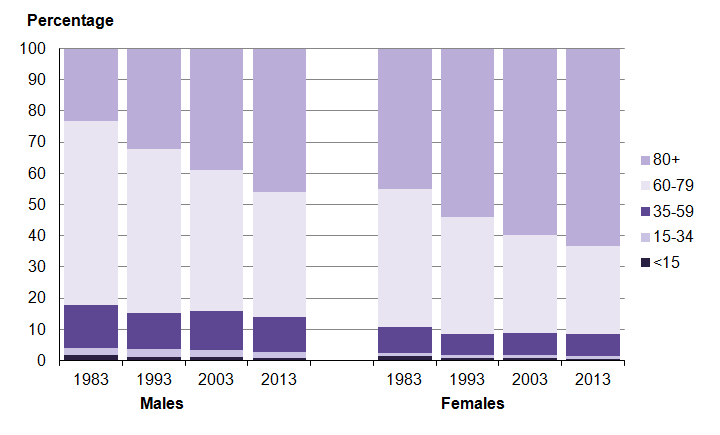
The majority of all deaths registered in 2013 were in the 80+ age group (46% for men and 63% for women). This was a shift from 1983 when the majority of deaths registered for men fell in the 60-79 age group (59% compared with 23% for the 80+ age group). However, for women in 1983 there was little difference between the 60-79 and 80+ age groups (44% and 45% respectively).
The percentage of deaths registered in the 80+ age group for men in 2013 (46%) was very similar to the percentage of deaths registered in the 80+ age group for women 30 years earlier in 1983 (45%).
Over the 30 year period women have consistently had a larger proportion of deaths registered in the 80+ age group than men. However, the difference from 1983 to 2013 shows that the proportion of deaths occurring to men in the 80+ age group increased at a faster rate than it did for women. The proportion of male deaths recorded in the 80+ age group doubled between 1983 and 2013, while only increasing by less than a third for women.
As a contrast the proportions of all deaths that were registered in the younger age groups were small. Deaths at ages below 60 years accounted for just 14% of all male deaths and 9% of all female deaths occurring in 2013.
Mortality rates have improved in all age groups but more recently at a faster rate in the older age groups. This is thought to be because of a combination of factors, such as the improvements in mortality from circulatory diseases, such as heart disease and stroke, partly driven by changing smoking habits1 and the diagnosis and treatment of cancers. The increase in the numbers and proportions of deaths at older ages, particularly at 80+ is due to the increase in the size of the older population. As mortality improves at older ages, larger numbers of people survive to the oldest ages and this contributes to the ageing populations of England, Wales, Scotland and Northern Ireland.
Notes for Deaths by age group
- Murphy M, Di Cesare M, (2012) Use of an age-period-cohort model to reveal the impact of cigarette smoking in trends in twentieth century adult cohort mortality in England and Wales, Population Studies, Vol 66, issue 3.