Cynnwys
- Main points
- Subnational ageing is important to consider as trends can vary considerably between neighbouring local authorities
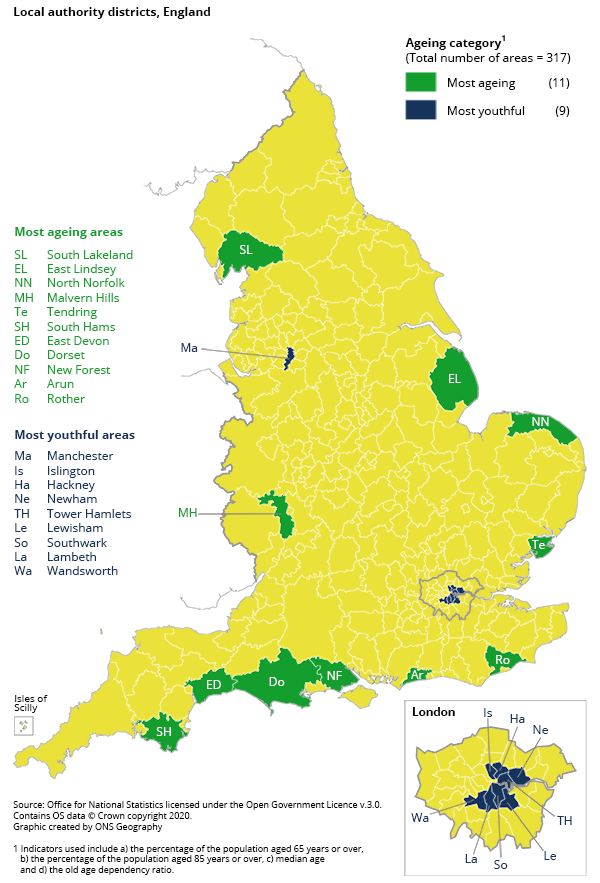
- In the UK, the most ageing local authorities are by the south and east coast; the youngest local authorities are in London
- Generally, older people live near Areas of Outstanding Natural Beauty, National Parks and the coast
- Across the UK, Wales has the oldest population, followed by Scotland, then England and Northern Ireland has the youngest population
- Cities have youthful populations with London boroughs constituting some of the youngest areas in the UK
- Migration of older people is driven by movement away from major cities to rural and coastal areas
- Employment rates for older workers are lower than for younger workers across all UK regions
- Between 2018 and 2043 there is a projected shift in the age structure of local authorities towards older ages across the UK
- Local Government Districts in Northern Ireland projected to see some of the largest increases in average age across the UK
- Greatest increases in the proportion of one-person households containing an older person in rural areas
- Methodology
1. Main points
Whilst national-level ageing trends are important, the subnational ageing tool allows you to uncover how these differ at a local level.
Even neighbouring local authorities can have considerably different ageing profiles, for example, Brighton and Hove, and Lewes.
Older people are more likely to live near AONBs (Areas of Outstanding Natural Beauty), National Parks and the coast; younger people are more likely to live in cities.
Across the UK, Wales has the oldest population, followed by Scotland, then England and Northern Ireland has the youngest population.
Migration of older people is driven by movement away from major cities to rural and coastal areas.
Employment rates for older workers are lower than for younger workers across all UK regions.
The average median age of local authorities in the UK is projected to increase between 2018 and 2043 with some of the greatest increases projected to be in Northern Ireland.
Between 2018 and 2043, rural areas are projected to experience some of the largest increases in the proportion of one-person households containing an older person.
4. Generally, older people live near Areas of Outstanding Natural Beauty, National Parks and the coast
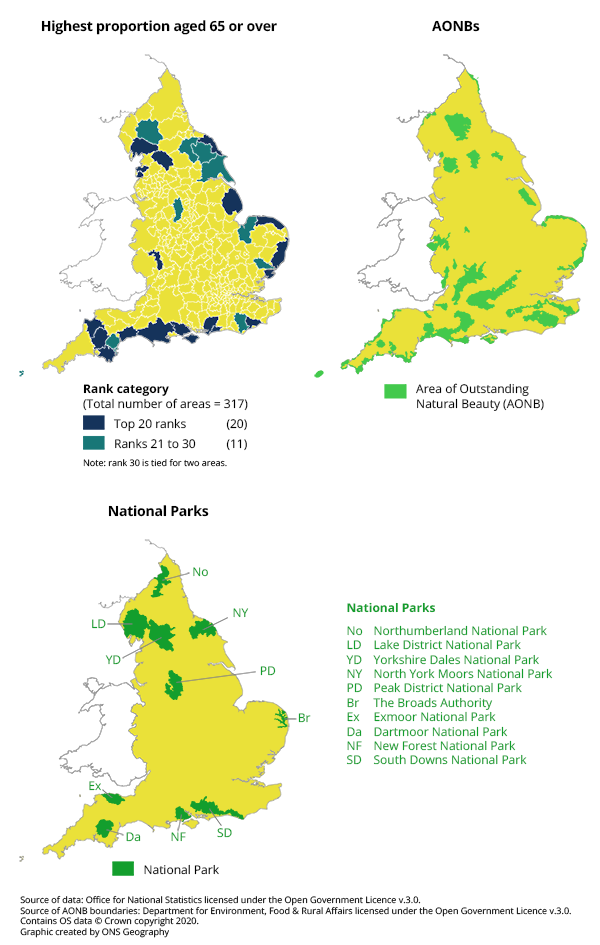
The two most ageing local authorities referenced in Figure 1 but not located on the south or east coasts, are the Malvern Hills and South Lakeland. The first coincides with the Malvern Hills Area of Outstanding Natural Beauty (AONB) and the second with the Lake District National Park, Yorkshire Dales National Park and Arnside and Silverdale AONB.
Higher proportions of older people live in rural areas and by the coast. Using the Department for Environment, Food and Rural Affairs (Defra) Local Authority Rural-Urban Classification1, 47% of local authorities in England are rural2. Of the top 100 ageing local authorities, ranked by percentage aged 65 years and over3, 85% are considered rural.
There is also a tendency for older people to live near National Parks. In England, 19% of local authorities contain a National Park4 but the figure is 40% when looking at the top 100 ageing authorities (ranked by the percentage aged 65 years and over). Of the top 50 and top 20 respectively, 46% and 50% contain a National Park (Figure 2).
Looking more generally at those living within the boundaries of National Parks in England and Wales, these areas have considerably higher median ages and percentages of the population aged 65 years and over than in the countries as a whole. National Parks are also sparsely populated with population densities between 2 and 64 persons per square kilometre, compared with 391 persons per square kilometre across England and Wales. The remote nature of these areas could mean that older persons are required to travel considerable distances to reach essential services.
A similar trend is observed for AONBs. Whilst 35% of English local authorities contain an AONB, 59% of the top 100 ageing authorities, 70% of the top 50 and 85% of the top 20 contain an AONB5 (Figure 2). The three exceptions from the top 20 (Arun, Fylde and Scarborough) are all found by the coast.
Three local authorities that illustrate this pattern of ageing authorities not just appearing by the coasts but also by AONBs and National Parks are the Malvern Hills (see 1 on Figure 2, Malvern Hills AONB), Derbyshire Dales (see 2 on Figure 2, Peak District National Park) and Craven (see 3 on Figure 2, Yorkshire Dales National Park, Forest of Bowland AONB, Nidderdale AONB).
Figure 2: A comparison between the local authority districts with the highest proportions aged 65 years or over and the distribution of Areas of Outstanding Natural Beauty and National Parks in England, 2019
Source: Office for National Statistics licensed under the Open Government Licence v.3.0. Source of AONB boundaries: Department for Environment, Food and Rural Affairs licensed under the Open Government Licence v.3.0 – 2019 mid-year population estimates.
Download this image Figure 2: A comparison between the local authority districts with the highest proportions aged 65 years or over and the distribution of Areas of Outstanding Natural Beauty and National Parks in England, 2019
.png (183.6 kB) .xlsx (20.4 kB)Notes for Generally, older people live near Areas of Outstanding Natural Beauty, National Parks and the coast:
Local authorities containing a National Park have been established by comparing local authority boundaries with National Park boundaries and finding overlap. See Section 12: Methodology.
Local authorities containing an AONB have been established by comparing local authority boundaries with AONB boundaries and finding overlap. See Section 12: Methodology.
5. Across the UK, Wales has the oldest population, followed by Scotland, then England and Northern Ireland has the youngest population
Wales ranks highest in terms of median age, percentages aged 65 years and over, and 85 years and over, and Old Age Dependency Ratio (OADR).
Northern Ireland has the lowest value on all four measures and a median age 3.6 years below that of Wales (Table 2).
Scotland has a higher median age, percentage aged 65 years and over and OADR than England but a lower percentage aged 85 years and over (2.3% compared with 2.5%).
This is supported by a higher life expectancy for both males and females in England compared with Scotland1 with respective life expectancies at birth of 79.6 and 83.2 years in England and 77.1 and 81.1 years in Scotland. Of the four UK countries, England has the highest life expectancy at birth for both males and females and Scotland has the lowest.
This age distribution of UK countries is likely to change with slower ageing projected for Wales than Northern Ireland. Between 2018 and 2043, the percentages aged 65 years and over are projected to grow by 5.4 percentage points in Wales and 7.8 percentage points in Northern Ireland. The already ageing nature of the Welsh population helps explain why future ageing is likely to be slower. Likewise, Northern Ireland has a relatively youthful population and relatively high rates of ageing will bring the country more in line with the rest of the UK.
Northern Ireland has the UK’s highest fertility rate2 but in recent years the rate has dropped3 and is contributing to population ageing. Of the four UK countries, Northern Ireland experienced the strongest growth in those aged 85 years and over between 2008 and 20184 (30.4% compared with 25.0% for Scotland, 22.8% for England and 16.7% for Wales). An increase in the proportion of people living until the oldest ages is also contributing to Northern Ireland’s population ageing.
Wales has a particularly high proportion of older people, which may be linked to the rural nature of much of the country and policies put in place to support an ageing population5. In 2019, Wales experienced a net internal migration influx of 782 persons aged 65 years and over from local authorities in England.
| Indicator | England | Wales | Scotland | Northern Ireland |
|---|---|---|---|---|
| Median age | 40 | 42.5 | 42 | 38.9 |
| % aged 65 years and over | 18.4 | 21 | 19.1 | 16.6 |
| % aged 85 years and over | 2.5 | 2.7 | 2.3 | 2 |
| OADR | 286 | 334 | 289 | 258 |
| Projected change in % 65 and over (2018 to 2043) (ppt) | 5.7 | 5.4 | 6 | 7.8 |
Download this table Table 2: A comparison between measures of ageing for England, Wales, Scotland and Northern Ireland¹ (2019-based data)
.xls .csvNotes for Across the UK, Wales has the oldest population, followed by Scotland, then England and Northern Ireland has the youngest population:
6. Cities have youthful populations with London boroughs constituting some of the youngest areas in the UK
The average percentage of the population aged 65 years and over is considerably lower for cities than other types of local authority. In 2019, 18.5% of the UK population were aged 65 years and over. This figure falls to 15.2% for those living in local authorities containing a city1. For London boroughs the difference was even greater with an average value of 12.1%.
This pattern aligns with the trend of older people moving away from built-up cities to more rural areas for retirement (see Section 7). Greater than 20% of the population are aged 65 years and over in almost half (47%) of local authorities in England. When looking at those classified as Major Urban2, the figure falls to 8% and relates to just six local authorities. These are Sefton (23.6%), Solihull (21.1%), St Helens (20.6%), Dudley (20.4%), North Tyneside (20.3%) and South Tyneside (20.3%). Each of these urban areas lies just outside a major city; Sefton and St Helens near Liverpool, Solihull and Dudley near Birmingham, and North Tyneside and South Tyneside near Newcastle.
Of all the local authorities in the UK, the six with the lowest percentages of those aged 65 years and over are London boroughs (Islington, Southwark, Lambeth, Hackney, Newham and Tower Hamlets). Possible explanations include the high fertility rate in London (around 4.1 times more births than deaths over the last five years3) and the large net internal migration of older persons out of London. In 2019, the net internal migration of those aged 65 years and over out of London was 11,366.
Notes for Cities have youthful populations with London boroughs constituting some of the youngest areas in the UK:
Cities in the UK defined as settlements which have been granted official city status via a charter from the British monarch. See Section 12: Methodology.
7. Migration of older people is driven by movement away from major cities to rural and coastal areas
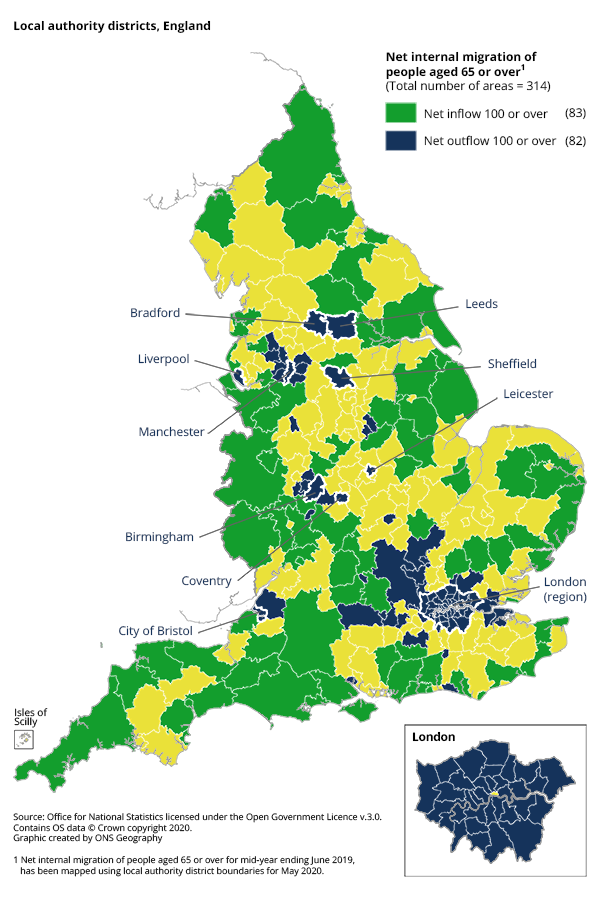
England’s 10 largest cities (Figure 3) saw net outflows of those aged 65 years and over for the mid-year ending June 2019. London saw the most departures (11,366) followed by Birmingham (1,145) and then Bristol (428) and Manchester (427)1.
Of the local authorities in England classified as Major Urban (see Department for Environment, Food and Rural Affairs (Defra) Local Authority Rural-Urban Classification2), 87% experienced net departures of those aged 65 years and over.
Figure 3 shows areas in which at least 100 people aged 65 years and over migrated into or out of the local authority in the mid-year ending June 2019. Blue areas show net outflows and generally align with major cities and commuter areas. Green areas still show inflows and are typically more rural, often by the coast, near Areas of Outstanding Natural Beauty (AONBs) or National Parks and are less connected to major industrial areas.
Figure 3: English local authorities in which net internal migration of those aged 65 years and over was at least 100 people in the mid-year ending June 2019
Source: Office for National Statistics – 2019 mid-year population estimates
Download this image Figure 3: English local authorities in which net internal migration of those aged 65 years and over was at least 100 people in the mid-year ending June 2019
.png (277.9 kB) .xlsx (21.8 kB)Notes for Migration of older people is driven by movement away from major cities to rural and coastal areas:
London is classified as a region. For the other cities, the local authority containing the city, and with the same name, has been used.
8. Employment rates for older workers are lower than for younger workers across all UK regions
Older workers are essential to the government’s Industrial Strategy1. In 2017, there were almost 1 million individuals aged 50 to 64 years who said they were willing to work but were not currently in employment2. By increasing employment rates for older people, the government could potentially fill skills gaps and help address age-based discrimination3 in the workplace. Furthermore, increasing employment amongst older persons would increase retirement incomes and could have health benefits for older people too2.
In 2017, it was estimated that increasing the employment rate of those aged 50 to 64 years to match that of those aged 35 to 49 years would add around £88 billion to the UK economy4.
Employment rate refers to the number of people who are employed, as a proportion of the population considered. The greatest differences between the employment rates of those aged 16 to 49 and 50 to 64 years are found in Northern Ireland and Scotland (Figure 4) with employment rates for older workers decreasing from 74.9% to 63.9% and 77.1% to 69.6% respectively. Differences are smallest for London, Yorkshire and The Humber and the West Midlands. However, the difference in employment rates is relatively consistent across the UK, showing that this is a concern that applies nationally.
Employment rate differences are even greater when comparing with those aged 25 to 49 years, because of the high proportion of those aged 16 to 24 years in full-time education.
Figure 4: A comparison between the employment rates of those aged 16 to 49 years and those aged 50 to 64 years, by region (%)1
Embed code
Notes:
- Figures are based on the period July 2018 to June 2019.
Download this chart
Since 2011, the gap between employment rates of those aged 25 to 49 and 50 to 64 years has narrowed as a result of increasing employment rates for older women. This is in line with the gradual increase in State Pension age for women, from 60 years in 2010 to 65 years in 2020.
The regions with the lowest employment rates for those aged 50 to 64 years are Northern Ireland (63.9%), the North East (67.8%) and Wales (68.7%). These are also the three regions with the lowest average weekly pay in April 2019 with medians of £535, £533 and £535 respectively5.
These figures contrast to the highest median weekly pays of £737 in London, £614 in the South East and £581 in the East of England; regions in which the employment rate for older workers is at least 72%. This may indicate that in areas with weaker economies, the situation can be challenging for older workers.
Notes for Employment rates for older workers are lower than for younger workers across all UK regions:
Employee earnings in the UK: 2019. These figures are median full-time gross weekly earnings.
10. Local Government Districts in Northern Ireland projected to see some of the largest increases in average age across the UK
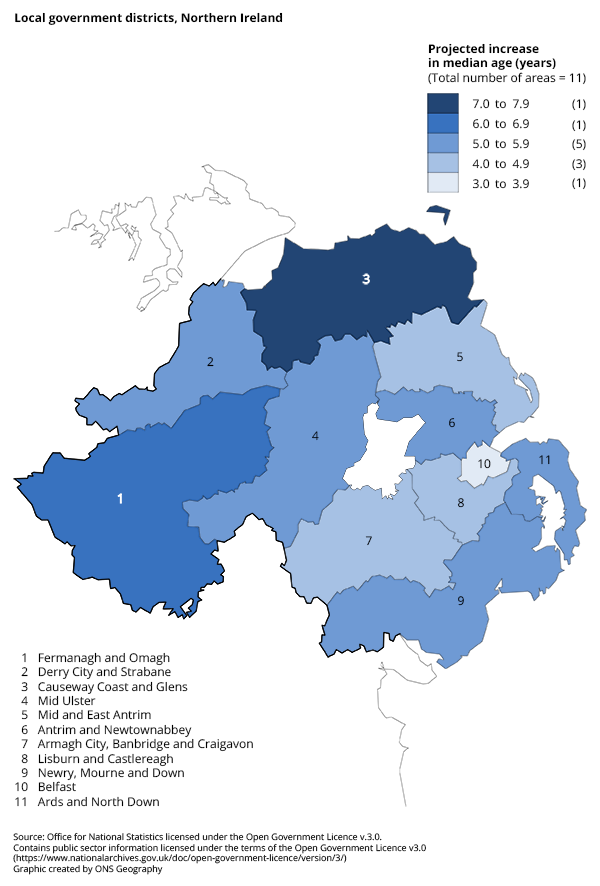
Of the four UK countries, Local Government Districts (LGDs) in Northern Ireland are projected to see the biggest increases in median age with an average increase of 5.5 years. This contrasts with average increases in median age of 3.7 years for local authorities in Scotland and 3.2 years for England1.
Northern Ireland has a younger population and the change will bring the country more in line with the rest of the UK. In 2018, only one LGD (Ards and North Down) fell within the top half of UK local authorities when ranked by percentage aged 65 years and over.
Consistent with the trends noted throughout this article, the smallest increases are projected in the Northern Ireland capital. The Belfast median age is projected to increase from 35.8 to 39.7 years (an increase of 3.9 years). For the rest of the country, the minimum increase projected is 4.3 years.
Figure 6 shows the projected increase in median age between 2018 and 2043 for the 11 LGDs. In general, the greatest increases in median age occur away from Major Urban areas, in less densely populated LGDs.
Figure 6: Projected increase in median age for the 11 Local Government Districts in Northern Ireland, between 2018 and 2043
Source: Northern Ireland Statistics and Research Agency – 2018-based population projections
Download this image Figure 6: Projected increase in median age for the 11 Local Government Districts in Northern Ireland, between 2018 and 2043
.png (123.3 kB) .xlsx (20.5 kB)Notes for Local Government Districts in Northern Ireland projected to see some of the largest increases in average age across the UK:
- A figure is not presented for Wales as subnational population projections are not currently available for this country. Previous published figures suggest the median increase for local authorities in Wales will not exceed that of LGDs in Northern Ireland.
11. Greatest increases in the proportion of one-person households containing an older person in rural areas
The percentage of one-person households in England containing someone aged 65 years and over is projected to increase from 42.2% in 2018 to 50.4%1 in 2043. From 2041, there are projected to be more people living alone aged 65 years and over than under 65 years and much of this projected growth will be driven by an increase in those aged 85 years and over living alone.
Amongst those aged 85 years and over, there will be larger increases in the absolute number of older females living alone than males living alone. That said, the percentage increase in the number of older male one-person households (115% for England) is projected to be larger than for females (70% for England), because of the smaller initial numbers of male one-person households in 2018 (Table 3).
| 2018 | 2043 | Increase 2018 to 2043 | |||||
|---|---|---|---|---|---|---|---|
| Country | Gender | Percentage | Number | Percentage | Number | Percentage | Number |
| England | Male | 5.2 | 181,091 | 9.3 | 390,010 | 115.4 | 208,919 |
| Female | 12.7 | 470,553 | 17.1 | 801,539 | 70.3 | 330,986 | |
Download this table Table 3: Projected percentage of one-person households in England containing someone aged 85 years and over
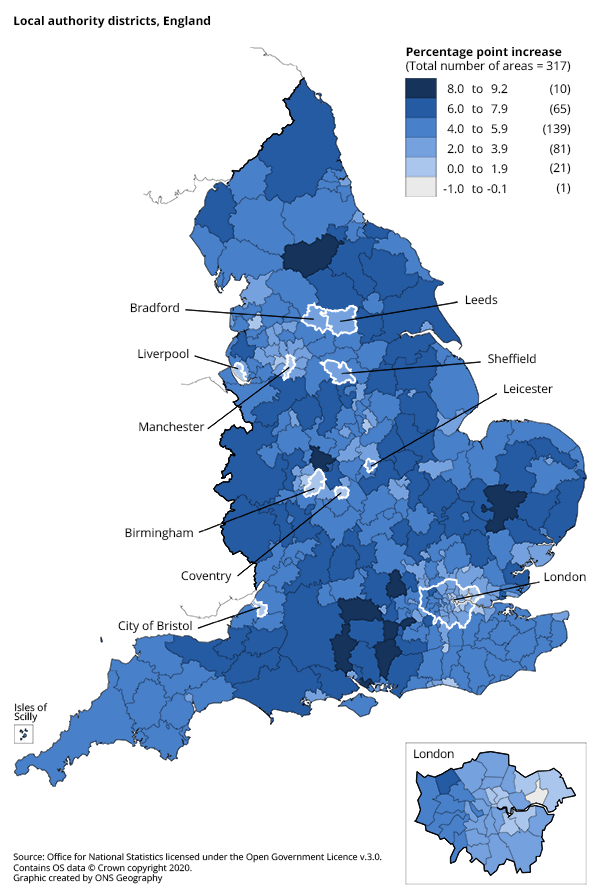
.xls .csvIf local authorities are ranked by those projected to see the largest percentage point increases in those aged 85 years and over living alone, the majority of the top 50 (82%) are rural2, only one is classified as a Major Urban area (Harrow) and only three are classified as Large Urban areas. These are Castle Point, Fareham and Wokingham (Figure 7).
In general, local authorities with the highest proportions of one-person households containing someone aged 85 years and over in 2018 are projected to have the highest proportions in 2043. This indicates that areas with a relatively high proportion of one-person households containing an older person today, will still have relatively high proportions 23 years from now.
Figure 7: Percentage point increase in the proportion of one-person households with a householder aged 85 years or over, between 2018 and 2043
England
Source: Office for National Statistics licensed under the Open Government Licence v.3.0 – 2018-based population projections.
Download this image Figure 7: Percentage point increase in the proportion of one-person households with a householder aged 85 years or over, between 2018 and 2043
.png (251.4 kB) .xlsx (36.7 kB)There are 10 local authorities projected to see increases in the proportion of one-person households containing someone aged 85 years and over of at least 8 percentage points. These are Richmondshire, East Hampshire, Hart, Lichfield, Surrey Heath, West Berkshire, West Suffolk, Wycombe, Fareham and Test Valley (dark blue areas Figure 7). Of these, eight are rural areas, not by the coast. The other two are urban areas in close proximity to much larger urban areas (Fareham is near Portsmouth and Southampton, and Surrey Heath is near London).
There are 21 local authorities projected to see increases in proportion of less than 2 percentage points and Barking and Dagenham has a projected decrease of 1 percentage point (light blue and grey areas Figure 7). All 22 of these areas are urban and 15 are classified as Major Urban3, indicating that cities and large towns are expected to see the smallest increases in one-person households containing an older person. This trend aligns with the pattern for internal migration of older people leaving cities for rural areas.
However, this trend should be viewed in combination with the fact that older people form a large proportion of projected increases in one-person households across all age groups. As a result, even in cities where proportional increases are smaller, older people are still likely to make up an important part of changes in general household structure.
Notes for Greatest increases in the proportion of one-person households containing an older person in rural areas:
This figure is a projection from 2018-based household estimates.
12. Methodology
Top 100 ageing local authorities in England when ranked by percentage aged 65 years and over
The 314 local authorities in England are ranked according to the percentage of the population in the local authority aged 65 years and over. The local authority with the highest percentage comes first and the top 100 ageing authorities are the 100 authorities with the highest percentages aged 65 years and over.
When ranked by percentage aged 65 years and over, three authorities are joint 100th. All three have been included in the calculations and so the denominator for the calculation is 102.
Local authorities containing a National Park or Area of Outstanding Natural Beauty
The boundaries for the 314 local authorities in England have been compared with the boundaries of the 10 English National Parks and 34 Areas of Outstanding Natural Beauty (AONBs). For all cases where an overlap has been found between local authority boundaries and a National Park, the local authority is considered to contain a National Park. Where overlap is found between a local authority and an AONB, the local authority is considered to contain an AONB.
Rural-Urban Classification of local authorities
The 2011 Department for Environment, Food and Rural Affairs (Defra) Local Authority Rural-Urban Classification categorises local authorities in England into Major Urban, Large Urban, Other Urban, Significant Rural, Rural-50 and Rural-80. For a general rural-urban classification, local authorities categorised as Major Urban, Large Urban or Other Urban are considered urban and local authorities categorised as Significant Rural, Rural-50 or Rural-80 are categorised as rural.
Since the classification was published in 2011, boundary changes have taken place involving the merging of local authorities to produce a smaller number of larger authorities. In cases where this has taken place, the most urban classification of the constituent authorities has been used. For example, on 1 April 2019 East Suffolk formed from the merger of Suffolk Coastal and Waveney local authorities. Because these were classified as Rural-80 and Significant Rural respectively, East Suffolk has been classified as Significant Rural.
Local authorities containing a city
The definition of a city can be variable and so for the purposes of this release, cities have been included if they have been granted official city status via a charter from the British monarch. Each city has then been assigned to its corresponding local authority for the purposes of this analysis. For example, the local authority corresponding to "Birmingham" is "Birmingham" and the local authority corresponding to "Bath" is "Bath and North East Somerset".
The region of London has been classified as a city and its constituent London boroughs have been excluded from calculations. Although sometimes classified separately as a city, Westminster has been included as part of London for this analysis.
Nôl i'r tabl cynnwys
