Correction
19 September 2023
We have corrected an error under the heading 'Centenarians over time', which also appeared in the 'Main points'. The previous version read "However, in 2021, centenarians still only represented 0.2% of the total population". It should have read "However, in 2021, centenarians still only represented 0.02% of the total population".
This happened because of human error.
We apologise for any misunderstanding caused.
Main points
Over the past century, the number of centenarians living in England and Wales has increased 127-fold, reaching 13,924 in 2021; however, centenarians still only represent 0.02% of the total population.
Male centenarians in 2021 had outlived their life expectancy at birth by four decades and female centenarians by three decades.
Two in five centenarians lived alone; one in five lived in private households with other people; the remaining two in five lived in a communal establishment.
A higher proportion of male centenarians were married than female centenarians; this is because of the longer life expectancy of females and because men, on average, marry women slightly younger than themselves.
A quarter of centenarians reported having good or very good health and almost a third were non-disabled.
The three local authorities (LA) with the highest proportion of centenarians were on the south coast.
The UK ranks as the seventh country worldwide for highest number of centenarians, and ninth once population size is taken into account.
Centenarians over time
A centenarian is a person aged 100 years or over.
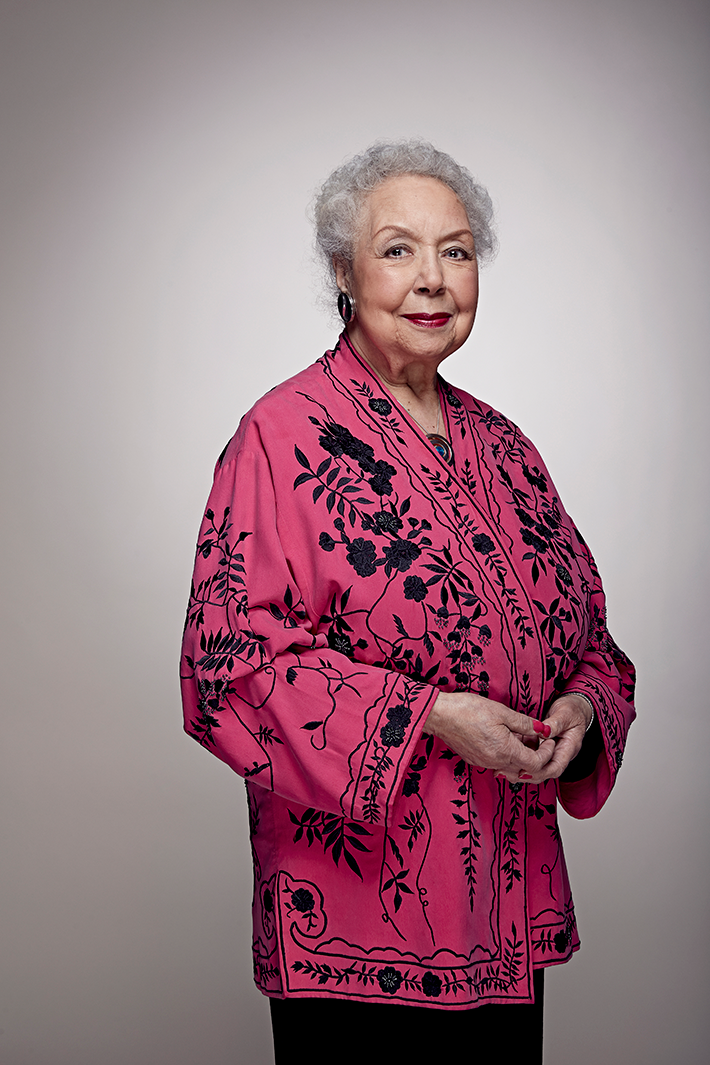
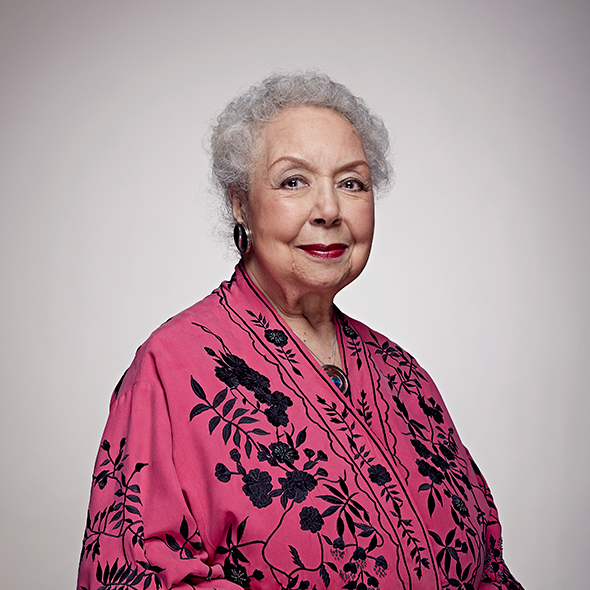
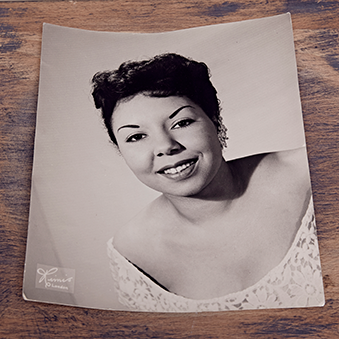
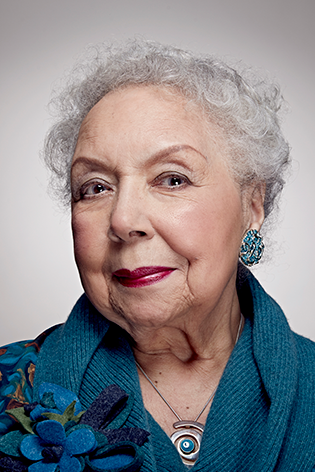
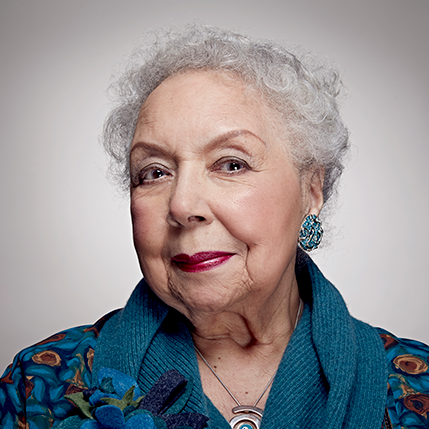
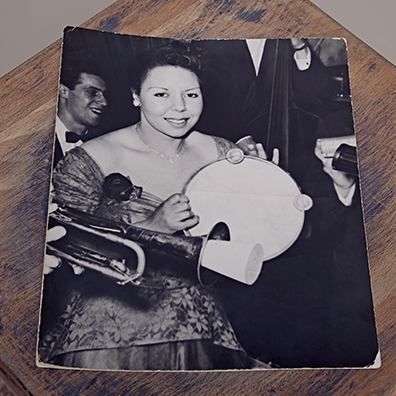
Lauretta Boston from London celebrated her milestone 100th birthday in October 2022. She spoke to the Office for National Statistics (ONS) about her life and experience of being a centenarian living in England.
You never think you’re going to reach that age. Even a few months before, I was wondering if I was going to reach 100 because there is always something that goes wrong health-wise.
On Census Day in 2021, there were 13,924 centenarians living in England and Wales, a 24.5% increase from 2011. This is the highest number of centenarians recorded in an England and Wales census. The number of people living to age 100 has increased over time as life expectancy has improved. Since 1921, the number of centenarians in the population has risen from 110, a 127-fold increase. However, in 2021, centenarians still only represented 0.02% of the total population.
Figure 1: The number of centenarians in the population increased rapidly from the second half of the 20th century
Number of people aged 100 years and over, 1921 to 2021, England and Wales
Embed code
Notes:
- No census was taken in 1941 because of the Second World War.
Download the data
From 1921 to 1961, the number of centenarians in the population rose very gradually, but from that point the rate of increase was rapid. The main reason for the rise was improvements in mortality rates, particularly at older ages, that occurred in the second half of the 20th century. This is, in part, because of advances in healthcare and public health measures, which led to improved air quality and working conditions. Birth cohort sizes will also have had some influence on the number of centenarians over time. Read more about birth cohorts in our Births in England and Wales: 2022 bulletin.
Historically, there have always been more female centenarians than males because of higher life expectancy for females. This remained true in 2021, with a sex ratio of 23 males per 100 females. There was a total of 11,288 female and 2,636 male centenarians in England and Wales on Census Day 2021.
Although the ages of centenarians living in England and Wales ranged from 100 to 112, over 90% were aged between 100 and 103 years, with the average (mean) age being 101 years, 1 month and 2 weeks. Around the time of birth of these centenarians in 1921, life expectancy was 67.9 years for females and 61.2 years for males, according to our Life tables, principal projection, England and Wales dataset. This cohort have outlived their life expectancy by an average of 32 years for females and 39 years for males.
In contrast, for babies born in 2021, their life expectancy at birth is projected to be 90.5 years for females and 87.6 years for males. For these babies, 19.6% of females and 14.1% of males can expect to live to become a centenarian. The life expectancy figures refer to cohort life tables, which include projected data that take into account improvements in mortality over the last 100 years.
Embed code
The timeline shows some of the major events that these centenarians have experienced throughout their lives.
Lauretta recalled events she saw living in London like watching gas lights being lit in the streets, celebrating Empire Day with little flags at school, seeing neighbours getting into debt after the great depression, watching the Oxford-Cambridge boat race on a television in a shop window when no one had a television at home, and going to the Post Office to make a phone call in a cubicle through an operator.
"After the war, there were clothes coupons, because clothing was still rationed. I saw people wounded during the war on the street selling matches and they maybe had just one arm or a crutch under the arm and just one leg. They weren't allowed to beg, but in actual fact people put the money on the tray but didn't take the matches."
Where centenarians were living
In England and Wales, there were 23 centenarians per 100,000 population on Census Day 2021. The proportion was the same for England alone, which had a total of 13,124 in this age group. Wales had a higher proportion, at 25 centenarians per 100,000, a total of 800 in this age group.
At local authority (LA) level, 159 LAs had a higher number of centenarians per 100,000 population than the overall England and Wales figure. Figure 3 shows the distribution of centenarians across LAs in England and Wales.
Figure 3: Coastal areas had the highest proportions of centenarians in their populations
Number of centenarians per 100,000 population by local authority, 2021, England and Wales
Embed code
Download the data
The three LAs with the highest number of centenarians per 100,000 population were East Devon, Arun, and New Forest (64, 59, 57 per 100,000, respectively). These LAs are all on the south coast of England. Of the top 10 LAs with the higher number of centenarians per 100,000 population, nine were in coastal areas. Our Census maps interactive tool can be used to see the distribution of other age groups by LA.
Relatively high numbers of centenarians live in LAs containing large cities because of their larger populations. For example, Birmingham has the highest number of centenarians overall at 193. However, there were only 17 centenarians per 100,000 people. Of the eight LAs with the lowest number of centenarians per 100,000 population (fewer than 10), six were London boroughs. The other two were Knowsley and Crawley, both with nine centenarians per 100,000 population.
Lauretta describes herself as "a town person". She has lived in London all of her life.
"People used to dress up to go into town to go down Bond Street. I would add accessories to my clothes like collars and cuffs and you wouldn't go out in the summer without your little gloves on. Fashion is still important to me.
"Working class people actually ate better in those days because we had no fridges, so the food was fresh every day. We would get fish from the market. A woman a few doors down had a little horse and cart, and she got fruit and vegetables from Covent Garden and sold it fresh."
Who centenarians were living with
Most centenarians living in England and Wales in 2021 resided in private households.
Figure 4: Similar proportions of centenarians lived in a communal establishment and lived alone
Percent of those aged 100 years and over by communal establishment residence and household size of private households, 2021, England and Wales
Embed code
Download the data
Two-fifths of centenarians (39.1%) lived in communal establishments, with the majority of these living in a care home (96.8%).
Two-fifths (41.6%) live alone in private households, with a further fifth (19.3%) living with other people in a household, half of these living in a two-person household.
Most centenarians living in two or more person households were living with relatives:
65.8% with their child or stepchild
17.6% with their spouse
15.4% with grandchildren
32.2% with other relatives
10.7% with someone who is not related to them
Please note that percentages do not sum to 100%, as respondents could live with more than one relative.
Figure 5: Most centenarians were widowed
Legal partnership status of those aged 100 years and over by sex, 2021, England and Wales
Embed code
Download the data
Although both male and female centenarians were more likely to be widowed than of any other marital status, female centenarians were more likely to be widowed than male centenarians and less likely to be married; 18.4% of males were married, compared with only 3.7% of females. Of those centenarians who were married or in a civil partnership, only 2.4% in total were in same-sex marriages or same-sex civil partnerships. Females were more likely to be widowed as they have higher life expectancies, and therefore were more likely to outlive their spouse. According to our People's living arrangements in England and Wales article, males were also more likely to marry women slightly younger than themselves and so were more likely to have a living spouse.
There was a total of 905 married or civil-partnered centenarians on Census Day 2021; 64.3% of these married centenarians were living in a private household. However, they were not necessarily living with their spouse, as their spouse may have been living in a communal establishment. There were 471 centenarians living in the same household as their spouse in England and Wales. Most of these centenarians were living with a spouse aged less than 100 years. However, there were 14 centenarian couples living together in a private household. Data were not available on centenarian couples in communal establishments.
Lauretta was married at the age of 18 years, but now lives on her own.
"I live alone, but I never get lonely. I never seem to have enough time, because everything is a big effort and I'm so slow. It takes me time to do everything, so the days seem short. I also have my music and my family and friends.
"My sister is 94 and I have had friends who also lived a long time. Two of them lived to 90 and one to 102, but unfortunately they have passed on. That's what happens. Friends I have made more recently don't know me as well as friends I knew when I was young. They can be very good friends but can only really see you as you are now."
I always think it would be a good idea if people living in nursing homes had a picture of themselves when they were younger and at their best so they can look at themselves and remember how they really are and not what everyone sees as just someone old. I am still the same person I was back then.
Centenarian health and disability
A quarter of centenarians reported having good or very good general health. Half of this age group report having fair health, while the remaining quarter report living with bad or very bad health. Surprisingly, 3 in 10 centenarians reported having no disability. However, of disabled centenarians, 80.1% were limited a lot in their day-to-day activities. Male centenarians were more likely to be non-disabled than females and were also more likely to report having good or very good health.
Poorer health in later life is likely to affect people's residence type and living situation.
Figure 6: Centenarians living alone were the most likely to be in very good or good health
General health of those aged 100 years and over by residence type and household size, 2021, England and Wales
Embed code
Download the data
Those living alone in a private household were the most likely to be in very good or good health (29.1%) and to report having no disability (41.4%). Those living in communal establishments were the least likely to be in good or very good health (20.0%) but were equally as likely as those living with others in a private household to be in bad or very bad health. They were also the most likely to be disabled and limited a lot (66.1%).
While many centenarians report being in good health, Lauretta is living with some health issues.
There is always something wrong but I feel that as long as you're mentally healthy, you can cope with most things and organise yourself. I deal with one thing at a time and make myself look good. If you look in the mirror and feel and look dreadful, that makes you feel down. If I don't look too bad, it makes me feel better.
"There are things I find difficult to do because I am lumbered with a body that won't do what I want it to do. Where I live, I have plenty of stairs so even if I don't go out, I'm active. I have a carer who comes in to help me. I cook my own meals, but she sometimes prepares food for me to cook.
"I have a little shopping trolley I can take to the shops and it's nice to pick out what I want and go to the till. Sometimes I have to go in the wheelchair and when I go to the counter to pay, people tend to talk to the person that's pushing you, not you. They assume I'm old and senile. It's very annoying when you're the person who is paying and doing the shopping. If I'm standing, people talk to me person to person."
Ethnic group and country of birth
Ethnic group
Here, we focus on the five high level ethnic groups people identify with, as set out in our Ethnic group by age and sex, England and Wales: Census 2021 article.
In 2021, 95.8% of the population aged 100 years and over living in England and Wales identified in the "White" ethnic group, 2.1% identified in the "Asian, Asian British, Asian Welsh" ethnic group, and 1.1% in the "Black, Black British, Black Welsh, Caribbean, or African" ethnic group. The remaining 1.0% of people aged 100 years and over identified in the "Mixed or Multiple ethnic groups" or "Other ethnic groups".
Country of birth
In 2021, 91.8% of the population aged 100 years and over living in England and Wales were born in the UK compared with 83.2% of the population as a whole. Of centenarians living in England and Wales in 2021, 1.3% were born in Ireland and 2.4% were born in another European country. A further 2.5% were born in the Middle East and Asia, 1.2% were born in The Americas and the Caribbean, 0.7% were born in Africa and 0.2% born in Antartica and Oceania (including Australasia).
For more information, see our International migration, England and Wales: Census 2021 bulletin.
Occupations and industry of centenarians’ last occupation
In Census 2021, National Statistics Socio-Economic Classification (NS-SEC) groupings, previous occupations, and former industries of centenarians only represent those of the cohort who survived to age 100 years. Therefore, they may not be representative of the type of work this cohort did when they were of working age.
Figure 7: Female centenarians were around twice as likely to have never worked than males
National Statistics Socio-Economic Classification (NS-SEC) of those aged 100 years and over by sex, 2021, England and Wales
Embed code
Download the data
In 2021, 28.0% of female and 13.8% of male centenarians reported they had never previously worked. This was the most common NS-SEC group for female centenarians, as women were less likely to work in the past. For example, in 1951, the female economic activity rate was 34.7%, as set out in the 'Royal Statistical Society's' British Labour Statistics: Historical Abstract 1886 – 1968 article. Similar proportions of females were likely to have been in intermediate, semi-routine and routine occupations. For those who had previously worked, males had a more even spread of occupational types with a higher proportion than females in most NS-SEC groups.
Figure 8: The most common previous occupation for male centenarians was skilled trades
Former occupation of those aged 100 years and over who had previously worked by sex, 2021, England and Wales
Embed code
Download the data
A centenarian's last main job has been classified using the 2020 version of the Standard Occupational Classification and is the nearest equivalent to their job in the current economy.
For formerly employed female centenarians, their most common former occupation was administrative and secretarial occupations (25.9%). For male centenarians, the most common previous occupations were skilled trade occupations (21.9%).
Formerly employed females were more likely than males to have previously worked in:
administrative and secretarial occupations
caring, leisure and other service occupations
sales and customer service occupations
elementary occupations
Males were more likely than females to have been formerly employed:
as managers, directors and senior officials
in professional occupations
in associate professional and technical occupations
in skilled trades occupations
as process, plant and machinery operatives
Figure 9: Manufacturing was a common former industry for both male and female centenarians
Former industry of those aged 100 years and over who had previously worked by sex, 2021, England and Wales
Embed code
Notes:
- Percentages may not sum to 100% because of rounding.
Download the data
Of those who were formerly employed, the most common former industry for female centenarians was wholesale and retail trade; repair of motor vehicles (21.1%). Formerly employed males were most likely to have previously worked in the manufacturing industry (20.8%). However, this was also the second most common industry for females (14.1%). Manufacturing was the most common sector of employment during these centenarians' working lives, contributing up to 29.0% of employment in 1948 to 1959. Read more about this in our Long-term trends in UK employment: 1861 to 2018 compendium.
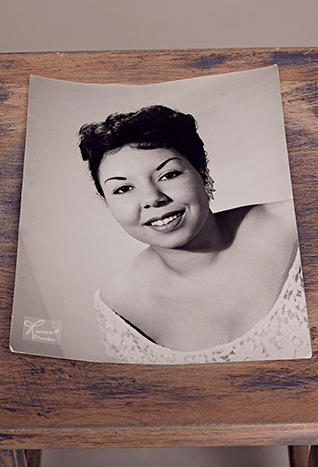
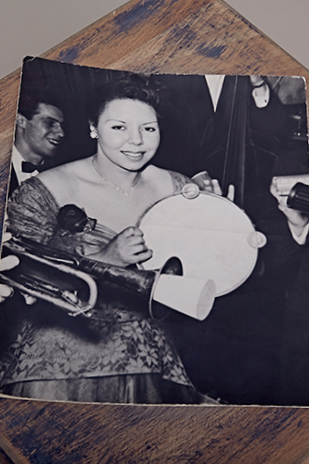
Lauretta left school aged 14 years, which was the school leaving age at that time. She worked in the entertainment industry as a jazz musician. She first performed in public on her 7th birthday and said music has played an important role throughout her whole life.
I've met lots of nice people through music. I was about 17 when the war started. Everybody had to do some war work so I went to entertain the troops and was in a different town each week and a different place each day. When the war finished, I went to Germany for a while and entertained American troops. Then I worked in Dublin before coming back to work in London. Music has been my life.
Health in later life may have been affected by the type of work these centenarians did while they were of working age. However, we can only look at the health status of those who have survived to age 100 years.
Health in general differs across NS-SEC (National Statistics Socio-economic Classification), as shown in our General health by NS-SEC dataset. Centenarians previously in professional, managerial, and supervisory occupations were more likely to have good or very good health. Meanwhile, those in lower technical, semi-routine and routine occupations and those who have never worked were more likely to report bad or very bad health.
Figure 10: Centenarians who previously worked in managerial or professional occupations had the best health
General health by former occupation of those aged 100 years and over, 2021, England and Wales
Embed code
Notes:
- Percentages may not sum to 100% because of rounding.
- Former occupation is an individual’s last main job and may not reflect their occupation for their whole working life.
Download the data
Centenarians who previously worked as managers, directors, and senior officials in professional, associate professional and technical occupations were more likely to report having good or very good health in general compared with those who previously worked in other occupations. Centenarians who were previously process, plant and machine operatives and worked in elementary occupations were the least likely to have very good or good health in the 2021 census, at 18.6% and 20.8%, respectively.
International centenarians
Analysis of international population estimates from the United Nations (UN) World Population Prospects 2022 gives an estimated 593,166 centenarians worldwide in 2021, 7 per 100,000 population.
Overall, the UK ranks as the 7th country worldwide for highest number of centenarians and 9th for number of centenarians per 100,000 population.
Japan ranks first both in terms of the highest estimated number of centenarians and the highest per 100,000 population.
Figure 11: The UK ranks among the top 10 countries worldwide for number of centenarians per 100,000 population
Number of centenarians per 100,000 population by highest ranked countries worldwide, 2021
Embed code
Notes:
- Countries with a total population of fewer than 200,000 have been excluded from this analysis.
Download the data
There were 26 countries with no estimated centenarians. Of these, 21 were island countries with an estimated total population of fewer than 200,000. The remaining five countries were in Africa.
Worldwide, females tend to have longer life expectancies than males, so there were higher numbers of female centenarians than males. According to the United Nations (UN) World Population Prospects 2022, there were 21 countries that had no male centenarians in 2021. However, there were six countries in which there were more male centenarians than females. These were:
Equatorial Guinea
Western Sahara
Maldives
Nepal
Gabon
Papua New Guinea
There are international "hotspots of longevity" within countries researched by National Geographic and called "Blue zones". These are specific areas in which there are high proportions of centenarians in the population and whose population also experiences good health in old age. These are:
Ikaria, a Greek island
Okinawa, a Japanese island
the Ogliastra region in Sardinia, an Italian Island
Loma Linda, a city in California, USA
the Nicoya peninsula in Costa Rica
For more information on "Blue Zones", see the Max Planck Institute's What are Blue Zones? article.
With thanks to Age UK for the photographs and arranging the interview with Lauretta.
Census 2021 age data
Relationship of those aged 100 years and over (centenarians) to household members, England and Wales, 2021
Dataset | Released 18 September 2023
This dataset provides Census 2021 estimates that classify usual residents aged 100 years and over living with others in a private household in England and Wales by relationship. The estimates are as at Census Day, 21 March 2021.
Age and sex
Census custom dataset tool | Released 28 March 2023
This dataset provides Census 2021 estimates that classify all usual residents in England and Wales by age and sex. The estimates are as at Census Day, 21 March 2021.
Age and marital and civil partnership status
Census custom dataset tool | Released 28 March 2023
This dataset provides Census 2021 estimates that classify all usual residents in England and Wales by age and marital and civil partnership status. The estimates are as at Census Day, 21 March 2021.
Age, disability – equality act disabled and sex
Census custom dataset tool | Released 28 March 2023
This dataset provides Census 2021 estimates that classify all usual residents in England and Wales by age, disability – equality act disabled and sex. The estimates are as at Census Day, 21 March 2021.
Age and country of birth
Census custom dataset tool | Released 28 March 2023
This dataset provides Census 2021 estimates that classify all usual residents in England and Wales by age and country of birth. The estimates are as at Census Day, 21 March 2021.
Age and ethnic group
Census custom dataset tool | Released 28 March 2023
This dataset provides Census 2021 estimates that classify all usual residents in England and Wales by age and ethnic group. The estimates are as at Census Day, 21 March 2021.
Glossary
Usual resident
A usual resident is anyone who, on Census Day, 21 March 2021, was in the UK and had stayed or intended to stay in the UK for a period of 12 months or more or had a permanent UK address and was outside the UK and intended to be outside the UK for less than 12 months.
General health
A person's assessment of the general state of their health from very good to very bad. This assessment is not based on a person's health over any specified period of time.
Disability
In Census 2021, people who assessed their day-to-day activities as limited by long-term physical or mental health conditions or illnesses were considered disabled. This definition of a disabled person meets the Government Statistical Service harmonised standard for measuring disability, and is in line with the Equality Act (2010). This requires that a person has a physical or mental impairment, and that the impairment has a substantial and long-term adverse effect on a person's ability to carry out day-to-day activities. Therefore, people reporting conditions that limited their day-to-day activities a little or a lot were classified as disabled.
People who had no long-term physical or mental health conditions, or who had conditions that did not limit their day-to-day activities, were classified as non-disabled. Details on changes to questions between 2001, 2011, and 2021 are given in Section 11: Question change of our Disability by age, sex and deprivation, England and Wales: Census 2021 article.
Census Day
Census 2021 was conducted on 21 March. At this time, coronavirus (COVID-19) pandemic lockdown restrictions were still in place in England and Wales. The coronavirus pandemic may have affected estimates of disability prevalence and general health because of changes in people's perceptions and increased death rates during this period (see our Updated estimates of coronavirus (COVID-19) related deaths by disability status article).
Ethnic group and high level ethnic group
The ethnic group that the person completing the census feels they belong to. This could be based on their culture, family background, identity, or physical appearance.
Respondents could choose 1 out of 19 tick-box response categories, including write-in response options. High level ethnic group refers to the first stage of the two-stage ethnic group question. In the first stage the respondent identifies as one of the following options:
Asian, Asian British, Asian Welsh
Black, Black British, Black Welsh, Caribbean or African
Mixed or Multiple
White
Other ethnic group
Household
A household is defined as one person living alone or a group of people (not necessarily related) living at the same address who share cooking facilities and share a living room, sitting room, or dining area.
This includes all sheltered accommodation units in an establishment (irrespective of whether there are other communal facilities), and all people living in caravans on any type of site that is their usual residence. This includes anyone who has no other usual residence elsewhere in the UK.
A household must contain at least one person whose place of usual residence is at the address. A group of short-term residents living together is not classified as a household, and neither is a group of people at an address where only visitors are staying.
Legal partnership status
Legal partnership status classifies a person according to their legal marital or registered civil partnership status on Census Day, 21 March 2021. It is the same as the 2011 Census variable "Marital status", but has been updated for Census 2021 to reflect the Civil Partnerships, Marriages and Deaths (Registration etc) Act 2019, which made provision for the extension of civil partnerships to couples who are not of the same sex.
In Census 2021 results, "single" refers only to someone who has never been married or in a registered civil partnership.
Sex
This is the sex recorded by the person completing the census. The options were "Female" and "Male".
Economic activity rate
The economic activity rate is the proportion of working age adults who are economically active (either employed or unemployed) during the period referred to. People aged 16 years and over were economically active if, in the period referred to, they were:
in employment (an employee or self-employed)
unemployed, but looking for work and could start within two weeks
unemployed, but waiting to start a job that had been offered and accepted
Previous occupation
Entry routes to many occupations have changed substantially over the past 100 years, with many occupations in the past having few formal qualification requirements and many people advancing through experience and on-the-job training. The occupations are based on their current entry route, so reflect that many occupations now have formal qualifications to be employed in them (for example, nurses and teachers have had this change), and as such may not reflect the qualifications that were needed at the time they were employed in that occupation.
For a full glossary of terms, please see our Census 2021 dictionary.
Data sources and quality
Reference date
The census provides estimates of the characteristics of all people and households in England and Wales on Census Day, 21 March 2021. It is carried out every 10 years and provides the most accurate estimate of all the people and households in England and Wales.
We are responsible for carrying out the census in England and Wales, but will also release outputs for the UK in partnership with the Welsh Government, the National Records of Scotland (NRS), and the Northern Ireland Statistics and Research Agency (NISRA). The census in Northern Ireland was also conducted on 21 March 2021, whereas Scotland's census was moved to 20 March 2022. All UK census offices are working closely together to understand how this difference in reference dates will affect the UK-wide population and housing statistics in terms of both timing and scope.
Response rate
The person response rate is the number of usual residents for whom individual details were provided on a returned questionnaire, divided by the estimated usual resident population.
The person response rate for Census 2021 was 97% of the usual resident population of England and Wales and over 88% in all local authorities (LA). Most returns (89%) were received online. The response rate exceeded our target of 94% overall and 80% in all LAs.
Read more about question-specific response rates at LA level in Section 4 of our Measures showing the quality of Census 2021 estimates methodology.
Quality
The census provides the most detailed picture of the entire population, with the same core questions asked to everybody across England and Wales. Census results can be more reliable than survey results based on a sample of the population, because the whole population is included. The UK Statistics Authority has assigned National Statistics status to Census 2021 outputs, providing assurance that these statistics are of the highest quality and value to users.
Census 2021 achieved a very high response rate of 97%. We ensure the census results reflect the whole population by using statistical methods to estimate the number and characteristics of people who were not recorded on a census response. This means that the census statistics are estimates, rather than simple counts of responses, so they have some statistical uncertainty associated with them. We take steps to minimise possible sources of error.
Additionally, we apply statistical disclosure control to protect the confidentiality of census respondents. Differences in the methods used for statistical disclosure control may result in minor differences in data totals between census products. Quality considerations, along with the strengths and limitations of Census 2021 more generally, are provided in our Quality and methodology information (QMI) for Census 2021.
Further information on our quality assurance processes is provided in our Maximising the quality of Census 2021 population estimates report.
Cite this article
Office for National Statistics (ONS), released 18 September 2023, ONS website, article, Centenarians living in England and Wales in 2021