1. Overview
In recent years, Structural Equation Modelling (SEM) has been used as a tool to quantify measurement error of multiple data sources. The current application is a way to investigate if this is a method that could be used at the Office for National Statistics (ONS) for administrative data.
In this case study of SEM, we investigated the measurement error of floor area measured by two different administrative data sources, Valuation Office Agency (VOA) and Energy Performance Certificate (EPC) data. Since the national dataset was too large to run in R, we generated a covariance matrix to use as input for the SEM.
Our model showed that the national-level results for the VOA floor area tended to have less measurement error than the EPC floor area. This was the same at local authority (LA) level apart from eight London LAs and four rural LAs.
Future research could investigate what drives these differences in results, but our initial investigation into the characteristics of those LAs showed that the London LAs had a high proportion of small apartments, or a very small count of properties. This finding is in line with new research by the Social Statistics Admin First Housing team in the Developing admin-based floor area statistics for England and Wales: 2021 article, where measurement error would affect the prediction of smaller properties. This method can also be used for more complex models with several latent constructs and more co-variates if available.
Nôl i'r tabl cynnwys2. Background
As a result of increasing use of administrative data sources in official statistics, there is a need to test and develop new methods to determine the quality of these data sources. Structural equation modelling (SEM) is a useful technique for estimating measurement error where there are multiple data sources, each including a variable which measures the same (or nearly identical) concept.
In the case of continuous data, SEM can be seen as a combination of linear regression analysis and factor analysis where latent variables are constructed, and the relationships between observed variables are measured. SEMs are a broad and flexible class of models and include latent class models, latent growth models and confirmatory factor analysis. Through estimating a latent (endogenous) variable, the measurement errors of the measured (exogenous) variables used as the different indicators can be quantified. This is done by comparing the indicators with the latent variable. The assumption is that the latent variable symbolises the true error-free variable. The benefit of estimating such a presumably error-free variable for administrative data is that you do not necessarily need a gold standard measurement in your model. However, it is important to be aware that your results will reflect the specified model and could still potentially include bias.
The Methodological Research Hub in the Methodology and Quality directorate at the Office for National Statistics (ONS) has been working on an ongoing project: Estimating and communicating measurement error in administrative data sources. We have been applying novel methods to assess measurement error in administrative data.
Previously, Professor Paul Smith and Dr James Dawber from Southampton University were contracted to investigate the available methods to determine the quality of administrative data sources. One method proposed was SEM, which has primarily been applied in social sciences such as sociology and psychology, to evaluate hard-to-measure concepts through several indicator variables. They applied different types of SEMs to synthetic data, as well as comparing clothing prices with web scraped data versus barcode data. The Methodological Research Hub aims to test SEM on data used in the ONS to understand its applicability and to develop greater knowledge of the measurement error of administrative data sources. This research is part of a series of projects on latent class modelling methods in the hub.
This research will contribute towards the evidence for the National Statistician's Recommendation to Government in 2023: towards assessing quality of administrative data sources. SEM provides a recent method that can quantify the measurement error and contribute to evaluating the quality of administrative and other types of data sources.
Comparing measures of floor area
Official statistics about floor area are produced though surveys such as the Department for Levelling Up, Housing and Communities' (DLUHC) English Housing Survey. However, because of limited sample sizes, analysis of floor space for sub-regional geographies has been limited.
The ONS Social Statistics Admin First (SSAF) Housing team have recently explored the feasibility of using two administrative data sources to produce a harmonised floor area measure to provide sub-national estimates for England and Wales. These sources are Valuation Office Agency (VOA) data and Energy Performance Certificate (EPC) data. The goal of this work is to provide an alternative measure of overcrowding that focusses on the available living space per person. Current overcrowding measures instead consider the number of rooms per person. This new measure has the potential to provide policymakers with more accurate information to meet housing needs.
More information on VOA floor area has previously been published in the Admin-based statistics for property floor space, feasibility research: England and Wales methodology. A breakdown of the EPC data can be found in the DLUHC Energy Performance of Buildings Data guidance.
The SSAF Housing team concluded that the best performing multiple regression model does not produce address-level floor area estimates of high enough statistical quality for further analysis (such as into overcrowding). They expected to see a stronger correlation between VOA and EPC floor area (as discussed in the Developing admin-based floor area statistics for England and Wales: 2021 article), and needed more information related to the measurement error in the two different data sources to judge their comparability. With SEM, this can be further investigated.
The purpose of this project was to test if SEM could be a useful method to apply at the ONS to administrative data. We used the SEM method to evaluate the measurement errors of the two administrative data sources as measures of floor area.
The purpose was also to provide estimates of measurement error for the VOA and EPC floor area to provide the ONS SSAF Housing team with further insight on the quality and comparability between the data sources and the predictability of the EPC data on VOA. Estimates are provided for national data (England and Wales) as well as for each local authority (LA). For practical purposes this publication will provide the combined national estimates of the measurement error.
Research questions
What is the comparability (specifically measurement error) of the floor area measured by two different administrative data sources, VOA and EPC?
How well does SEM work as a tool to estimate measurement error in multiple administrative data sources for use in official statistics?
3. Structural equation models
Structural equation models (SEM) can be complex. For our research, we have used a model with only two covariates to estimate the measurement error. Had the dataset included more suitable variables that would have improved the model, these could have been included. The following equation illustrates the basic SEM. In this model, we want to estimate the measurement error for the observed variable 𝑦 where variable 𝑦 is
where:
- μ is the latent construct variable estimated based on the exogenous indicators
- 𝜆 is the factor loading that measures the validity of 𝑦
- 𝜀 is the measurement error
In this case, the measurement error 𝜀 could be because of either invalidity or unreliability, and so it represents both. If 𝑦 and 𝜆 are both standardised to have variance 1 and μ and 𝜀 are uncorrelated, then var(𝜀) = 1 – 𝜆2. So, if 𝜆 =1, then 𝜀 = 0, which would indicate that there is no measurement error in the variable of interest.
A useful aspect of this model is that it does not rely on a gold standard dataset, and so all sources are assumed erroneous in some way. While the method does not require a gold standard measurement in the model, there is always a risk to be considered if the included measurements are biased in the same direction. ESSnet KOMUSO (2019) included audit survey data to act as a gold standard comparison, but another reason for this was to include enough parameters for the SEM to be identified.
More complex models have been investigated for the purpose of estimating measurement error in survey and administrative data sources, see for example the work of Bakker (2012) and Scholtus and Bakker (2013). Other examples of combining survey and administrative data sources through SEM can also be seen in the work of Pavlopoulos and Vermunt (2015). They investigated whether survey or administrative data from the Dutch labour force survey best captured whether a person had a permanent or temporary job.
Nôl i'r tabl cynnwys4. Data and procedure
This research uses linked Valuation Office Agency (VOA) and Energy Performance Certificate (EPC) data. The VOA data were collected in April 2021 and the EPC data in March 2021. The dataset covers 14.5 million addresses in England and Wales, of which 57.5% of VOA addresses in England were linked to an EPC address, and 53.7% in Wales. This means that the results of this study are only valid for the proportion of properties that could be linked. The datasets contain a floor area variable, as well as a number of rooms variable, which were both used for the modelling. More detail on the cleaning and linkage procedure can be found in the Developing admin-based floor area statistics for England and Wales: 2021 article.
The structural equation model (SEM) was estimated using the R package lavaan (v0.6-7; Rosseel, 2012). The national-level SEM was computed on a covariance matrix that had been derived from the original linked VOA and EPC dataset. SEM is generally calculated based on a covariance matrix so if the original micro data are not accessible or too large, but the covariance matrix is available, it is possible to fit the SEM without using a large dataset. This was the case with our national level analysis.
In our example we fit a SEM with two exogenous indicators for one endogenous latent variable, and two exogenous covariates. The observed variables in the model are:
VOA floor area
EPC floor area
VOA number of rooms
EPC number of rooms
The first indicator of the latent variable was the VOA floor area, and the second indicator was the EPC floor area, measured in square metres. Even though we were not interested in any specific covariates predicting floor area, we needed to include covariates to identify the model. As covariates, we used number of rooms originally from the VOA data and number of rooms originally from the EPC data. Number of rooms as a covariate in the model works conceptually since we can assume that the floor area of a building tends to increase with an increased number of rooms. To be able to estimate the factor slopes, one of the indicators of the latent variable was fixed to one.
Nôl i'r tabl cynnwys5. Results
The structural equation model (SEM) was fitted on the covariance matrix from the national Valuation Office Agency (VOA) and Energy Performance Certificate (EPC) linked dataset. lavaan, like other SEM software, produces several statistics that give different types of indicators on how well the model is fitted against the data, referred to as fit statistics.
If the model shows a good fit to the data, we can trust its estimates to a higher degree than if it does not. These indicators can be dependent on sample size and number of indicators of the latent variables. Shi and others (2022) tested which fit statistics worked best for small models with few degrees of freedom, which is the case with our model. They found that the comparative fit index (CFI) and the standardised root mean square residual (SRMR) were the most robust for small models, so we have chosen to show these statistics. For the final model on floor area in this publication based on national level data, the CFI was 0.986 and SRMR was 0.008. Common cut-off values for CFI are more than 0.95 and SRMR less than 0.08, which indicates that our model fits the data well.
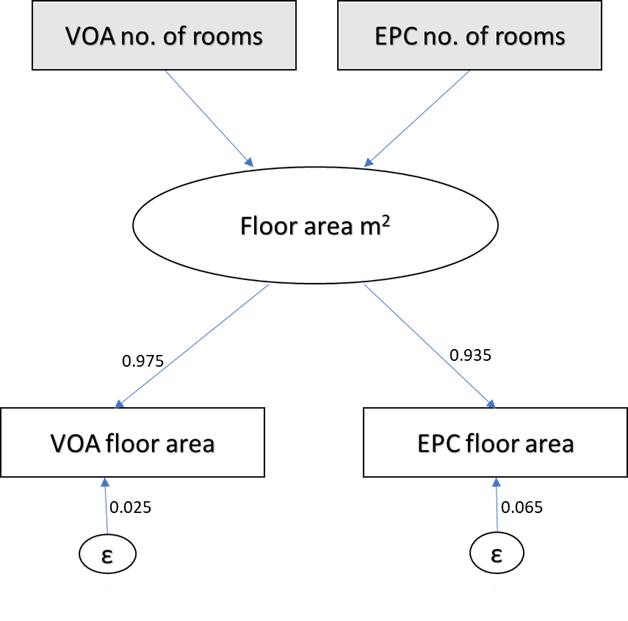
To find out the measurement errors, we first looked at the standardised factor slopes for the floor area indicators which are 0.975 for the VOA floor area and 0.935 for the EPC floor area (Diagram 1). 0 would mean that there would have been no consistency between the two measures and 1 would have meant that they are the same. We expect a number close to 1 since the aim of both measures is to measure floor area. What is not explained in the factor slope is the measurement error (1 - factor loading).
Based on our model, the EPC floor area had a presumed larger measurement error of 6.5% (0.065), compared with the VOA floor area measurement error of 2.5% (0.025), which was not a "perfect" measure either. These measurement errors can be seen as non-negligible since in theory both measures represent the same thing, and we would want them to be the same.
The covariate regression slopes were not of particular interest for this application. The main reason for including them was to have enough parameters for the model to be identified, which means that there needs to be enough "known" parameters in the model to estimate the "unknown". The estimates for our covariates show that the VOA floor area increased on average 14.0 metres squared and EPC 11.4 metres squared per room. Tests of only one covariate were performed, but the fit statistics showed that the inclusion of both yielded the best model fit. The inclusion of covariates from both the VOA and EPC datasets reduced the strength of either factor slope compared with a model with only a VOA covariate or only an EPC covariate.
Diagram 1: Structural equation model of Valuation Office Agency (VOA) and Energy Performance Certificate (EPC) floor area at a national level (England and Wales)
Source: Valuation Office Agency and Energy Performance Certificate 2021
Download this image Diagram 1: Structural equation model of Valuation Office Agency (VOA) and Energy Performance Certificate (EPC) floor area at a national level (England and Wales)
.png (49.6 kB)
The model was also fitted separately at local authority (LA) level. Overall, based on the 355 separate LAs, the individual LAs had a similar pattern of measurement error as national level. There was slightly less error in the VOA floor area measure, and more measurement error in the EPC floor area measure. The only deviation from this pattern were eight LAs within London and four other LAs, that had more measurement error in the VOA measure, compared with the full data.
When investigating the characteristics of these LAs, we found that the London LAs with deviating results patterns were those with the smallest average floor areas. We also found this pattern in two island LAs (Isles of Scilly and Isle of Anglesey) as well as more rural Gwynedd and South Hams.
Future research could investigate what drives these differences in results patterns, but our initial investigation into the characteristics of those LAs showed that the London LAs had a high proportion of small apartments, or a very small count of properties. This finding is in line with new research in the Developing admin based floor area statistics for England and Wales: 2021 article, which shows measurement error would affect the prediction of smaller properties.
Nôl i'r tabl cynnwys6. Future developments
The main conclusion from this research is that structural equation modelling (SEM) should be further explored and can be used for quantifying measurement error in multiple administrative data sources. We intend to continue to assess administrative data quality by using latent class modelling methods.
We are also looking into applying the method to prices data and comparing scanner and barcode prices.
If you have any questions, comments or would like to collaborate with the Methodological Research Hub, please contact Methods.Research@ons.gov.uk.
Nôl i'r tabl cynnwys7. Acknowledgements
We want to thank Professor Paul Smith for his input and support for this research. We are also grateful to the Social Statistics Admin First Housing team for support and topic knowledge.
Nôl i'r tabl cynnwys8. References
Bakker B F M (2012), 'Estimating the validity of administrative variables', Statistica Neerlandica, Volume 66, pages 8 to 17
ESSnet KOMUSO (2019), 'Quality Measure and Calculation Method QMCM_A_18 (PDF, 813KB)'
Office for National Statistics (ONS), released 26 October 2022, ONS website, Developing admin based floor area statistics for England and Wales: 2021
Pavlopoulos D and Vermunt J K (2015), 'Measuring temporary employment. Do survey or register data tell the truth? (PDF, 267KB)', Survey Methodology, Volume 41, pages 197 to 214
Rosseel Y (2012), 'lavaan: An R Package for Structural Equation Modeling', Journal of Statistical Software, Volume 48, Issue 2, pages 1 to 36
Shi D, DiStefano C, Maydeu-Olivares A, and Lee T (2022), 'Evaluating SEM Model Fit with Small Degrees of Freedom', Multivariate Behavioral Research, Volume 57, Issues 2 to 3, pages 179 to 207
Nôl i'r tabl cynnwys9. Cite this methodology
Office for National Statistics (ONS), released 26 October 2022, ONS website, methodology, Using structural equation modelling to determine measurement error in different administrative data sources