1. Executive summary
Office for National Statistics (ONS) is exploring the potential of using new forms of data and methods within the production of official statistics. Research within population statistics and in the Admin Data Census is interested in the statistical uses of data generated from mobile phone telephony as highlighted in a previous literature review.
In this working paper, the relationship between official estimates of UK residential and workday population density and the density of mobile phone cell towers is investigated1 using freely available and open-sourced data on cell tower locations from OpenCellID.
Main points
At Local Authority District (LAD) level across the UK mainland, reasonable correlation exists between cell tower density and both residential (0.84) and workday (0.86) population; however, London LADs have poor correlation with residential population but a much stronger correlation with workday population.
Smaller geographies such as Middle Layer Super Output Area (MSOA) level have poor correlation across England and Wales as there is a distortive effect caused by the siting of cell towers across major transport routes, which exist in areas of low density population.
The heavily urbanised and densely populated area of Greater London does have good correlation between cell tower density and workday population at MSOA and even Lower Layer Super Output Area (LSOA) geographies; anomalies are found in LSOAs with high daytime populations who are neither resident nor working there, examples include transit areas such as mainline rail stations or airports.
The research supports the potential use of cell tower density to quality assure official population estimates in some situations as well as to indicate on the maximum expected population in an area.
This preliminary research into the quality of OpenCellID data raises questions on its accuracy and it is recommended that alternative sources of cell tower location also be investigated. One alternative data source is the information on telecommunication objects contained on AddressBase, which is an address register combining address and locational data from various sources including Ordnance Survey and Royal Mail.
Further research might also be conducted to investigate if cell tower density is further related to demographics such as the deprivation level of an area, or the age-sex structure.
Notes for: Executive summary
- The Code to generate the analysis is realised under MIT LICENCE at https://github.com/ONSBigData/OpencellID_analysis.
2. Introduction
Mobile phones and similar devices send and receive wireless signals to a nearby cell tower or antenna. These signals include calls or text messages, connections to the internet or simply location updates: all are transmitted across the cell tower network to enable mobile telephony.
In the UK, the four primary mobile network operators (MNOs) are Everything Everywhere, O2, Vodafone and Three: each MNO providing a separate cell tower network to cover the country. It is theorised that cell towers are sited so that they can cover the demand for mobile telephony in an area. It is further hypothesised that there might therefore be some relationship between the size of the population and the number of cell towers in an area.
This research uses information on the location of cell towers and investigates the correlation between cell tower density and population density estimates for residents and by workday. A good correlation might indicate that cell tower density could help validate population estimates.
Nôl i'r tabl cynnwys3. Cell tower locations: OpenCellID data
As the location of antennas is commercially sensitive, this research has used crowdsourced data made freely available from a project called OpenCellID. The antenna locations are provided by users of smartphones who have downloaded the appropriate application. This app sends the GPS1 location of the smartphone and associated information about the antenna the phone is connected to including the strength of the received signal.
Multiple GPS measurements referring to the same antenna are averaged to estimate its location more accurately.
Table 1 illustrates a snapshot of the OpenCellID database updated at 16 January 2017.
The table reports only the main fields: mobile technology (radio), mobile country code (mcc), mobile network (net), cell, longitude (lon), latitude (lat), range, samples (number of measurements), changeable (chg), created (timestamp of first measurement)and updated (timestamp of last measurement). More detail on the definitions of these fields are in Appendix A.
Table 1: Snapshot of the OpenCellID database updated at 16 January 2017
| radio | mcc | net | Cell | Lon | Lat | Range | Samples | chg | created | updated |
|---|---|---|---|---|---|---|---|---|---|---|
| UMTS | 262 | 2 | 86355 | 13.28527 | 52.52171 | 37 | 7 | 1 | 1282569574 | 1300175362 |
| GSM | 262 | 2 | 1795 | 13.2766 | 52.52534 | 5714 | 9 | 1 | 1282569574 | 1300175362 |
| GSM | 262 | 2 | 1794 | 13.28491 | 52.52377 | 6278 | 13 | 1 | 1282569574 | 1300816026 |
| UMTS | 262 | 2 | 211250 | 13.285081 | 52.52162 | 33 | 3 | 1 | 1282569574 | 1299486792 |
| UMTS | 262 | 2 | 86353 | 13.29347 | 52.52147 | 592 | 2 | 1 | 1282569574 | 1291400306 |
| Source: Office for National Statistics | ||||||||||
Download this table Table 1: Snapshot of the OpenCellID database updated at 16 January 2017
.xls (21.5 kB)A mobile country code (MCC) is used in combination with a mobile network code (MNC) to uniquely identify a mobile network operator (MNO). The MCCs associated with the UK are 234 and 235.
The number of cell towers associated with UK MCCs and listed in the OpenCellID database is 1,427,795.
Appendix B covers a number of different checks on the quality of the OpenCellID data with the following observations:
- no UK cell tower has its changeable field set at 0, implying that all cell tower locations are estimates rather than exact positions
- 61% of cell towers have more than one data measurement (“samples” field value greater than 1)
- a large number of cell tower locations were loaded simultaneously into the OpenCellID data during 2016 and to a lesser extent in 2009
- the recording of cell towers has increased greatly over the past year
- the distribution of new cell towers by year, indicates that they may have been rolled out in waves of high density across main transport routes; major urban centres are also dense with cell towers although it is unclear if this is simply due to contributors to OpenCellID being more likely to record these cell towers
Notes for: Cell tower locations: OpenCellID data
- GPS is short for Global Positioning System. This is a system of satellites located in orbit, which send and receive high-frequency radio signals to and from devices on Earth. By using information on the location of the satellites in both time and space, the device is able to calculate the distance to each satellite and then calculate its position on Earth, described in terms of longitude, latitude, and altitude.
4. Analysis
4.1 Analysis at Local Authority District (LAD) level
The latitude and longitude coordinates of 1,382,999 cell towers were mapped into 2015 UK mainland LAD boundaries, the remaining 44,796 cell towers being unallocated as they were based in Northern Ireland or their estimated position was in water around the UK coastline. These water-based cell towers might be situated on land close to the coast but recorded by travellers on ferry or ship crossings: the GPS signals for the location of the mobile phone users on water will represent the location of the cell tower. Alternatively, they may represent local cell towers or antennas on ferries or ships.
Using 2015 mid-year residential population estimates for the UK mainland at LAD level, Figure 1 shows a scatter plot of the count of cell towers against residents. It shows that there is a reasonable approximately linear relationship as depicted by a LOESS regression line. The correlation is 0.84.
Within LADs in England and Wales only, correlation between cell tower density and residential population is 0.83 and with workday population is 0.86.
Figure 1: Scatter plot of cell tower counts versus residential population (Local Authority Districts across UK mainland)

Source: OpenCellID; Office for National Statistics
Download this image Figure 1: Scatter plot of cell tower counts versus residential population (Local Authority Districts across UK mainland)
.png (95.4 kB) .xlsx (63.5 kB)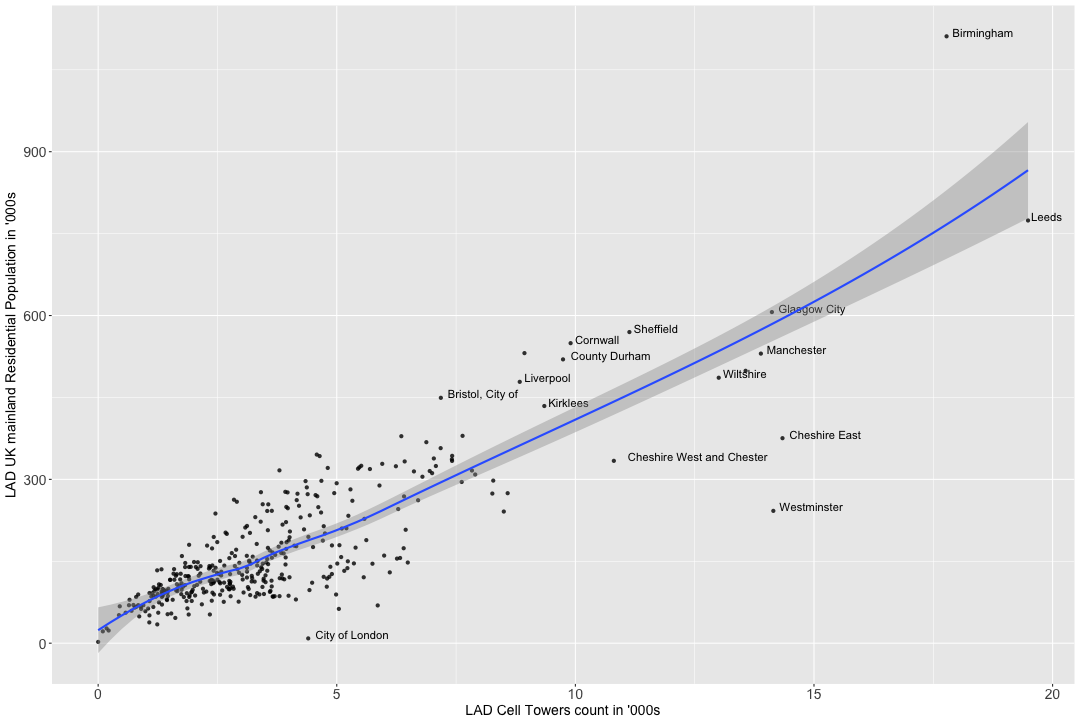
The number of cell towers per 1,000 residents in each LAD is calculated as:
Figure 2 shows the distribution across all LADs of the number of cell towers per 1,000 residents. The mean is around 23 cell towers per 1,000 residents but there is one outlier having 502 cell towers in the City of London LAD, an area with a much larger workday population compared with its residential population.
Figure 2: Distribution of the number of cell towers per 1,000 residents for UK mainland, Local Authority District level

Source: OpenCellID; Office for National Statistics
Download this image Figure 2: Distribution of the number of cell towers per 1,000 residents for UK mainland, Local Authority District level
.png (31.9 kB) .xlsx (45.1 kB)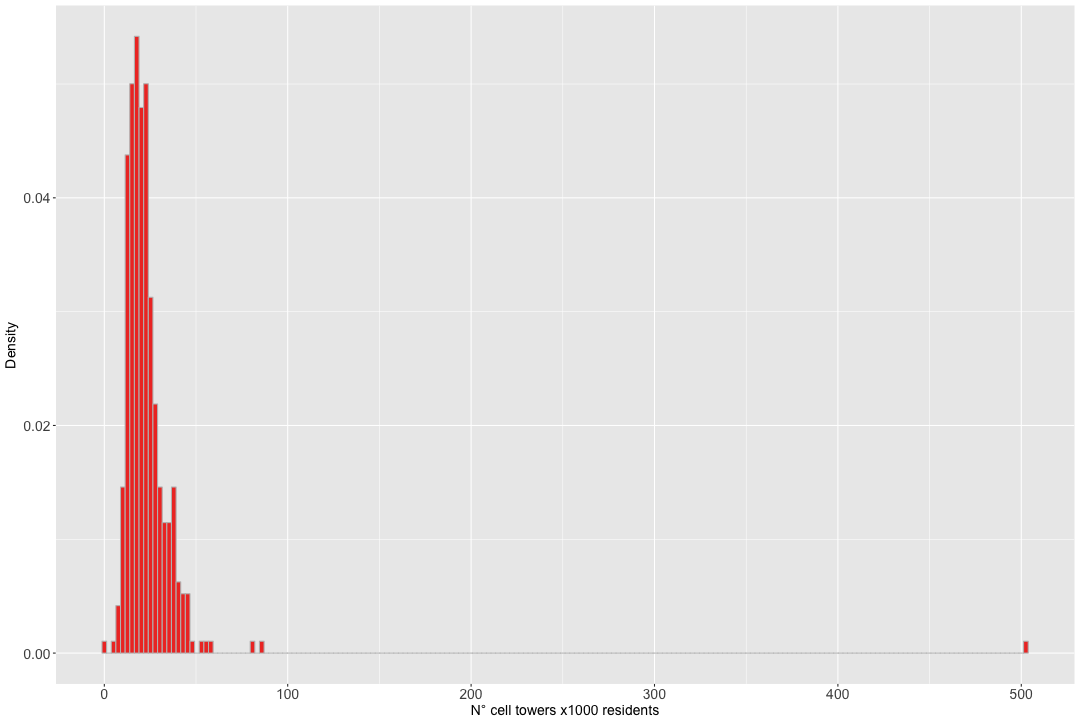
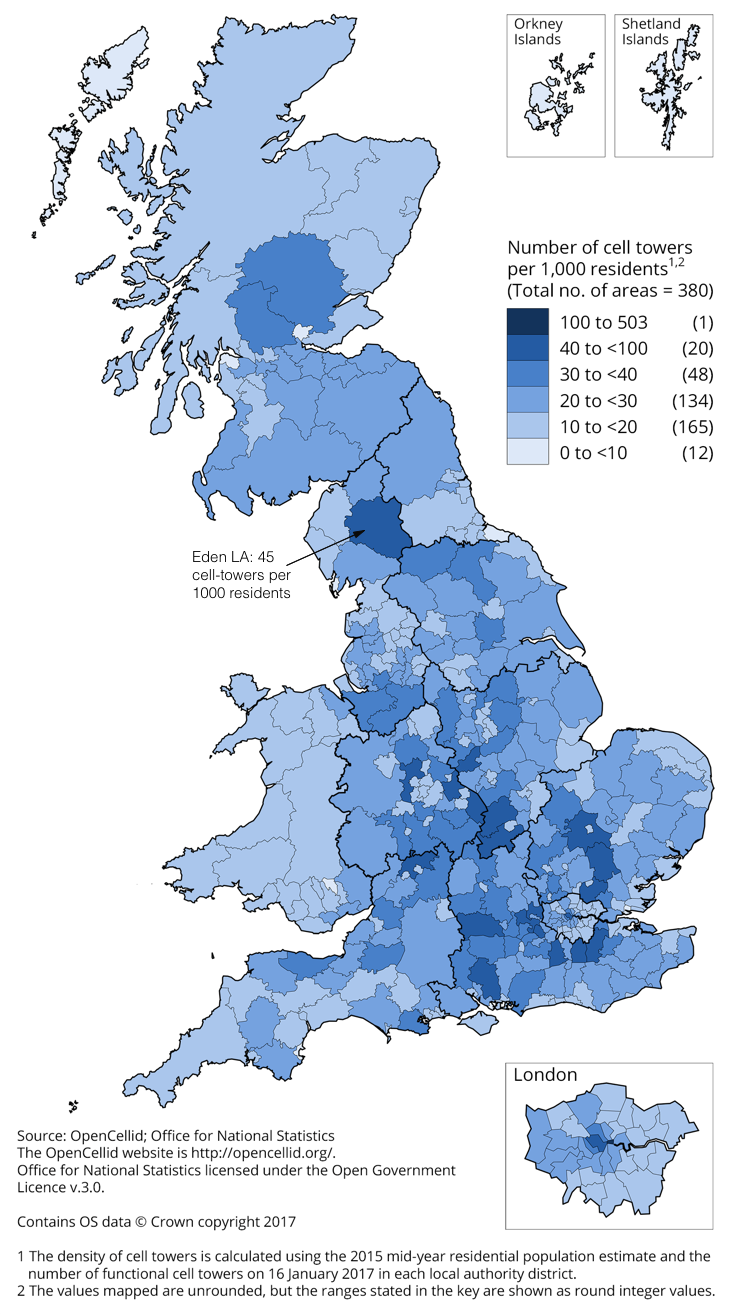
Figure 3 visualises the geographic dispersal of the number of cell towers per 1,000 residents across the UK mainland. A dark blue colour represents the case where there is a high number of cell towers per 1,000 residents. Overall the map reveals a lower density of cell towers in rural, sparsely populated areas around the UK coastline.
However, it is of note that Eden LAD, which has the lowest population density of all LADs in England and Wales, has one of the highest densities of cell towers per 1,000 residents. Examination of Eden LAD reveals that the West Coast Mainline and the M6 run through this area and suggests that cell towers might have been placed in great quantities here to service the mobile demand on these routes.
In London and other areas around major urban LADs, it might be expected that the residential population is very different to the workday population1. Correlations were therefore run specifically for the 33 Greater London LADs. This revealed that the correlation between residential population and cell tower density in this region is very poor at 0.37 whilst by using workday population the correlation improves up to 0.91.
Figure 3: Density of cell towers per 1,000 residents at Local Authority District, UK mainland
Source: OpenCellID; Office for National Statistics
Download this image Figure 3: Density of cell towers per 1,000 residents at Local Authority District, UK mainland
.png (554.2 kB) .xlsx (61.3 kB)
4.2 Analysis at Middle Layer Super Output Area (MSOA) level
For all cell towers in England and Wales (1,262,507 in total), the latitude and longitude coordinates were mapped into MSOA boundaries. As the residential population might be expected to be very different to the workday population across MSOAs, scatter plots were examined for both these population bases against the count of cell towers.
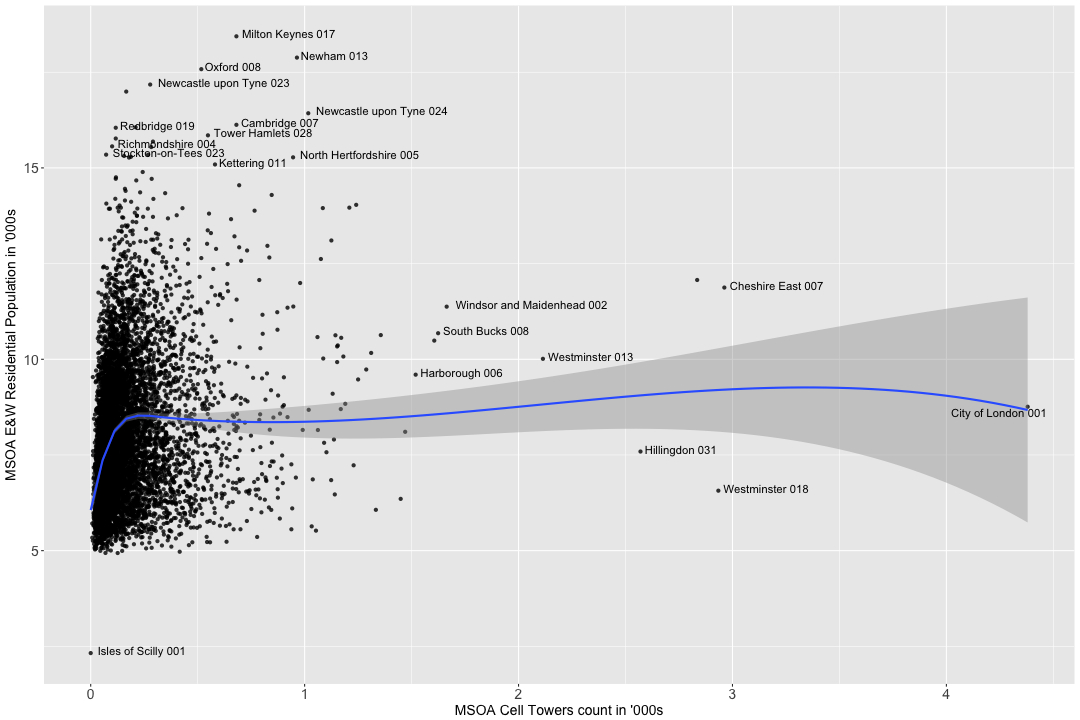
Figure 4 shows that there is no linear relationship between cell tower counts and residential population across MSOAs in England and Wales: the correlation is 0.18. Figure 5 shows that, although workday population is better correlated with cell tower counts, this correlation is still weak at 0.51.
Figure 4: Number of cell towers per Middle Layer Super Output Area versus number of residents per MSOA, England and Wales
Source: OpenCellID; Office for National Statistics
Download this image Figure 4: Number of cell towers per Middle Layer Super Output Area versus number of residents per MSOA, England and Wales
.png (139.0 kB) .xlsx (385.6 kB)
Figure 5: Number of cell towers per Middle Layer Super Output Area versus number of workday population per MSOA, England and Wales
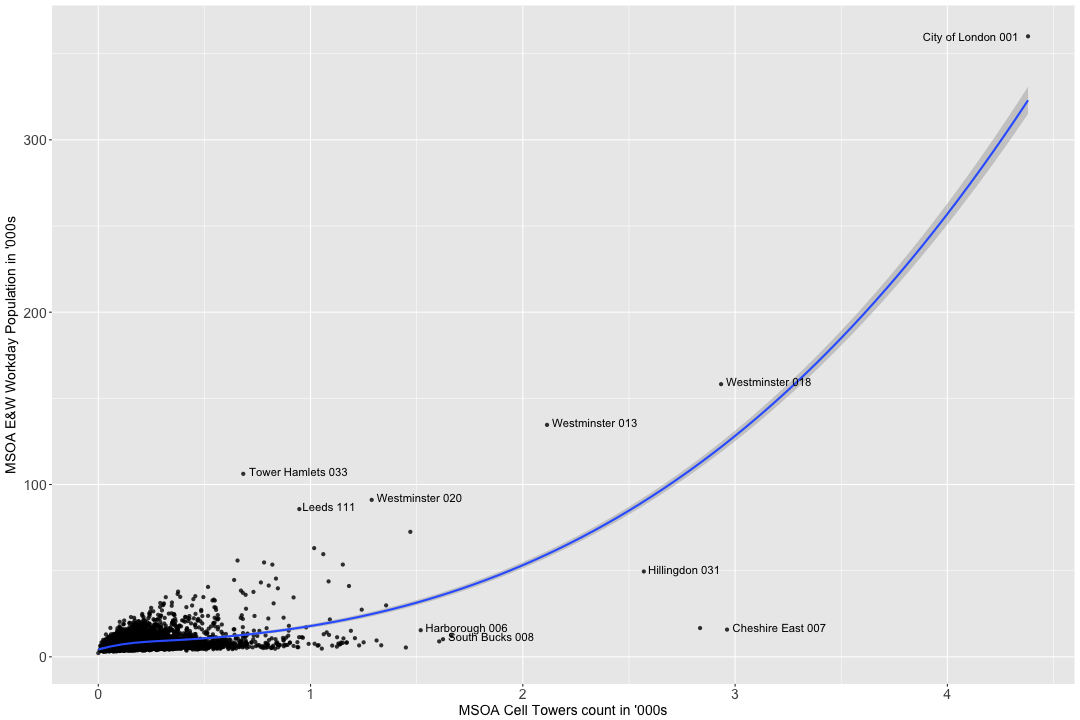
Source: OpenCellID; Office for National Statistics
Download this image Figure 5: Number of cell towers per Middle Layer Super Output Area versus number of workday population per MSOA, England and Wales
.png (86.5 kB) .xlsx (386.1 kB)
The poor correlation between population density and cell tower density across the country is possibly due to the siting of large numbers of cell towers on major transport routes, typically in areas of low population density, as in Eden LAD identified previously.
A high population density exists across the whole Greater London area and even though there are still main transport routes, these will similarly run through areas of high population density. Using the workday population for London MSOAs only, Figure 6 shows that the correlation with cell towers is 0.86 compared with a correlation of only 0.15 with 2015 residential population.
Figure 6: Number of cell towers per Middle Layer Super Output Area versus number of workday population per MSOA, Greater London only
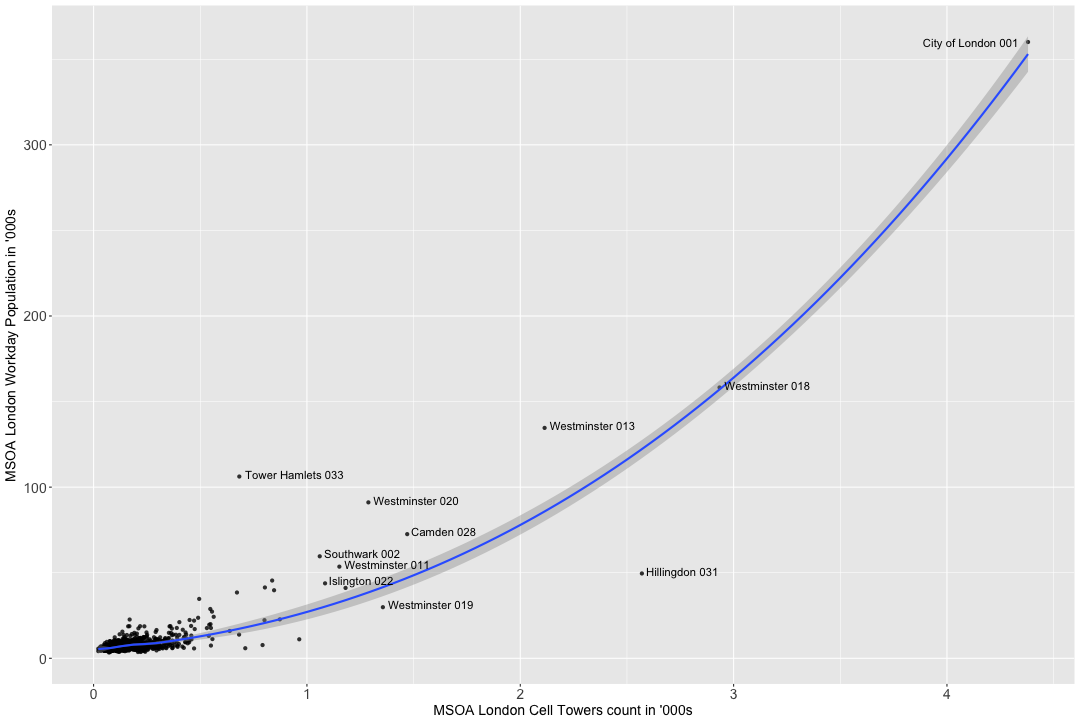
Source: OpenCellID; Office for National Statistics
Download this image Figure 6: Number of cell towers per Middle Layer Super Output Area versus number of workday population per MSOA, Greater London only
.png (84.0 kB) .xlsx (74.4 kB)
4.3 Analysis for Lower Layer Super Output Areas (LSOAs) in London only
As Figure 6 indicates that the distortion caused by transport routes may not be as pronounced in London, a more focused analysis was conducted in this region to see if correlations between cell towers and population density might be good at even smaller geographies, such as LSOA.
Both the 2015 residential and the census workday population were used in these analyses, with much better results being observed with workday population, indicating that cell towers are more likely to be positioned to cater for the expected peak demand for mobile telephony which, in London, is more likely to arise from populations present during the workday.
Using the workday population, Figure 7 illustrates that the correlation with cell tower density across London LSOAs remains high at 0.82. This compares with 0.14 for similar correlation with residential population.
Figure 7: Number of cell towers per Lower Layer Super Output Area versus number of workday population per LSOA, London only

Source: OpenCellID; Office for National Statistics
Download this image Figure 7: Number of cell towers per Lower Layer Super Output Area versus number of workday population per LSOA, London only
.png (87.9 kB) .xlsx (288.4 kB)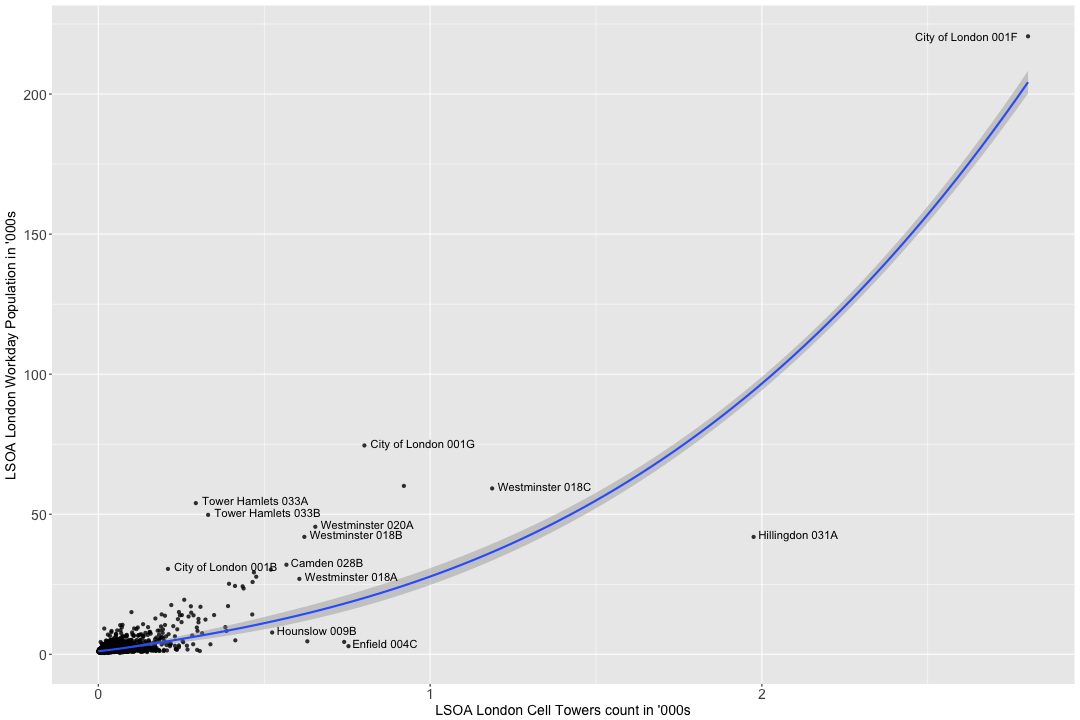
Examination of some of the outliers in Figure 7 reveals that areas such as Tower Hamlets 033A and 033B have substantially higher workday populations than are catered for by cell towers. Both these LSOAs cover the area around Canary Wharf where exceedingly high numbers of workers would be expected (see Figure 8).
Figure 8: Tower Hamlets 033A and 033B – Canary Wharf

Source: Office for National Statistics
Notes:
© Mapbox © OpenStreetMap Improve this map
Download this image Figure 8: Tower Hamlets 033A and 033B – Canary Wharf
.png (277.5 kB)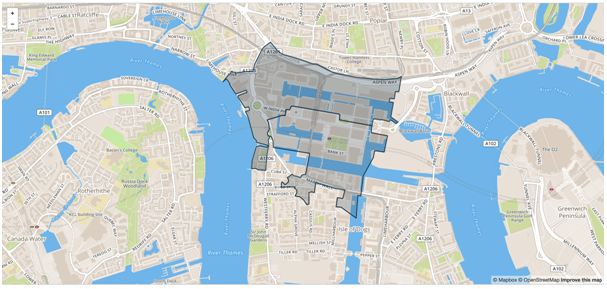
Of further note is that Hillingdon 031A has a higher density of cell towers than would be expected compared with its workday population. Figure 9 shows that Hillingdon 031A contains Heathrow Airport and as such, the actual population based there during the day is likely to be much higher than either the residential or the workday population.
Figure 9: Hillingdon 031A - Heathrow Airport

Source: Office for National Statistics
Notes:
© Mapbox © OpenStreetMap Improve this map
Download this image Figure 9: Hillingdon 031A - Heathrow Airport
.png (344.9 kB)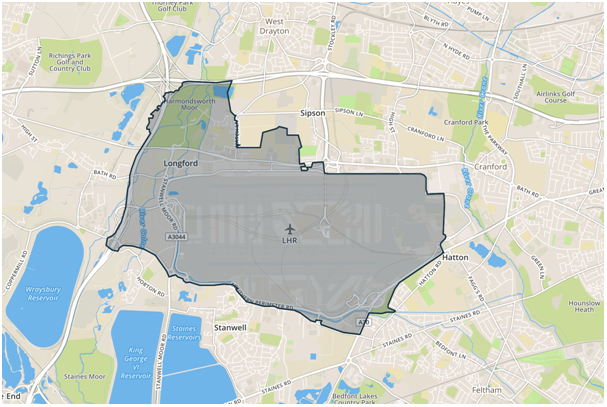
4.4 Kernel density estimation
Using the cell tower location measurements, a density estimation technique was used to make inferences about the underlying probability density functions.
In kernel density estimation, the contribution of each data point is smoothed out from a single point into a region of space surrounding it. Aggregating the individually smoothed contributions gives an overall picture of the structure of the data and its density function.
Using this technique2 in the Heathrow area revealed the cell tower density distribution as in Figure 10. Although Heathrow Terminals 2 and 3 have a high density of cell towers, it is of note that higher densities are observed at major road junctions around the airport. This may be attributed to it being cheaper to site cell towers on roads rather than in the airport. It may also be that larger cell towers are allowed on roads than around the built environment, that there are very high numbers of people expected at these junctions, or possibly that OpenCellID receives GPS location information from travellers on these roads rather than in the airport itself.
Figure 10: Kernel density estimation for Heathrow

Source: OpenCellID; Map tiles by Stamen Design, under CC BY 3.0. Data by OpenStreetMap, under ODbL
Download this image Figure 10: Kernel density estimation for Heathrow
.png (515.7 kB)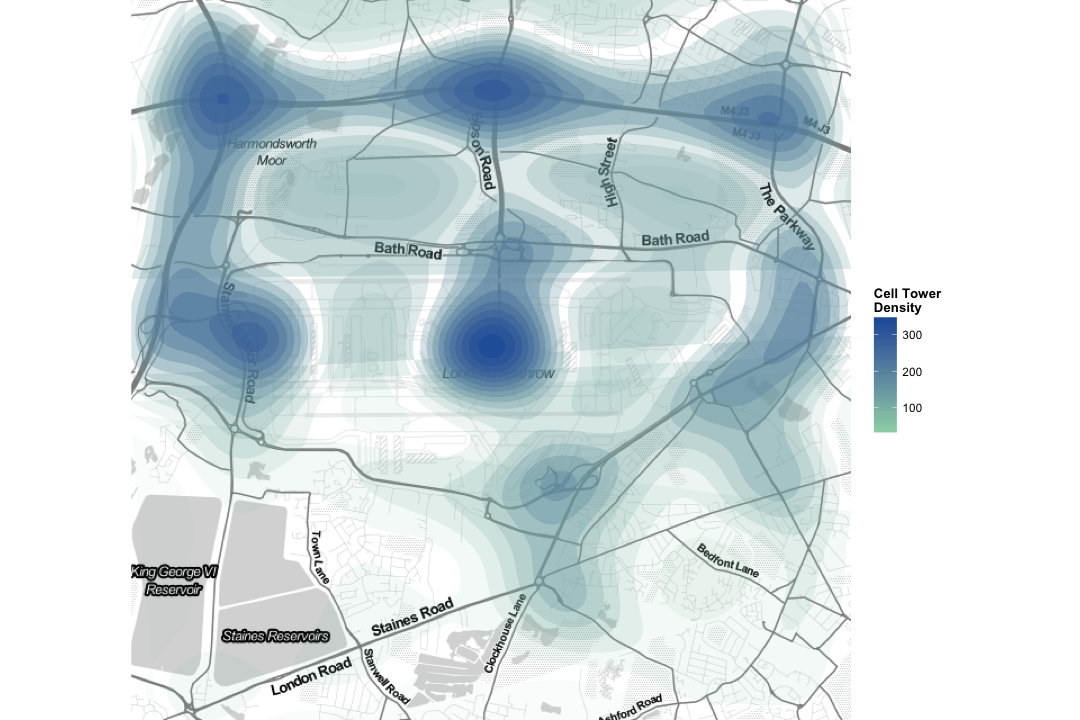
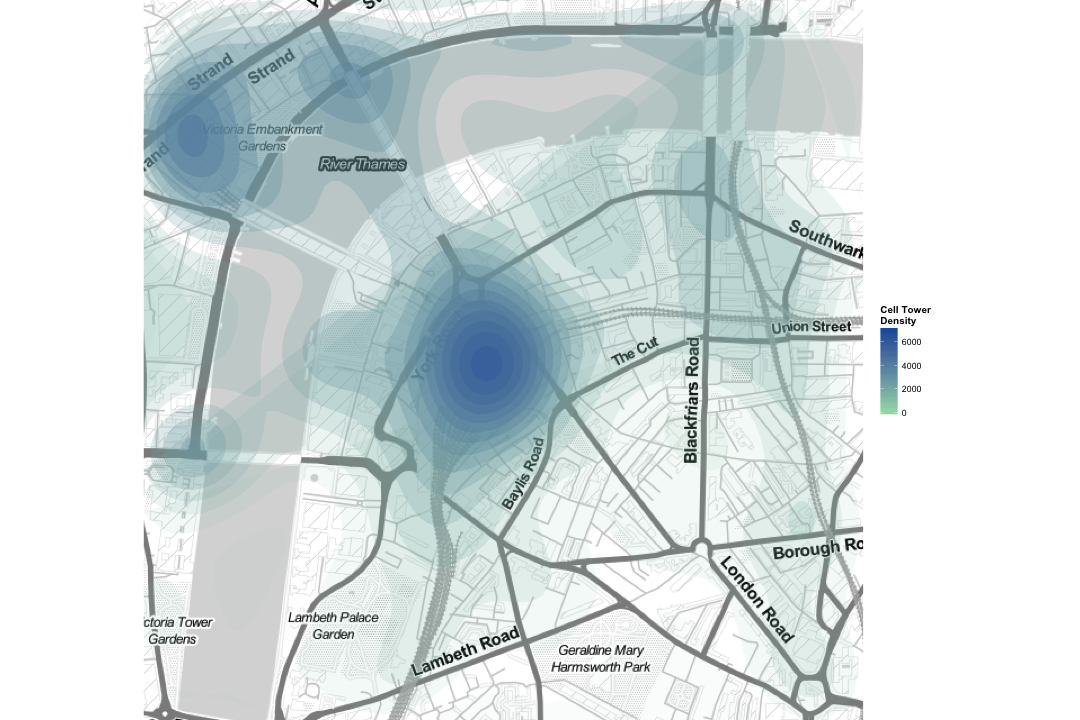
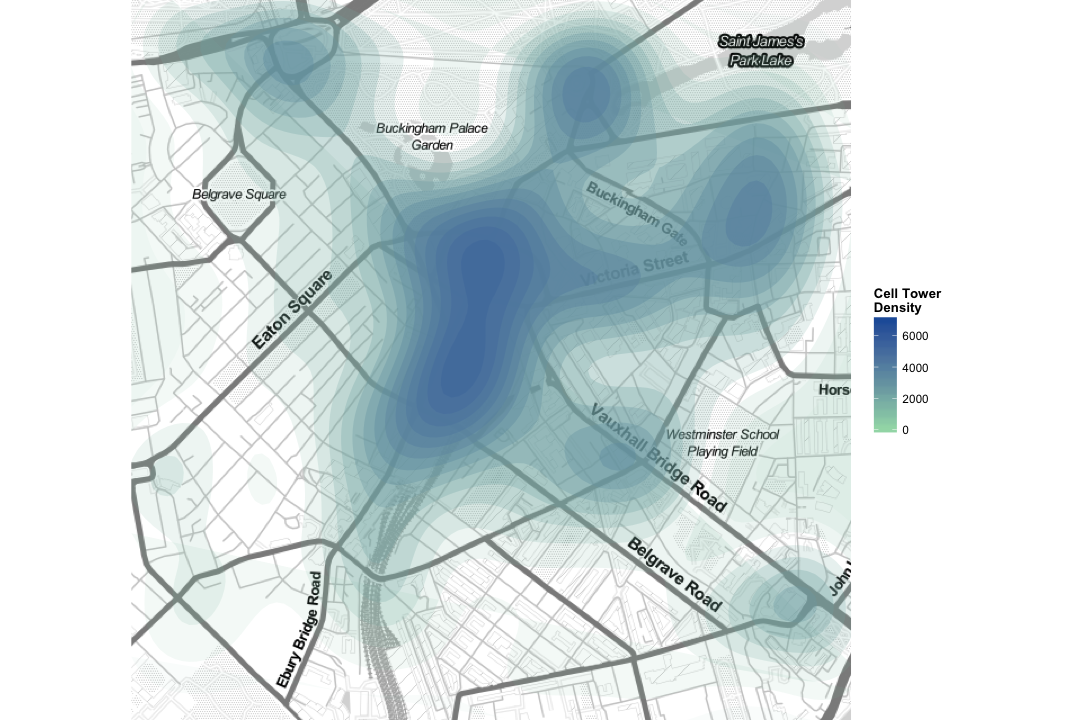
This technique was also applied to areas of London containing the major mainline stations: areas where high population densities would be expected during the day.
Figures 11a, 11b, 12a and 12b reveal the high density of cell towers positioned in some of London’s main stations.
Figure 11a: Kernel density estimation Waterloo/Charing Cross
Source: OpenCellID; Map tiles by Stamen Design, under CC BY 3.0. Data by OpenStreetMap, under ODbL
Download this image Figure 11a: Kernel density estimation Waterloo/Charing Cross
.png (586.8 kB)
Figure 11b: Kernel density estimation King’s Cross/Euston

Source: OpenCellID; Map tiles by Stamen Design, under CC BY 3.0. Data by OpenStreetMap, under ODbL
Download this image Figure 11b: Kernel density estimation King’s Cross/Euston
.png (595.2 kB)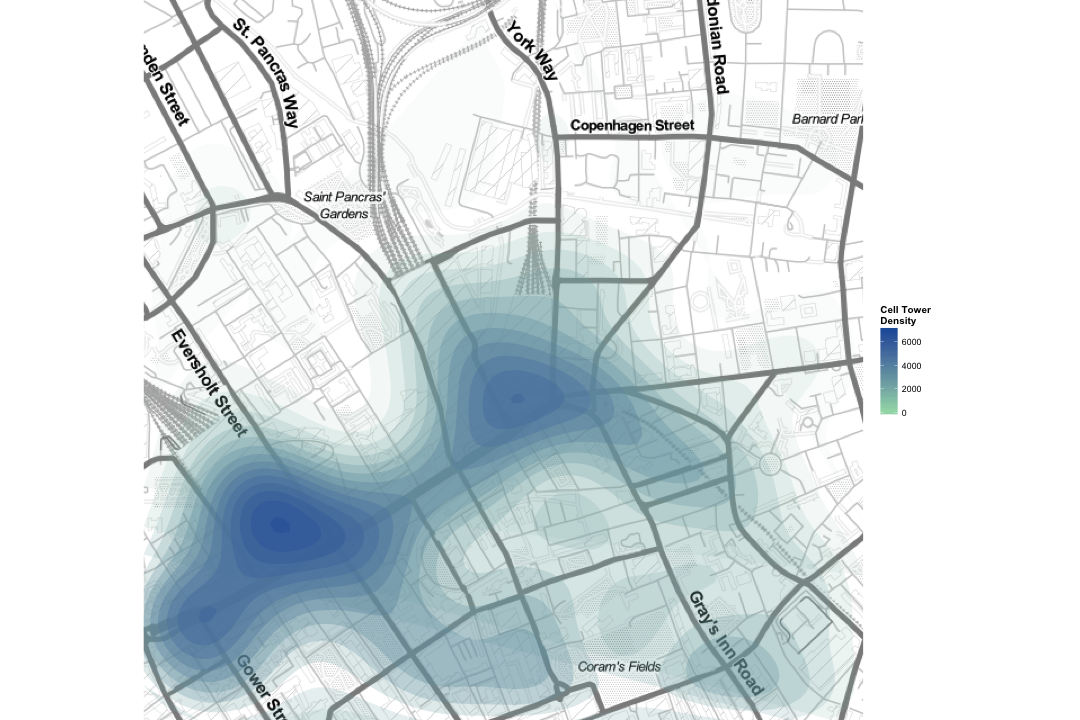
Figure 12a: Kernel density estimation Liverpool Street

Source: OpenCellID; Map tiles by Stamen Design, under CC BY 3.0. Data by OpenStreetMap, under ODbL
Download this image Figure 12a: Kernel density estimation Liverpool Street
.png (626.1 kB)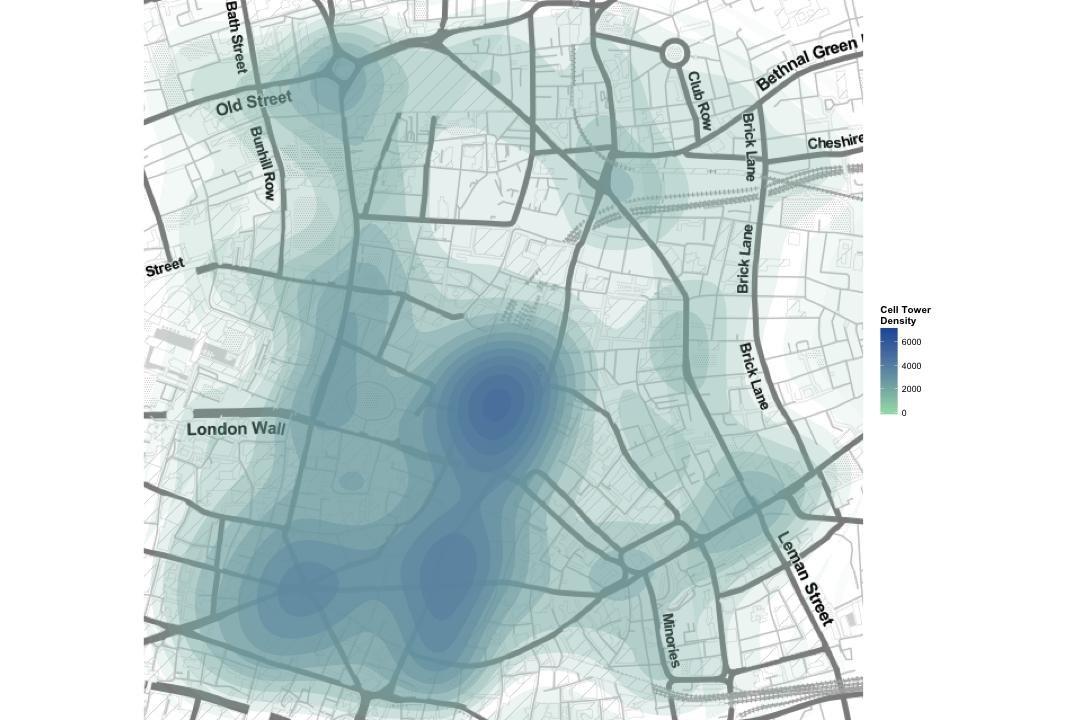
Figure 12b: Kernel density estimation Victoria area
Source: OpenCellID; Map tiles by Stamen Design, under CC BY 3.0. Data by OpenStreetMap, under ODbL
Download this image Figure 12b: Kernel density estimation Victoria area
.png (637.6 kB)
Notes for: Analysis
- Based on the 2011 Census.
- See D. Kahle and H. Wickham. ggmap: Spatial Visualization with ggplot2. The R Journal, 5(1), 144 to 161.
5. Conclusion
This working paper covers some of the investigative research to explore whether there is a relationship between the density of mobile phone cell towers and the density of the population as defined on a residence or workday basis.
Crowd-sourced data from OpenCellID was used to identify the approximate location of cell towers across the UK mainland. Quality checks on these data in January 2017 revealed that there were over 1,400,000 cell towers, of which around 61% of them have been updated since being first recorded in the OpenCellID database. The lack of repeat observation for a cell tower location raises concern over the ability of OpenCellID data to accurately reflect the current distribution of cell towers and questions how OpenCellID might correctly identify when a cell tower is dismantled or moved.
By examining the new cell towers identified each year, it is possible to see a roll-out effect across the UK mainland: cell towers being placed predominantly on main transport routes across the country in 2010 and 2011 whilst more recent years show more dispersed locations of cell towers in urban areas as well as major and minor transport routes. Care needs to be taken with this interpretation of cell tower distribution as contributors to OpenCellID may simply be more inclined to record cell towers according to the routes they normally take or to have been proactive during years when many new cell towers were recorded.
Analysis was conducted at Local Authority District (LAD), Middle Layer Super Output Area (MSOA) and Lower Layer Super Output Area (LSOA) levels with cell tower locations being mapped into each geography as appropriate. Given the approximation of cell tower location by actual GPS locations of connected mobiles, the mapping of cell towers will be less accurate at smaller geographies. This might also explain why some cell towers are observed over water.
The analyses revealed the following.
Correlation between cell tower density and residential population at LAD level is reasonable across the country and is similar to the correlation with workday population. However, in Greater London LADs a much better correlation is found with workday rather than with residential population. It is noted that some rural LADs might have high numbers of cell towers due to the presence of main transport routes.
Correlation of cell tower density across MSOAs in England and Wales is poor at only 0.18 for residential population and still poor at 0.51 for workday populations. Greater London is the exception as correlation with workday populations across its MSOAs is 0.86. This is attributed to the effect of cell towers being placed on transport routes and distorting the population and cell tower relationship across the UK, but having less distortion in the more homogenous high population density across all of London.
Correlation with workday population at LSOA level in London only, remains high at 0.82. Residential population delivers a lower correlation with 0.14. Examination of outliers indicates that locations such as Heathrow Airport and mainline train stations have far more cell towers than would be expected to satisfy the demand for mobile telephony based on workday population. This was further demonstrated in a kernel density estimation analysis.
One observation of note is that the best correlations were observed using workday population estimates that are dated to Census Day 2011 and therefore around six years prior to the OpenCellID analysis dated to January 2017. This might suggest that the siting of new cell towers to satisfy fluctuating mobile demand might not be particularly sensitive to gradual population changes. This might be tested in Greater London at smaller geographies such as LSOA and for different time periods although the difficulty arises in that workday population is not updated between censuses.
It is of further note that this research was repeated using only cell towers with three or more recordings in OpenCellID. Around 700,000 cell towers satisfied this criterion and the research results were very similar and only marginally improved on having used all the cell towers as in this research.
In summary, there is potential to use cell tower data to provide quality assurance (QA) of LAD-level residential population counts. However, in London, this QA role might feasibly extend to LSOA level for workday population. At LSOA level, care would need to be taken for areas likely to have high populations that are neither resident nor at work. Such areas might include major transit locations like airports or train stations, as well as major retail centres. With further information about the capacity of cell towers, cell tower locations might further provide an opportunity to estimate this maximum expected population, which would be a new output within official statistics.
Next steps
The primary recommendation is to engage with the operators of OpenCellID to understand the data better and to have a clearer idea on its quality across various quality dimensions such as accuracy, timeliness and coherence. Additional engagement with analysts in the mobile networks might also reveal insights into the patterns seen around cell tower location.
One research recommendation is that alternative sources of cell tower location be investigated, such as AddressBase. This address register has various codes to classify “non-addressable objects” such as telecommunication masts and exchanges. It might be useful to compare OpenCellID with these AddressBase locations to inform on the quality of the information.
Another area for research would be how timely is any updating of cell tower locations to see if there is any possible application in informing on population density changes over time. It is of note here that the best correlations in London were against census workday population and that alternative proxies for more recent workday populations might be needed to help with this investigation into timeliness and time lags.
Further research might be conducted to investigate if cell tower density may be also be related to demographics such as the deprivation level or age-sex profile of an area. This is a current research project within the development of the Hard to Count Index to identify areas that might be difficult to enumerate for the 2021 Census.
Nôl i'r tabl cynnwys7. Appendix A: OpenCellID data
The OpenCellID data is structured in cell tower and measurement objects. Measurement objects are created from data collected by contributors. When a collected measurement is for a cell that has not been seen before, a new cell tower object is created. Several of the cell tower object’s data fields are updated each time a new measurement for the cell is added.
The data used in this research has been the cell tower objects and the parameters available are highlighted in Table 2.
Table 2: Overview of the OpenCellID cell tower object, the collection of all cell tower objects form the OpenCellID database
| Parameter | Description |
|---|---|
| radio | Network type. One of the strings GSM, UMTS, LTE or CDMA. |
| mcc | Mobile Country Code (UK: 234, 235) |
| net | Mobile Network Code (MNC). |
| area | Location Area Code (LAC) for GSM and UMTS networks. |
| Tracking Area Code (TAC) for LTE networks. | |
| Network IDenfitication number (NID) for CDMA networks. | |
| cell | Cell ID. |
| unit | Primary Scrambling Code (PSC) for UMTS networks. |
| Physical Cell ID (PCI) for LTE networks. An empty value for GSM and CDMA1 networks. | |
| lon | Longitude in degrees between -180.0 and 180.0 |
| changeable=1: average of longitude values of all related measurements | |
| changeable=0: exact GPS position of the cell tower5 | |
| lat | Latitude in degrees between -90.0 and 90.0 |
| changeable=1: average of latitude values of all related measurements | |
| changeable=0: exact GPS position of the tower | |
| range | Estimate of cell range6, in meters. |
| samples | Total number of measurements assigned to the cell tower |
| changeable | Defines if coordinates of the cell tower are exact or approximate. |
| created | The first time when the cell tower was seen and added to the OpenCellID database. |
| updated | The last time when the cell tower was seen and update. |
| averageSignal | Average signal strength from all assigned measurements for the cell. |
| Source: Office for National Statistics | |
| Notes: | |
| 1. CDMA (Code Division Multiple Access): is a 3G wireless technology that competes with GSM. | |
| 2. GSM (Global System for Mobile): is an alternate to CDMA and, as the name implies, is more of a global standard and the 3G technology used by most carriers around the world. | |
| 3. LTE (Long-Term Evolution): is a member of the family of 4th Generation (4G) cellular wireless technologies, and it is anticipated to become the first truly global standard for mobile phones. | |
| 4. UMTS (Universal Mobile Telecommunications System): is another 3rd Generation (3G) technology that is commonly called W-CDMA (Wideband CDMA). UMTS delivers faster data rates than EDGE due to how the data is coded and the spectral bandwidth used. | |
| 5. The changeable data field indicates whether the cell tower location has already been computed using available measurements or not. If the changeable value is 0, the location given for the cell tower is correct. In this case OpenCellID has been given access to data about correct cell tower locations from certain cellular network providers in certain countries. | |
| 6. The working range of a cell site is the range in which a mobile device can connect reliably to the cell site. | |
Download this table Table 2: Overview of the OpenCellID cell tower object, the collection of all cell tower objects form the OpenCellID database
.xls (24.1 kB)8. Appendix B: Investigation into quality of OpenCellID data
Timeliness
Each cell tower in the OpenCellID database has a timestamp representing the date or time the cell tower was first registered and the latest measurement. If there are no updates, then both these timestamps will be the same.
Data from the OpenCellID database was retrieved for research on 16 January 2017.
Figure 13 highlights the cumulative number of how many cell towers per month have been created (inserted for the first time in the database) and updated (excluding those cell towers with no update) up to January 2017.
Figure 13: Cumulative number of cell towers created or updated per month
Source: OpenCellID
Download this chart Figure 13: Cumulative number of cell towers created or updated per month
Image .csv .xlsThe chart highlights that the registering and updating of cell towers has become more active in the past year. This may be related to the expansion of smartphone applications such as inViu OpenCellID and OCI4BB, which make it easier to contribute.
The month with the highest pick of new cell towers registered is March 2016, with 740,123 new cell towers, that is, half of the whole dataset has been generated on that month. A relatively similar sudden change on the number of new cell towers registered is seen in April 2009, where again the size of the database has increased from 23,891 to 40,520 cell towers (positive 70% increase).
According to a representative of the OpenCellID project, an explanation for these sudden changes is contributors who upload to the database large amounts of data (cell towers’ measurements) after collecting them for a while, instead of uploading them as soon as they are identified by the app.
New cell towers per year
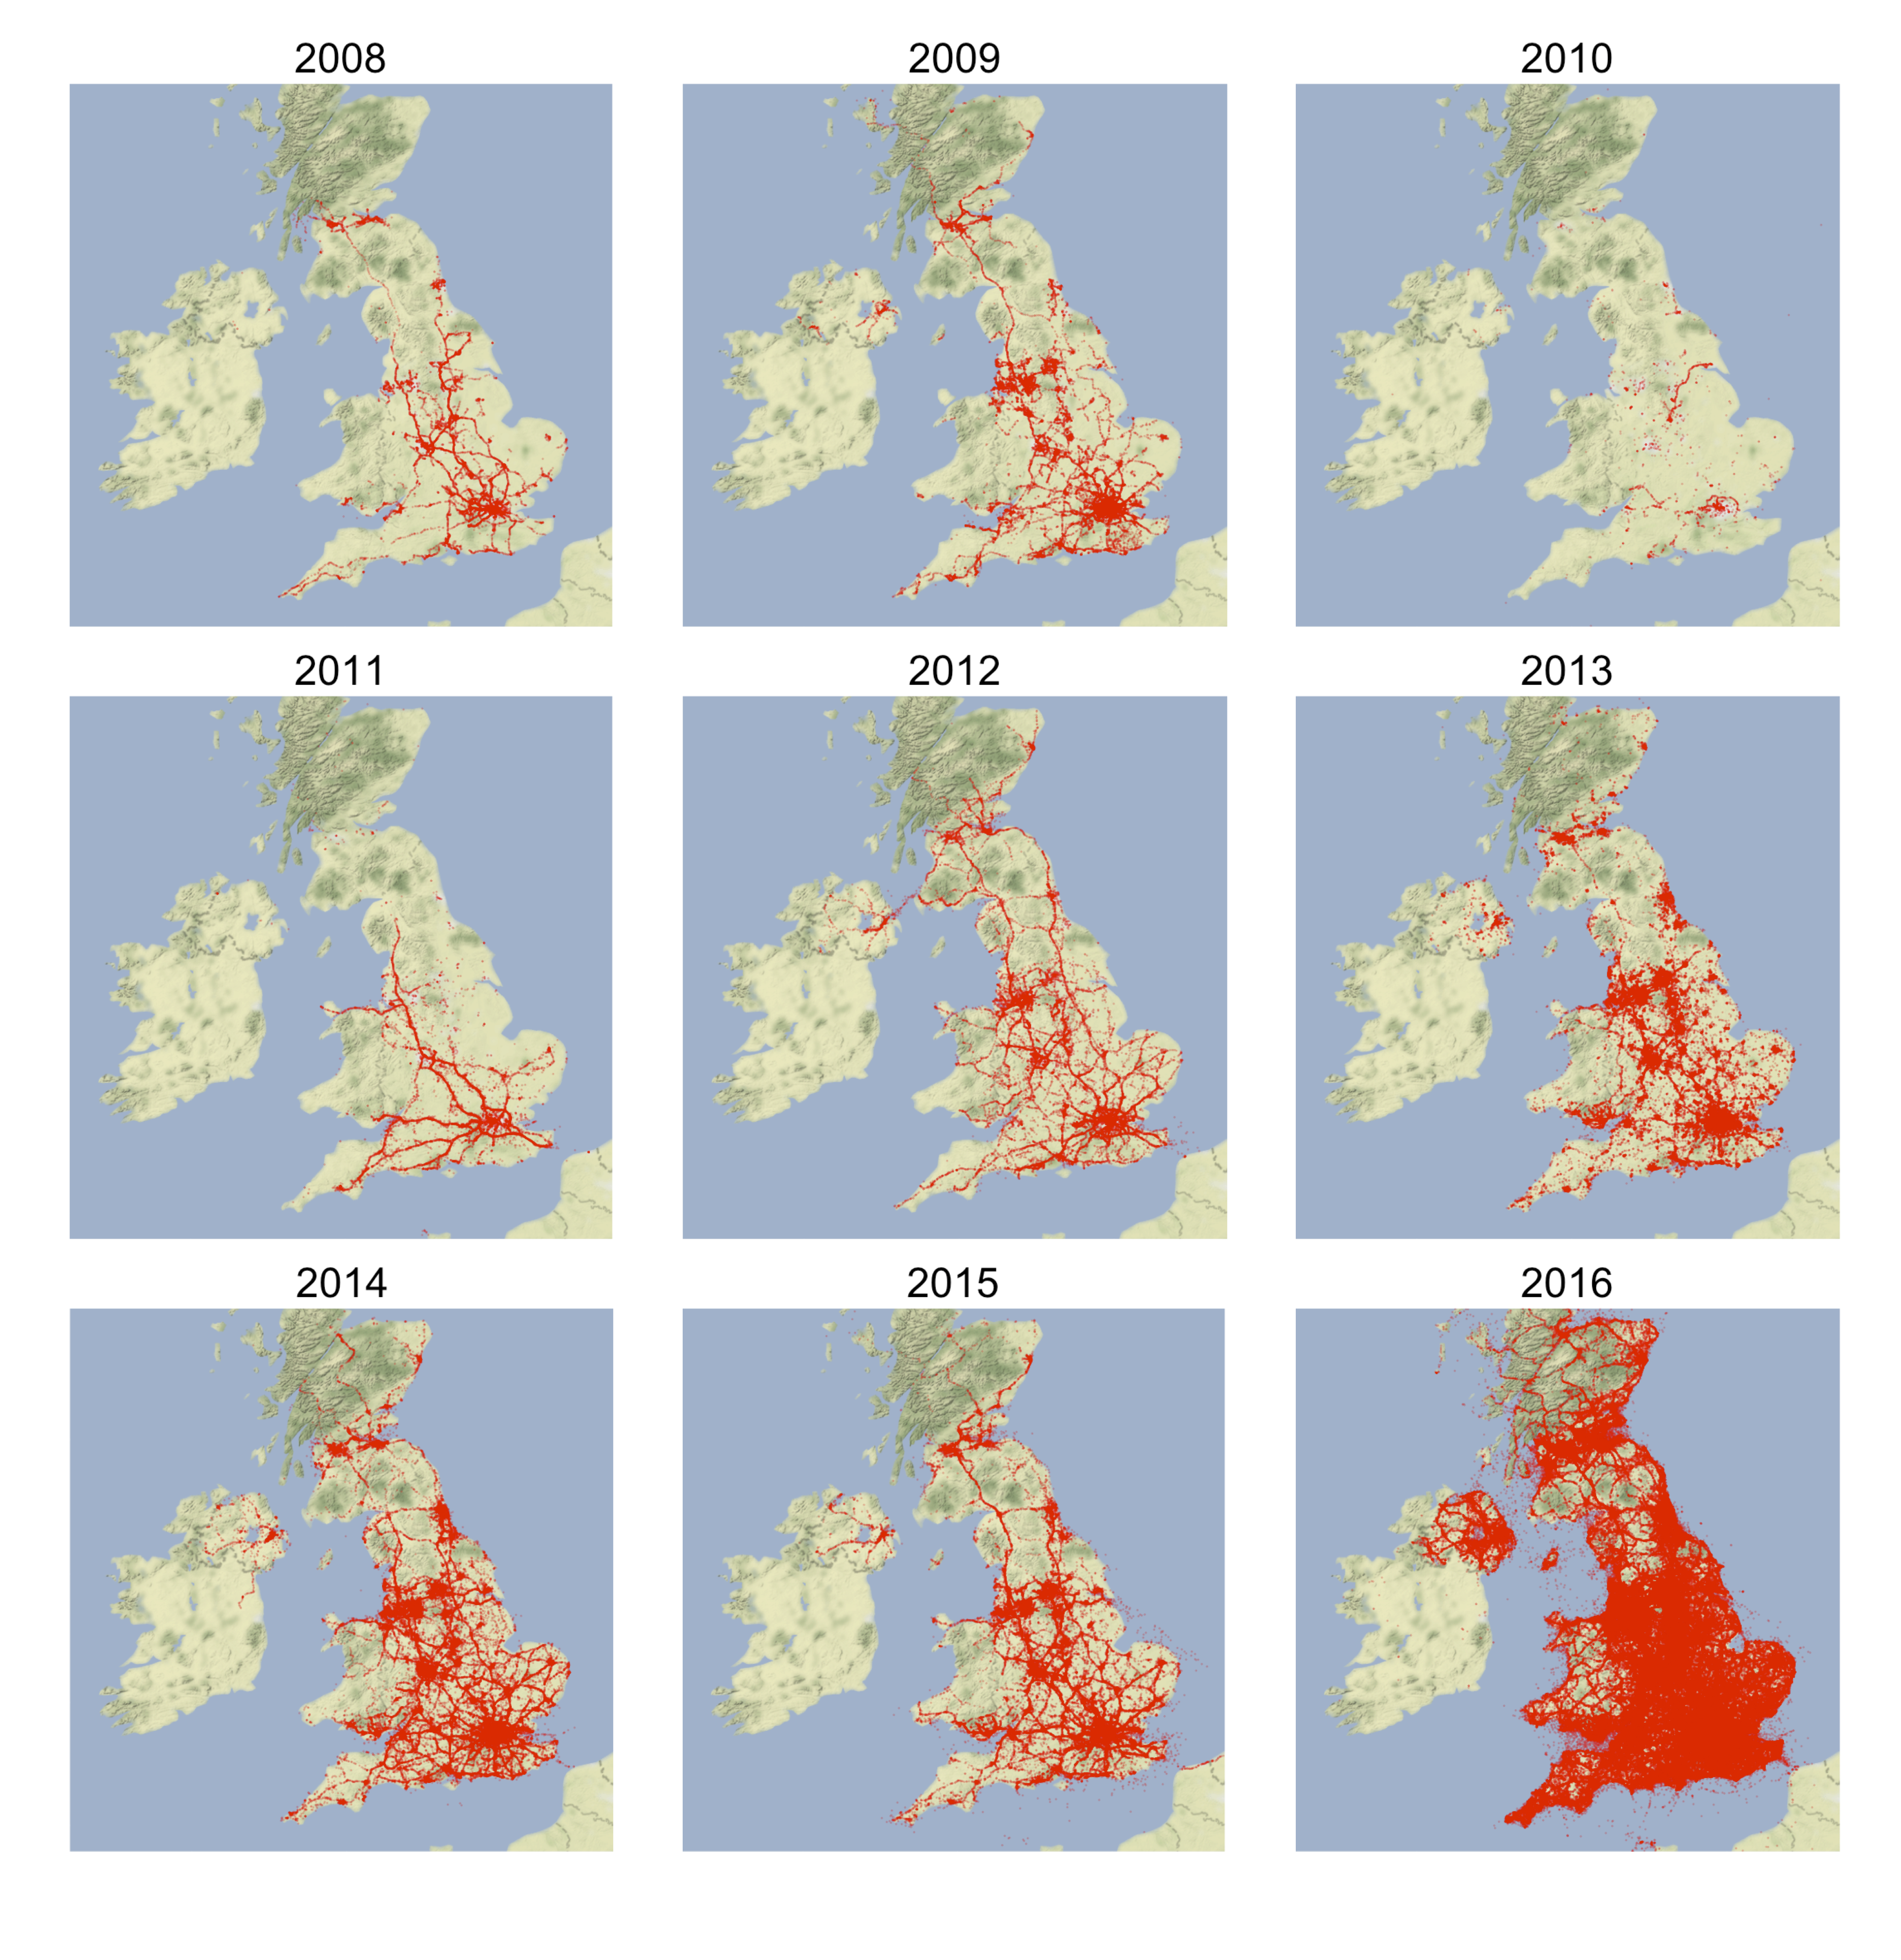
For each year from 2008 to 2016, all newly-registered cell towers were plotted, using the latitude and longitude points on the UK map. Figure 14 reveals that cell towers are positioned along main transport routes across the UK as well as in major urban centres.
The low number of new cell tower registrations in 2010 was followed in 2011 with cell towers depicting the main routes across the country. Fewer new registrations for routes reveal in 2013, possibly as the cell towers situated along them have already been recorded. However, 2014 and 2015 again show that new cell towers along major routes feature heavily again. This may be due to new cell towers being positioned, contributors to OpenCellID travelling along these routes and being the first to record them, or for OpenCellID to be flawed with updating of the same cell tower. The 2016 map shows the greater number of cell towers registered during that year.
In the 2015 and 2016 maps, there are a small number of cell towers positioned at sea. These could represent cell towers close to the coast that are connected to on journeys across water. The GPS signal sent to OpenCellID will be that representing the mobile user’s exact position. Another possibility is that ferries or ships started to have their own cell tower or antennae or that contributors to OpenCellID have just made an observation of these cell towers.
Figure 14: New cell towers per year
Source: OpenCellID; Map tiles by Stamen Design, under CC BY 3.0. Data by OpenStreetMap, under ODbL
Download this image Figure 14: New cell towers per year
.png (11.8 MB)
Repeating the same mapping process using the year of update instead of the year of creation doesn’t show significant differences. The reason is mainly because most of the cell towers (nearly 80%) are created and updated in the database during the same year.
Nôl i'r tabl cynnwys