1. Main points
For March 2019, there were an estimated 5.39 million people employed in the public sector, 15,000 more than for December 2018.
16.5% of all people in paid work were employed in the public sector for March 2019, an increase of 0.1 percentage points on December 2018.
Between March 2018 and March 2019, public sector employment increased by an estimated 39,000; this change is affected by the transfer of Welsh and Scottish housing associations to the private sector.
Excluding the housing association transfers, the estimated number of people employed in the public sector increased by 70,000 between March 2018 and March 2019.
For March 2019, 27.36 million people were estimated to be working in the private sector, 318,000 more than for a year earlier; excluding the housing association transfers, the estimated annual increase in private sector employment was 287,000.
2. Analysis
Figure 1: Since 1999, public sector employment has been affected by a number of bodies moving between the public and private sectors
Total public sector employment, seasonally adjusted, UK, March 1999 to March 2019
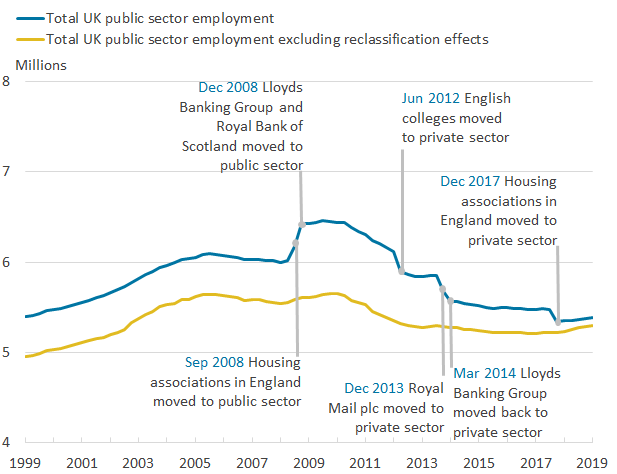
Source: Office for National Statistics – Quarterly Public Sector Employment Survey
Download this image Figure 1: Since 1999, public sector employment has been affected by a number of bodies moving between the public and private sectors
.png (23.4 kB) .xlsx (21.3 kB)
There were an estimated 5.39 million employees in the public sector for March 2019. This was:
up 15,000 (0.3%) compared with December 2018
up 39,000 (0.7%) compared with March 2018
The annual movement in public sector employment has been affected by the transfer of housing associations in Wales (in June 2018) and in Scotland (in September 2018) to the private sector. Excluding the effects of these housing association transfers, public sector employment increased by 70,000 (1.3%) between March 2018 and March 2019.
Of all people in paid work, 16.5% were employed in the public sector for March 2019. This was an increase of 0.1 percentage points on December 2018 and the same percentage of people employed in the public sector as for March 2018.
Figure 2: Record high of central government employment contrasts with record low of local government employment
Public sector employment in local and central government, seasonally adjusted, UK, March 1999 to March 2019
Source: Office for National Statistics – Quarterly Public Sector Employment Survey
Notes:
July 2010: Academies Act 2010 passed.
June 2012: English colleges moved to the private sector.
Download this chart Figure 2: Record high of central government employment contrasts with record low of local government employment
Image .csv .xlsThe latest estimates show a continuing trend of more people employed in central government and fewer people employed in local government, due mainly to some local authority schools in England converting to academy status.
The estimated number of people employed in central government continues to increase to reach a new record high of 3.20 million for March 2019. It is up 27,000 (0.9%) compared with December 2018 and up 111,000 (3.6%) compared with March 2018, as shown in Figure 2. In addition to academy conversions, increases in employment in the National Health Service and the Civil Service contributed to this rise in employment.
The estimated number of people employed in local government continues to fall to reach a new record low of 2.03 million for March 2019. It is down 10,000 (0.5%) compared with December 2018 and down 38,000 (1.8%) compared with March 2018, as shown in Figure 2.
The composition of the public sector is changing due to academy conversions in England. Employees move from local government to central government when local authority schools become academies. In March 2019, academy conversions accounted for 9,000 employees over the quarter and 52,000 over the year, as shown in Table 1. A full time series of employment in academies is available in Table 11 of the public sector employment dataset.
| Thousands, not seasonally adjusted | |||
|---|---|---|---|
| Headcount | Full-time equivalent | ||
| 2016 | June | 450 | 345 |
| September | 468 | 360 | |
| December | 478 | 367 | |
| 2017 | March | 487 | 373 |
| June | 503 | 384 | |
| September | 514 | 393 | |
| December | 526 | 401 | |
| 2018 | March | 540 | 411 |
| June | 554 | 421 | |
| September | 572 | 433 | |
| December | 583 | 441 | |
| 2019 | March | 592 | 447 |
| Change on quarter | 9 | 6 | |
| Change on year | 52 | 36 | |
Download this table Table 1: Employment in academies, England, June 2016 to March 2019
.xls .csvThe estimated number of people employed in public corporations showed a small fall of 2,000 (1.2%) between December 2018 and March 2019 to reach 161,000. Between March 2018 and March 2019, employment in public corporations fell by 34,000 (17.4%), due mainly to the transfer of Welsh and Scottish housing associations to the private sector.
Figure 3: NHS employment continues to increase
Public sector employment, by selected industries, seasonally adjusted, UK, March 1999 to March 2019
Source: Office for National Statistics – Quarterly Public Sector Employment Survey
Download this chart Figure 3: NHS employment continues to increase
Image .csv .xlsFor March 2019, there were 1.68 million people employed in the National Health Service. This was:
12,000 (0.7%) more than for December 2018
40,000 (2.4%) more than for a year earlier
the highest figure on record
For March 2019, the National Health Service accounted for 31.2% of all people employed in the public sector and 5.1% of all people in paid work in the UK.
For March 2019, there were 1.05 million people employed in public administration. This was:
12,000 (1.2%) more than for December 2018
28,000 (2.7%) more than for a year earlier
Public administration has increased every quarter since December 2016.
Figure 4: Private sector employment continues to grow
Private sector employment, seasonally adjusted, UK, March 1999 to March 2019
Source: Office for National Statistics - Labour Force Survey and Quarterly Public Sector Employment Survey
Download this chart Figure 4: Private sector employment continues to grow
Image .csv .xlsPrivate sector employment estimates are derived as the difference between total employment estimates, sourced from the Labour Force Survey, and public sector employment estimates collected from public sector organisations.
The estimates for March 2019 show that there were 27.36 million people employed in the private sector. This was:
17,000 (0.1%) more than the estimate for December 2018
318,000 (1.2%) more than the estimate for a year earlier
The transfer of Welsh and Scottish housing associations to the private sector has contributed to the annual increase in private sector employment. Excluding the effects of these housing association transfers, private sector employment increased by 287,000 (1.1%) between March 2018 and March 2019.
Figure 5: Civil Service continues its increase in employment since record low of 2016
Employment in the Home Civil Service, UK, March 1999 to March 2019
Source: Office for National Statistics – Quarterly Public Sector Employment Survey
Download this chart Figure 5: Civil Service continues its increase in employment since record low of 2016
Image .csv .xlsFor March 2019, there were 446,000 people employed in the Home Civil Service (8.3% of total public sector employment). This was:
6,000 (1.4%) more compared with December 2018
16,000 (3.7%) more than for March 2018
As shown in Figure 5, the Home Civil Service has seen a steady increase in employment since the record low of 416,000 recorded for June, September and December 2016.
Nôl i'r tabl cynnwys3. Data
Public sector employment
Dataset | Released 11 June 2019
Quarterly estimates of UK and regional public sector employment, made up of central government (including Civil Service), local government and public corporations. The estimates also include an industrial breakdown.
Public sector employment time series
Dataset | Dataset ID: PSE | Released 11 June 2019
Seasonally adjusted and non-seasonally adjusted quarterly time series of UK public sector employment, containing the latest estimates.
EMP13: Employment by industry
Dataset | Released 14 May 2019
Estimates of public and private sector employment from the Labour Force Survey. This table is updated four times a year in February, May, August and November.
Nôl i'r tabl cynnwys4. Glossary
Central government
Central government includes all administrative departments of government and other central agencies and non-departmental public bodies (NDPBs); as such, it is wider than the “Civil Service”. This sector also includes HM Forces and the National Health Service. Within education, academies are classified to central government.
Civil Service
A civil servant is a person employed in the public sector on behalf of a central government department, agency or non-departmental government body (NDPB). The UK Home Civil Service excludes the Northern Ireland Civil Service, other Crown servants and employees of the wider public sector; there are Home Civil Service employees based in Northern Ireland and overseas.
Employment
Employment measures the number of people in paid work and differs from the number of jobs because some people have more than one job.
Local government
Local government covers those types of public administration that only cover a locality and any bodies controlled and mainly financed by them. It includes police forces and their civilian staff for England and Wales, excluding the British Transport Police.
Private sector
All people in employment are classified to the private sector except those employed by central government, local government and public corporations.
Public corporations
Public corporations are companies or quasi-corporations controlled by government. These companies receive more than half their income from sales of goods or services into the marketplace.
Public sector
The public sector comprises central government, local government and public corporations as defined for the UK National Accounts. The national accounts are compiled based on an internationally comparable accounting framework and describe the activities in a national economy.
Nôl i'r tabl cynnwys5. Measuring the data
Public sector employment estimates rely mainly on data collected from the Quarterly Public Sector Employment Survey (QPSES), which comprises three separate data collections: the home Civil Service, local authorities in England and Wales, and Great Britain public corporations and non-departmental public bodies (NDPBs).
The public sector employment estimates also rely on:
HM Forces statistics, which are provided by the Ministry of Defence
the Northern Ireland Quarterly Employment Survey, which provides estimates for public sector employment for Northern Ireland
National Health Service (NHS) figures, which are provided for England by NHS Digital, for Scotland by the Scottish Government and for Wales by NHS Wales Informatics Service
Police workforce estimates, which are provided for England and Wales by the Home Office and for Scotland by the Scottish Government
local authority figures for Scotland, which are provided by the Joint Staffing Watch Survey conducted by Scottish Government
figures for academies in England, which are sourced from the Department for Education; there are no academies in Scotland, Wales or Northern Ireland
The Public sector employment (PSE) Quality and Methodology Information report pulls together important qualitative information on the various dimensions of data quality, as well as providing a summary of the methods used to compile the output.
While our headline estimates of public sector employment are derived from the Quarterly Public Sector Employment Survey (QPSES), estimates of public and private sector employment from the Labour Force Survey (a survey of households) are available at Dataset EMP13. While the QPSES estimates follow national accounts definitions of public and private sector employment, the estimates from the Labour Force Survey are based on survey respondents’ perceptions of whether they are employed in the public or private sector and they provide higher estimates of public sector employment than the QPSES survey.
More detailed statistics on employment in the Civil Service, such as regional analyses, diversity and earnings statistics, can be found in the annual Civil Service statistics release published on 3 August 2018. Responsibility for the collection and publication of this annual Civil Service statistics release was transferred to Cabinet Office with effect from 1 October 2018.
Estimates of public sector employment (PSE) in Scotland are published quarterly by the Scottish Government on the same day as this bulletin.
Estimates of public and private sector employment in Northern Ireland are published by the Northern Ireland Statistics and Research Agency (NISRA) in the Northern Ireland Quarterly Employment Survey release.
Response rates
| Response (% of questionnaires returned) | Response (% of employment returned) | |
|---|---|---|
| Local Authorities Survey | 97 | 97 |
| Public Bodies Survey | 95 | 95 |
| Civil Service Survey | 100 | 100 |
| Other sources | 100 | 100 |
Download this table Table 2: Response rates for sources of UK public sector employment, March 2019
.xls .csv6. Strengths and limitations
Public sector employment estimates are based on a complete census of local government and Civil Service and cover all public bodies with 20 or more employees. The usual sampling and estimation techniques applicable to our business surveys are therefore not applicable (for instance, it is not possible for sampling errors or confidence intervals to be produced).
Our targets for response to the Local Authorities and Public Bodies Quarterly Public Sector Employment Survey (QPSES) before the results are compiled are 90% (number of respondents) and 90% (of total employment). In addition, each survey has a list of critical respondents (usually those with the largest employment) for which special efforts are made to achieve 100% response and clearance of test failures. For the Civil Service QPSES, the targets for response before the results are compiled are 100% (number of respondents) and 100% (of total employment).
Data for non-responders are imputed based on previous returns and known annual changes in seasonality. It is extremely rare for a local authority, public body or Civil Service department to non-respond for two consecutive quarters. The data collection is statutory for local authorities and public bodies (Statistics of Trade Act 1947) and positive action is taken to address non-response issues as and when they occur.
Non-sampling error, or bias, is the variation that occurs by chance from the true values for the population and is not due to sampling. This type of error averages close to zero over a large number of repeats of the survey.
Nôl i'r tabl cynnwys7. You might also be interested in
Labour market economic commentary
Article | Released 11 June 2019
Additional economic analysis of the latest UK labour market headline statistics and long-term trends.
Employment in the UK
Bulletin | Released 11 June 2019
Estimates of employment, unemployment and economic inactivity for the UK.
Civil service statistics
Bulletin | Released 3 August 2018
Employment statistics for the Civil Service population, providing regional analyses, diversity and earnings data.
Nôl i'r tabl cynnwys