1. Main points
Labour productivity is an important indicator of a country's economic health, and the unusual weakness observed since the 2008 economic downturn is highly significant, as evidenced by winning the Royal Statistical Society "statistics of the decade" accolade in December 2019.
This weakness is maintained in the latest quarter (Quarter 3 (July to Sept) 2019), with output per hour growing by only 0.1% compared with the same quarter in the previous year.
Multi-factor productivity (MFP) in Quarter 3 2019 is estimated to have decreased by 0.6% compared with same quarter a year ago; this contrasts with trend growth in MFP of around 1.5% per year prior to the economic downturn.
Total public service productivity grew by 0.3% in 2017 compared with 2016. Healthcare remains the service area with the strongest contribution; growing 0.9% in 2017.
Earnings and other labour costs growth outpaced productivity growth, resulting in unit labour cost growth of 3.6% in Quarter 3 2019 compared with same quarter a year ago.
2. Labour productivity and the productivity puzzle
Productivity is the key driver of economic growth and determines the long-term economic health of a nation. Productivity growth is important because more output per hour increases salaries and profits, improves standards of living, and enables the tax revenue to grow, which allows government to fund better public services.
Figure 1 shows that labour productivity has demonstrated weak growth since the 2008 economic downturn, whereas in the previous 10 years it was close to historical long-term average growth-rates of 2.0% per year. This sustained period of minimal labour productivity growth has been labelled the UK's "productivity puzzle", and is arguably the defining economic question of our age.
In December 2019, the Royal Statistical Society crowned the estimated average annual increase of 0.3% in UK productivity in the decade or so since the financial crisis the "Statistic of the decade", reflecting the significance of the unusual weakness observed since the 2008 economic downturn.
This weakness is maintained in the latest quarter (Quarter 3 (July to Sept) 2019), with output per hour growing by only 0.1% compared with the same quarter in the previous year. However, this is the first quarter of growth (compared with the previous year) since Quarter 2 (Apr to June) 2018.
This compares with the no growth reported at flash estimate of productivity as Gross Value Added (GVA) was revised upwards slightly.
Figure 1: Growth in output per hour has been weak over the last decade
Output per hour Quarter 1 (Apr to June) 1998 to Quarter 3 (July to Sept) 2019
Embed code
Notes:
- Percentiles are measurements that indicate the percentage of observations beneath a specified point. The 25th percentile is the value below which 25% of the observations reside.
Download this chart
At present, there are multiple potential explanations for the productivity puzzle. Alongside numerous others, particularly the Economic Statistics Centre of Excellence, the ONS in recent years has worked to attempt to understand and explain this phenomenon and plans to continue this work in the coming year.
Nôl i'r tabl cynnwys3. Multi-factor productivity
Multi-factor productivity (MFP) is a different view on the same issue. Instead of simply looking at output per hour worked, MFP attempts to control for the contribution of changes in capital and the way capital and labour are combined to deliver output. MFP is an estimate of how much more is being produced after controlling for changes in the quantity and quality of inputs: in effect, how the recipe or production technology is changing. If MFP is positive, more is being produced per unit of inputs, and if it is negative it implies less is being produced after controlling for changes in inputs. Changes in MFP and capital inputs can therefore explain movements in labour productivity. This is further explained in our simple guide to MFP.
Multi-factor productivity (MFP) in the market sector in Quarter 3 (July to Sept) 2019 decreased by 0.6% compared to same quarter a year ago; this contrasts with trend growth in MFP of around 1.5% per year prior to the economic downturn.
Productivity is a long-term trend, and we advise looking at growth rates over longer periods to fully understand structural changes in the economy. As such, the cumulative growth of MFP since the economic downturn in 2008 (Figure 2) is a useful means to observe recent movements in a longer-term perspective.
Whilst market sector labour productivity is now marginally ahead of its level at the end of 2007, MFP is still estimated to be 2 percentage points below the pre-downturn level. Since 2012 the UK has also observed capital shallowing, where the available capital services per hour worked remains lower than had been the case in 2007 to 2008. This reflects sluggish post-downturn growth in investment relative to buoyant growth in hours worked as firms in the UK appear to have expanded their production capacity by preferring increasing labour input relative to investment in capital. A number of arguments attempting to explain this have been put forward, including uncertainty in the economy where firms might have been holding back from costly long-term investments such as new machinery and equipment and have instead employed more labour which can be seen as the more flexible input of production.
Figure 2: Multi-factor productivity is still below pre-downturn level
Decomposition of cumulative quarterly growth of output per hour worked, Quarter 1 (Jan to Mar) 2008 to Quarter 3 (Jul to Sept) 2019, UK, market sector
Source: Office for National Statistics
Notes:
Labour productivity growth is the cumulative quarter-on-quarter log change in market sector gross value added (GVA) per hour worked.
Columns show contributions of components, calculated by weighting log changes in each component by its factor income share.
MFP is calculated by residual.
Negative capital deepening is also known as capital shallowing. It represents workers having less access to capital per hour worked.
Download this chart Figure 2: Multi-factor productivity is still below pre-downturn level
Image .csv .xlsOnly improving labour composition has kept pace with pre-downturn growth, reflecting continuing growth in the share of hours worked by workers with above-average qualifications.
Nôl i'r tabl cynnwys4. Public service productivity
Alongside these estimates of whole economy and market sector productivity, we have published two measures of public service productivity: Public service productivity: total, UK, 2017 and Public service productivity: quarterly, UK, July to September 2019.
Public service productivity is estimated using a different method to labour productivity and multi-factor productivity, in part because many of the outputs produced have no price and therefore it is hard to observe changes in the quality of the service, and in part because sometimes it is hard to conceptualise or measure the output. Whilst we have a robust framework to address these questions from the Atkinson Review (2005) (PDF, 1.08MB), continued work to better measure some of these components is ongoing.
Total public service productivity grew by 0.3% in 2017 compared with 2016, continuing a pattern of sustained, consecutive periods of annual growth going back to 2011. Healthcare remains the service area with the strongest contribution to overall public service productivity in 2017, owing to its large share of total expenditure and positive growth of 0.9% compared with 2016.
Figure 3 compares growth in inputs and output annually from 1997. Total inputs grew by 0.7% and total output grew by 1.0% in 2017; principally driven by changes in inputs and output growth from healthcare.
Inputs growth of 0.7% for 2017 is only slightly above the average annual growth rate of inputs since 2010, and therefore continues the period of historically weak growth in inputs as a result of constrained government spending in the post-downturn period.
Inputs can be broken down into three components. They are labour (which can either be measured directly through means such as number of staff or indirectly by measuring service area expenditure on staff), intermediate consumption (expenditure on goods and services) and consumption of fixed capital.
Figure 3: For public services, from 2010 onwards, growth rates of both inputs and output fall compared with the earlier period, but output grows at a faster pace than inputs
Inputs and output growth year on year, before and after 2009 with average lines, UK, 1997 to 2017
Source: Office for National Statistics
Notes:
- The four average lines use a simple mean of the growth rates of inputs or output (as labelled) across the years in which they are drawn across.
Download this chart Figure 3: For public services, from 2010 onwards, growth rates of both inputs and output fall compared with the earlier period, but output grows at a faster pace than inputs
Image .csv .xlsPublic service productivity is reported by nine service areas (of which healthcare and education are the largest). The methodology for education quality has been updated, with more detail available in Improved methods for total public service productivity: total, UK, 2017.
Alongside these detailed measures of annual productivity by public services, we have published experimental, more timely measures of total public service productivity. In an attempt to address the significant time lag associated with the annual release, these more timely series – published on a quarterly basis up to and including Quarter 3 (July to Sept) 2019 – are based on a different methodology, which requires less detailed information. As a result, however, they are based on a higher degree of estimation.
Compared with the same quarter in the previous year, productivity for total public services fell by 0.2% in Quarter 3 2019. This follows a fall in Quarter 2 (Apr to June) 2019. The latest annualised quarterly data suggest that 2018 saw an increase in public service productivity of 0.2%.
Nôl i'r tabl cynnwys5. Healthcare productivity
Over the course of the measured time series for total public service productivity, the service area with the largest positive contribution to output, input and productivity growth has been healthcare. The productivity of public service healthcare is analysed in more detail in two separate articles: one which presents the measures on a UK and calendar year basis, equivalent to Public service productivity: total, 2017; and another which presents the measures on an England and financial year basis to provide a measure that is more comparable with other data available on the health service in England.
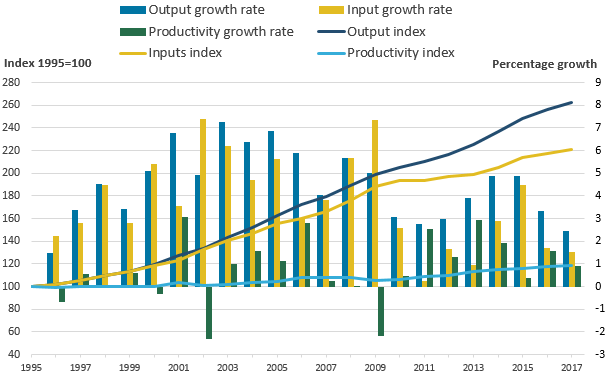
Figure 4 shows public service healthcare productivity for the UK on a calendar year basis. Healthcare productivity grew by 0.9% in 2017, with output growth of 2.4% and inputs growth of 1.5%. While this productivity growth was similar to the average annual growth rate of the whole time series between 1995 and 2017, of 0.8%, output and inputs growth were both well below their average rates of 4.5% and 3.7% respectively.
Growth in productivity, inputs and output were also lower in 2017 than in 2016. Inputs growth slowed slightly from 1.7% in 2016 to 1.5% in 2017 due to slower growth in goods and services inputs; while output growth slowed from 3.3% in 2016 to 2.4% in 2017, with growth slowing across all four components of quantity output growth, although the quality adjustment improved slightly.
Figure 4: On average, productivity has grown faster during the 2010s than the 2000s, although inputs and output have grown more slowly
Public service healthcare output, inputs and productivity indices and growth rates, UK, 1995 to 2017
Source: Office for National Statistics
Notes:
- Output is quality adjusted.
Download this image Figure 4: On average, productivity has grown faster during the 2010s than the 2000s, although inputs and output have grown more slowly
.PNG (31.5 kB) .xls (39.4 kB)
Several improvements have been made to the methodology behind the figures in the latest release, including:
developments to the methodology for deflating goods and services inputs, including the introduction of the NHS Cost Inflation Index
introduction of NHS bank staff in England into labour inputs from financial year ending (FYE) 2016
methodological improvements to the estimation of capital consumption
introduction of a "days adjustment" to account for the effect of year-to-year changes in the number of working days and total days on healthcare output
More information on these improvements is available in the release and the accompanying methodological article, Methodological developments to public service productivity: healthcare.
Nôl i'r tabl cynnwys6. Improvements to capital
In Blue Book 2019 (BB19) significant methods changes were introduced to the measurement of capital stocks and the consumption of fixed capital (depreciation). This led to revisions for Multi-Factor Productivity (MFP) highlighted in the MFP release last quarter, and also impact on annual public service productivity estimates published today (8 January 2020).
Capital inputs reflect the use of fixed capital assets which last more than a year, such as buildings, equipment, computers and software. The largest change to capital measurement in BB19 was the reduction of asset lives for many types of asset, following a detailed review described in this article. This has the effect of increasing rates of depreciation on many assets, and consequently reducing the estimates value of the capital stock. The changes to asset lives have also impacted the weights assigned to different asset groups in capital services estimates. For more information on the asset lives used in capital services, see VICS asset lives dataset published alongside the Multi-factor productivity release.
New capital services estimates are considerably weaker than previously thought, and the weakness in capital per hour worked (known as capital deepening, or in the case of falling capital per hour worked: capital shallowing) is now thought to explain around a third of the productivity puzzle since around 2012. Since MFP is calculated by residual in the growth accounting framework, downward revisions to capital services growth have led MFP estimates to be revised up.
Figure 5: Contribution of capital deepening to output per hour growth has been revised down
UK market sector, 1997 to 2018
Source: Office for National Statistics
Notes:
Current refers to data as published in Multi-factor productivity estimates: Experimental estimates July to September 2019.
Previous refers to data before Blue Book 19 improvements, as published in Multi-factor productivity estimates: Experimental estimates January to March 2019.
Download this chart Figure 5: Contribution of capital deepening to output per hour growth has been revised down
Image .csv .xlsEstimates of capital input have also been revised in public service productivity statistics. Most public services are not very capital intensive, and capital has a small weight in total inputs (including intermediate goods and services) of only around 10%. However, this masks considerable variation by service area: in defence, it accounts for over 20%, but in adult social care and children's social care only around 1%.
As a result of the revisions, capital inputs for public services is now estimated to have grown in every year between 1997 and 2017, at an average rate of 2.9%. This has slowed to 2% in years since 2010, as a result of weaker capital investment. The growth of 1.4% in 2017 continues this weaker trend. However, there has been considerable capital deepening in public services, unlike in the market sector, since 2010.
Nôl i'r tabl cynnwys7. Unit Labour costs
Unit labour costs (ULCs) are an important indicator of domestically generated inflation, as they capture how labour costs grow relative to productivity; they reflect the relationship between the cost of labour and the value of corresponding outputs. ULCs reveal how wages and other labour costs companies face are growing relative to productivity. As they reflect full labour costs, they also include social security and pension contributions paid by employers, which are incurred in the production of a unit of output.
They are usually expressed as the ratio of the total labour compensation per hour worked, to the output per hour worked.
In December we published indicative estimates of unit labour costs following Blue Book 2019 changes. There were revisions throughout the time series and additionally from 2018 incorporated proposed methods changes to mixed income. These mixed income estimates were included in the quarterly national accounts in December 2019 for Quarter 2 (Apr to June) 2019. Today's (8 January 2020) publication incorporates these new data.
In Quarter 3 (July to Sept) 2019, ULCs increased by 3.6%, compared with the same period a year ago, making it the 14th consecutive quarter of growth in ULCs.