Cynnwys
- Main points
- Things you need to know about this release
- Results for NUTS1 regions and countries
- Results by NUTS2 sub-regions
- Results for NUTS3 sub-regions
- Results for local enterprise partnerships and city regions
- Results showing “real” estimates of labour productivity
- Alternative results excluding rental income
- Methodology
1. Main points
The statistics in this article have been produced using the new “balanced estimates” of regional gross value added (GVA(B)), first published on 20 December 2017; the “balanced” GVA data are combined with data on hours worked and jobs filled to provide experimental estimates of regional and sub-regional productivity.
The data are published for NUTS1, NUTS2 and NUTS3 UK sub-regions (according to the Nomenclature of Territorial Units for Statistics (NUTS) classification) as well as for UK city regions and English local enterprise partnerships (LEPs).
Inner London West had the highest labour productivity in 2016 amongst the 40 NUTS2 sub-regions, at 46% above the UK average, while the highest labour productivity level outside of London was in Berkshire, Buckinghamshire and Oxfordshire (15% above the UK average); the lowest level was in Cornwall and Isles of Scilly (29% below the UK average).
Tower Hamlets had the highest labour productivity level amongst the 168 NUTS3 sub-regions of Great Britain in 2016, at 72% above the UK average; the lowest level was in the rural sub-region of Powys in Wales, with a level 35% below the UK average.
The English local enterprise partnerships (LEPs) with the highest labour productivity in 2016 were London followed by Thames Valley Berkshire, while Cornwall and Isles of Scilly was the LEP with the lowest productivity.
London, Aberdeen, Edinburgh and West of England City Regions all had labour productivity above the UK average in 2016, while the city region with the lowest labour productivity was Sheffield City Region.
New experimental chained volume “real” estimates of labour productivity for NUTS1 and NUTS2 regions are published for the first time with this article; only 20 out of 40 NUTS2 sub-regions experienced real productivity growth over the 2011 to 2016 period; over the longer 2004 to 2016 period there was real productivity growth in 35 of the sub-regions.
2. Things you need to know about this release
The article provides new experimental estimates for measures of labour productivity (gross value added (GVA) per hour worked and GVA per filled job) using a balanced GVA approach for NUTS1, NUTS2 and NUTS3 (Nomenclature of Territorial Units for Statistics) sub-regions of the UK, selected UK city regions and English Local Enterprise Partnerships (LEPs) up to 2016. The estimates are provided in both real and nominal terms for NUTS1 and NUTS2 sub-regions and in nominal terms for NUTS3 sub-regions, LEPs and city regions.
Experimental Statistics
The data in this release are classified as Experimental Statistics. This reflects that development work continues on these data and that new experimental estimates of regional gross value added (GVA) have been used in the calculations (see introduction to balanced gross value added later in this section). A National Statistic for regional labour productivity at NUTS1 level based on the existing gross value added income approach (GVA(I)) method can be found in the January 2018 release of the labour productivity bulletin.
What is labour productivity?
Labour productivity is defined as the quantity of goods and services produced per unit of labour input, for example, per hour worked or per filled job. It is one of the most widely used measures of economic performance of a nation or an area.
Productivity matters because increasing productivity is critical to increasing economic growth in the long-run. This follows from the fact that economic output can only be increased by either increasing the amount of inputs or by raising productivity. Furthermore, changes in labour productivity are also related to changes in real wages. Increasing productivity is, therefore, an important aim for both national and local economies. As shown in the "Results" sections in this article, there is currently a wide spatial divergence in levels of productivity between different sub-regions.
In this article, two measures of labour productivity are provided. The first is a ratio of output (measured as gross value added (GVA)) divided by the hours worked to create it. The second measure divides GVA by the number of filled jobs used to create it. In both cases, GVA is an estimate of the total amount of goods and services produced less the value of intermediate inputs.
Availability of data
A number of datasets accompany this release. There is one dataset available covering NUTS1, NUTS2 and NUTS3 geographies, according to the Nomenclature of Territorial Units for Statistics (NUTS) classification (see “UK geographies” for more detail), and two separate datasets covering local enterprise partnerships (LEPs) and city regions. All datasets provide data on levels of current price “nominal” productivity and productivity indices comparing areas with the UK average. The productivity jobs and hours data used in the calculations are also included. An alternative calculation of current price productivity excluding imputed rentals is also included for NUTS geographies (see “Total GVA versus GVA excluding imputed rental income” part of this section for more detail).
For the dataset covering NUTS geographies, new chained volume “real” estimates of labour productivity are also included for NUTS1 and NUTS2 regions. This is the first time these data have been made available and is a result of the introduction and publication of experimental estimates of “balanced” regional GVA in December 2017.
Introduction to balanced gross value added
In previous releases of sub-regional productivity estimates, the data have been calculated using gross value added (GVA) calculated via the income approach (GVA(I)). In this release, we are publishing the productivity data using the new balanced gross value added (GVA(B)) measure. Regional GVA(B) was published for the first time by Office for National Statistics (ONS) in December 2017. The balanced GVA measure “balances” the income and production approaches to measuring the economy into a single estimate at a regional level. As well as improving the quality of the GVA statistics, this development also allows labour productivity estimates for NUTS1 and NUTS2 geographies to be calculated in both “real” and nominal terms. For further information on the GVA(B) measure, please refer to the “Methodology” section.
Understanding “real” versus “nominal” productivity data
The balanced GVA(B) data used in this article are measured both at current basic prices, which includes the effect of inflation, and in “real terms” (constant prices) in chained volume measure (CVM), with the effect of inflation removed. When available, the constant price “real” data are most useful for assessing time-series trends. They allow us to understand whether there has been any increase in volumes of goods and services, with the effects of changes in prices removed. By contrast, when using nominal current price data, it is not possible to differentiate between the effects of price changes and quantity changes.
The constant price GVA(B) data has been derived by deflating the current price estimates for 112 industries using national industry deflators obtained from the UK gross domestic product (output) system. These deflators are consistent with the UK National Accounts Blue Book 2017 and they are used because in most cases, regional price indices are currently not available. The Eurostat Manual on Regional Accounts (2013) recommends that in the absence of regional prices the use of national deflators is acceptable, provided that deflation occurs at a minimum level of 38 industries. However, users should be aware that the “real” data in this publication are mostly based on use of national industry deflators, rather than specifically regional price deflators.
GVA per head versus labour productivity measures – GVA per hour and GVA per filled job
When assessing regional economic performance, it is recommended to use the productivity measures in this article (GVA per hour worked or GVA per job filled) rather than GVA per head. This is particularly important when there are large net commuting flows into or out of an area.
The reason for this is that the productivity measures (GVA per hour worked or GVA per job filled) provide a direct comparison between the level of economic output and the direct labour input of those who produced that output. This is not the case, however, for GVA per head, as the GVA per head measure includes people not in the workforce (including children, pensioners and others not economically active) in the calculation, and can also be very heavily biased by commuting flows. This is because if an area has a large number of in-commuters, the output these commuters produce is captured in the estimate of GVA, but the commuters are not captured in the estimate of residential population. In this situation, a GVA per head measure would be artificially high if used as a proxy for economic performance or welfare of a region.
For these reasons, the labour productivity measures in this article are recommended for users directly investigating the economic performance of a region. These productivity measures are also recommended as part of a basket of indicators for investigating the wider economic performance or welfare of a region. In this context, they can be used alongside ONS regional gross disposable household income (GDHI) data, which provide “residence-based” estimates of total household incomes in an area.
Difference between GVA per hour worked and GVA per filled job
GVA per hour worked and GVA per filled job can both be used as measures of labour productivity, but these two measures are different. GVA per hour worked divides GVA by the total hours worked by the workforce in the sub-region; while GVA per filled job apportions GVA to the number of jobs in the sub-region. There will be some small differences between the relative results for the two measures. This occurs because the average number of hours worked per job varies from sub-region to sub-region because of differences in labour market structure and working patterns. For example, a sub-region with high levels of part-time employment will tend to have lower average hours worked per job.
GVA per hour worked is considered a more comprehensive indicator of labour productivity and the preferred measure at subnational level. This is because GVA per filled job does not take into consideration regional labour market structures or different working patterns, such as the mix of part-time and full-time workers, and job shares.
GVA per hour worked data are currently available for the period 2004 to 2016 and GVA per filled job data are available for the period 2002 to 2016. Data are available from 1997 for the NUTS1 regional geography within the ONS Labour productivity bulletin.
Total GVA versus GVA excluding imputed rental income
The headline productivity calculations in this article use total GVA as a measure of output. This includes all components of GVA and is in line with national productivity estimates.
However, it can be argued that not all GVA components are equally relevant when assessing labour productivity, as some elements of GVA are not directly related to the input of labour. In particular, imputed rental incomes, such as imputed rental values capturing the value of housing services accruing to owner-occupiers, could be excluded from the total GVA to obtain a measure of output more closely related to the measurable labour input.
Therefore, we have also provided data that exclude imputed rentals from the GVA(B) “nominal” used in the productivity calculations. These data are discussed in the “Alternative results excluding rental income” section of this article and are also available in the datasets for NUTS geographies accompanying the release.
Smoothed versus unsmoothed data
Ideally, all year-on-year change in the productivity estimates in this release would represent "true" changes. However, it is also possible that the data can reflect volatility due to sampling and non-sampling errors. This is more likely where sample sizes are low, which can occur at smaller geographical areas (for example, NUTS3 areas). Therefore, caution is required when carrying out a change over time analysis of the sub-regional productivity data at smaller geographies using unsmoothed data.
For this reason, the datasets accompanying this release provide both smoothed and unsmoothed estimates. In this article, the data presented in the charts and tables use unsmoothed data for NUTS1 and NUTS2 geographies, but use the smoothed data series for NUTS3 geographies, local enterprise partnerships and city regions. For more information on the smoothing process, please refer to the “Methodology” section in this article.
Interpreting data in index form
Data are presented in index form in two different ways in the article. The first of these is in the presentation of constant price “real” labour productivity changes. When used in this way, the indices compare the “real” productivity in any region with its productivity in real terms in a base year. From these indices, year-on-year changes in “real” productivity can be calculated.
The second way in which indexed data are used is to show how the levels of current price productivity differ from the UK average for any region. Such data can show that a region’s productivity is 10% higher or 15% lower than the UK average in any particular year. It should be noted that when used in this context, a decrease in the productivity index number of a sub-region does not necessarily mean that the sub-region’s productivity has decreased in actual terms; it rather means that the sub-region has performed relatively worse than the rest of the UK over the period. In other words, its actual productivity level may have improved, but at a slower rate than the UK overall, therefore declining relative to the UK equals 100 index. Similarly, an increase in the productivity index number means that the sub-region has performed better than the rest of the UK. Data on actual current price GVA per hour worked or GVA per filled job are available in the datasets if you wish to examine the data directly.
UK geographies
Sub-regional productivity data are published in this article for the NUTS1, NUTS2 and NUTS3 geographies, selected city regions and for local enterprise partnerships (LEPs). For the purposes of the European Regional Statistics, geographical distinctions are made according to the European Union’s Nomenclature of Units for Territorial Statistics (NUTS) boundary classification that exists to allow comparable economic statistics across Europe. There are three NUTS levels in the UK, NUTS1 (9 regions), NUTS2 (40 sub-regions) and NUTS3 (173 sub-regions).
LEPs are partnerships in England between local authorities and businesses. They were created in 2011 and their role is to help shape local economic priorities and undertake activities to encourage local economic growth and the creation of jobs. There are currently 38 LEPs.
We also present data for selected city regions. City regions are of particular policy interest at the present time. In England, a number of city region areas have been granted increased devolution powers over recent years, while in Scotland and Wales, city deals have been agreed between some city regions and the UK government. Section 5 of this article presents data for the 14 largest city regions, defined where applicable by combined authority boundaries.
For further information on UK geographies, please refer to the “Methodology” section in this bulletin.
Nôl i'r tabl cynnwys3. Results for NUTS1 regions and countries
Figure 1 shows the relative labour productivity performance of the 12 UK regions and countries relative to the UK average for 2016 (following the Nomenclature of Territorial Units for Statistics (NUTS)1 classification). Gross value added (GVA) per hour worked was highest in 2016 in London, at 33% above the UK average. The only other region with productivity above the UK average was the South East of England, with productivity 6% above the UK average.
In Scotland, productivity in 2016 was marginally below the UK average, whilst in Wales and Northern Ireland, productivity was 17% below the UK average. The regions of the north and Midlands of England (North East, North West, Yorkshire and The Humber, East Midlands and West Midlands) had productivity levels between 7% to 15% below the UK average.
Figure 1: Labour productivity (gross value added per hour worked) by NUTS1 region, unsmoothed, current prices, 2016

Source: Office for National Statistics
Download this image Figure 1: Labour productivity (gross value added per hour worked) by NUTS1 region, unsmoothed, current prices, 2016
.png (9.3 kB) .xlsx (10.8 kB)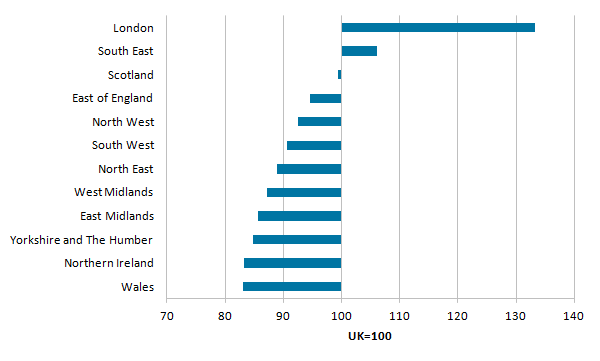
It should be noted that Figure 1 is based on the new balanced gross value added (GVA(B)) data, which is experimental at present.
For the moment, the National Statistic for regional labour productivity at NUTS1 level remains that based on the long-standing gross value added income approach (GVA(I)) method. That data can be found in the January 2018 release of the labour productivity bulletin. A consultation to consider shifting this NUTS1 National Statistic to using the GVA(B) method shown previously will be carried out prior to the April release of the labour productivity bulletin.
Additionally, there will be further detail and information on productivity in NUTS1 regions and countries available later in the year when information on labour productivity by region by industry will be published.
Nôl i'r tabl cynnwys4. Results by NUTS2 sub-regions
There are 40 NUTS2 sub-regions of the UK (based on the Nomenclature of Territorial Units for Statistics (NUTS) classification). Figure 2 shows the NUTS2 regions with the highest nominal labour productivity in 2016. Inner London West had the highest level, at 46% above the UK average. The other four areas of London are also shown in Figure 2, while the highest labour productivity level outside of London was in Berkshire, Buckinghamshire and Oxfordshire (15% above the UK average). Overall, 11 out of the 40 NUTS2 areas had labour productivity above the UK average.
Figure 2: Gross value added per hour worked – highest ranking UK NUTS2 sub-regions, unsmoothed, current prices, 2016

Source: Office for National Statistics
Download this image Figure 2: Gross value added per hour worked – highest ranking UK NUTS2 sub-regions, unsmoothed, current prices, 2016
.png (10.2 kB) .xlsx (11.5 kB)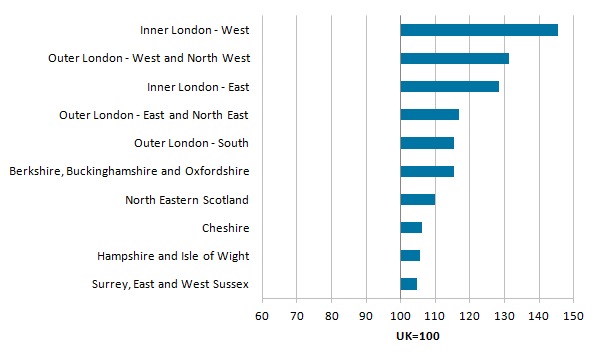
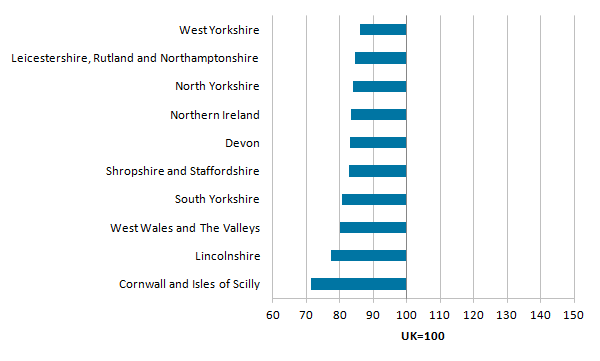
Figure 3 shows the NUTS2 sub-regions with the lowest nominal labour productivity levels. Each had productivity at least 14% below the UK average (or 7% below a UK excluding London average). Most of the places with the lowest productivity levels were relatively rural areas of the country, for example, Cornwall and Isles of Scilly, Lincolnshire, and West Wales and The Valleys. The lowest productivity in a predominantly urban sub-region occurred in South Yorkshire.
Figure 3: Gross value added per hour worked – lowest ranking UK NUTS2 sub-regions, unsmoothed, current prices, 2016
Source: Office for National Statistics
Download this image Figure 3: Gross value added per hour worked – lowest ranking UK NUTS2 sub-regions, unsmoothed, current prices, 2016
.png (9.2 kB) .xlsx (10.9 kB)
5. Results for NUTS3 sub-regions
This section presents the results of the labour productivity estimates for England, Scotland and Wales by NUTS3 (Nomenclature of Territorial Units for Statistics) sub-regions in 2016, based on current price (“nominal”) gross value added (GVA). Results for England are presented separately for London, the rest of the south of England, the Midlands and the north.
The labour productivity estimates focus on nominal GVA per hour worked as the preferred sub-regional labour productivity measure. In all cases, the data have been smoothed based on a weighted moving average of up to five years’ data (see the “Methodology” section for more information). For Northern Ireland, productivity estimates are only available for GVA per job filled and these data can be found in the dataset for NUTS geographies accompanying this article.
Note that the very high productivity levels in the Greater London region lead to a skewed distribution of productivity levels across the UK, such that relatively few sub-regions have productivity levels above the UK (mean) average. In 2016, just 48 out of 168 NUTS3 sub-regions across England, Scotland and Wales had a GVA per hour worked above the UK average, of which 20 were in London. For information, the average labour productivity calculated for the UK excluding London is 7% below the UK average when London is included (that is, the UK excluding London average would read as 93 in Figures 1 to 12 in this article, which are calculated and displayed on a UK equals 100 index basis).
Results for London
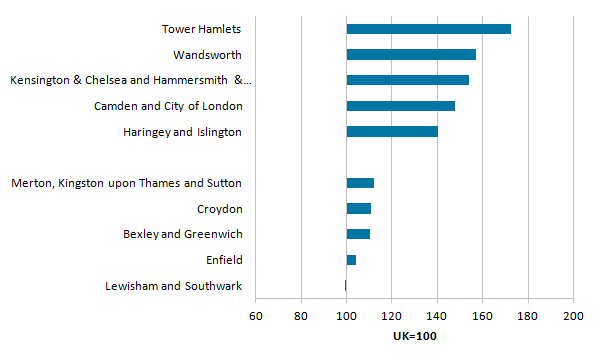
Figure 4 shows the NUTS3 sub-regions in the Greater London area with the highest and lowest productivity levels.
Figure 4: Gross value added per hour worked – highest and lowest ranking NUTS3 sub-regions in London, smoothed, current prices, 2016
Source: Office for National Statistics
Download this image Figure 4: Gross value added per hour worked – highest and lowest ranking NUTS3 sub-regions in London, smoothed, current prices, 2016
.png (9.5 kB) .xlsx (10.9 kB)
Out of the 21 NUTS3 sub-regions in the Greater London area, 20 displayed productivity levels above the UK average in 2016. The highest level was in Tower Hamlets, with a productivity level 72% above the UK average. This was followed by Wandsworth, Kensington and Chelsea and Hammersmith and Fulham, and Camden and City of London, with productivity levels between 57% and 48% above the UK average. The lowest levels of labour productivity in London were in Lewisham and Southwark, with labour productivity 1% below the UK average.
Results for the south of England (excluding London)
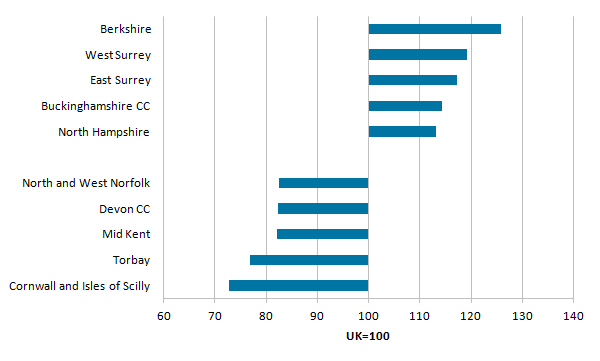
Figure 5 shows the highest and lowest levels of productivity in the NUTS3 sub-regions in the south of England (excluding London), which includes sub-regions in the South East, South West and East of England regions of England.
Figure 5: Gross value added per hour worked – highest and lowest ranking NUTS3 sub-regions in the south of England (excluding London), smoothed, current prices, 2016
Source: Office for National Statistics
Download this image Figure 5: Gross value added per hour worked – highest and lowest ranking NUTS3 sub-regions in the south of England (excluding London), smoothed, current prices, 2016
.png (8.4 kB) .xlsx (10.8 kB)
The most productive areas of the south of England outside Greater London had productivity levels well above the UK average. Berkshire and West Surrey respectively displayed productivity levels around 26% and 19% above the UK average, the highest levels outside of London. Overall, 18 out of 49 NUTS3 sub-regions in the south of England had productivity levels above the UK average. The lowest labour productivity levels in 2016 in the south of England (excluding London) were generally in rural or coastal areas. The lowest was in Cornwall and Isles of Scilly, followed by Torbay.
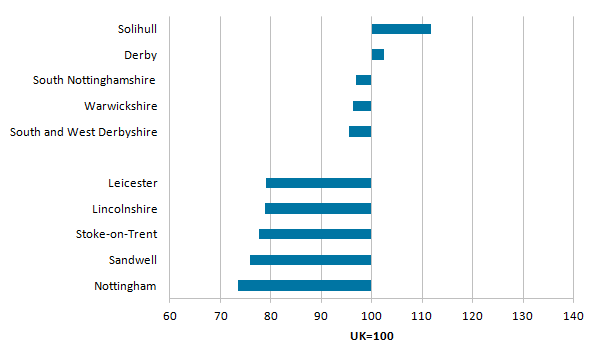
Results for the Midlands
Figure 6 shows the NUTS3 sub-regions with the highest and lowest levels of productivity in the Midlands, comprising the West Midlands and East Midlands regions. There were two NUTS3 sub-regions with productivity levels above the UK average in 2016. Solihull had the highest productivity level, at 12% above the UK average. This was followed by Derby, at 2% above the UK average.
At the other end of the distribution, productivity levels of over 20% below the UK average were registered in each of the five sub-regions with the lowest productivity, with the two lowest levels in Nottingham and Sandwell.
Figure 6: Gross value added per hour worked – highest and lowest ranking NUTS3 sub-regions in the Midlands, smoothed, current prices, 2016
Source: Office for National Statistics
Download this image Figure 6: Gross value added per hour worked – highest and lowest ranking NUTS3 sub-regions in the Midlands, smoothed, current prices, 2016
.png (7.8 kB) .xlsx (10.8 kB)
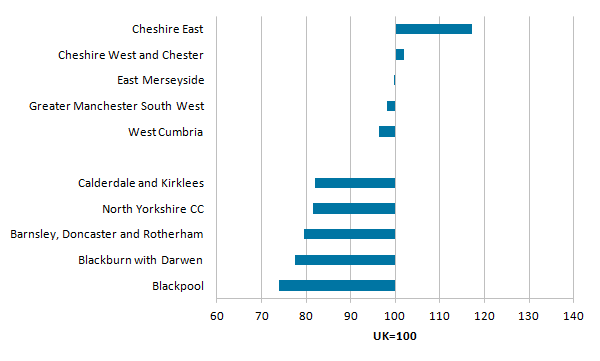
Results for the north of England
Figure 7 shows the NUTS3 sub-regions with the highest and lowest levels of productivity in the north of England, comprising the North West, North East and Yorkshire and The Humber regions. The highest labour productivity was in Cheshire East, with a productivity level of 17% above the UK average in 2016. This was followed by Cheshire West and Chester, and East Merseyside, with productivity similar to the UK average (note that these NUTS3 areas all include car manufacturing plants).
The lowest productivity performance was recorded in Blackpool, with a productivity level 26% below the UK average (or 19% below a UK excluding London average). Both Blackburn with Darwen, and Barnsley, Doncaster and Rotherham NUTS3 areas also had productivity levels 21% or more below the UK average.
Figure 7: Gross value added per hour worked – highest and lowest ranking NUTS3 sub-regions in the north of England, smoothed, current prices, 2016
Source: Office for National Statistics
Download this image Figure 7: Gross value added per hour worked – highest and lowest ranking NUTS3 sub-regions in the north of England, smoothed, current prices, 2016
.png (9.4 kB) .xlsx (10.9 kB)
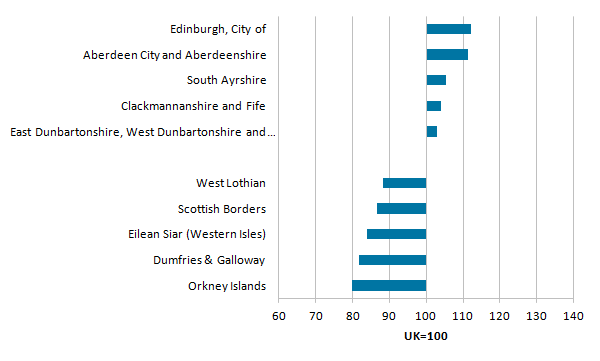
Results for Scotland
Figure 8 shows the productivity ranking of NUTS3 sub-regions for Scotland, focusing on the sub-regions with the highest and lowest levels of productivity. City of Edinburgh had the highest labour productivity in 2016 at 12% above the UK average. Aberdeen City and Aberdeenshire, which had the highest labour productivity during the previous decade to 2015, is now second in the list, with a productivity level 11% above the UK average.
Six of the 23 NUTS3 regions in Scotland had labour productivity above the UK average in 2016, while 14 out of the 23 regions were above a UK excluding London average. The lowest productivity levels were found within the Highlands and Islands area of Scotland or in the rural regions bordering England (Dumfries and Galloway, and Scottish Borders).
Figure 8: Gross value added per hour worked – highest and lowest ranking NUTS3 sub-regions in Scotland, smoothed, current prices, 2016
Source: Office for National Statistics
Download this image Figure 8: Gross value added per hour worked – highest and lowest ranking NUTS3 sub-regions in Scotland, smoothed, current prices, 2016
.png (9.6 kB) .xlsx (10.9 kB)
Results for Wales
Figure 9 shows the ranking of productivity levels for all NUTS3 sub-regions in Wales. Productivity levels in all NUTS3 sub-regions in Wales were below the average for the UK. The NUTS3 sub-region with the highest level of labour productivity was Central Valleys, with a productivity level 6% below the UK average, followed by Flintshire and Wrexham in north Wales, at 8% below the UK average. The lowest labour productivity performance was in the rural sub-region of Powys, with a productivity level 35% below the UK average, the lowest level in the UK.
Figure 9: Gross value added per hour worked – NUTS3 sub-regions in Wales, smoothed, current prices, 2016

Source: Office for National Statistics
Download this image Figure 9: Gross value added per hour worked – NUTS3 sub-regions in Wales, smoothed, current prices, 2016
.png (10.5 kB) .xlsx (11.0 kB)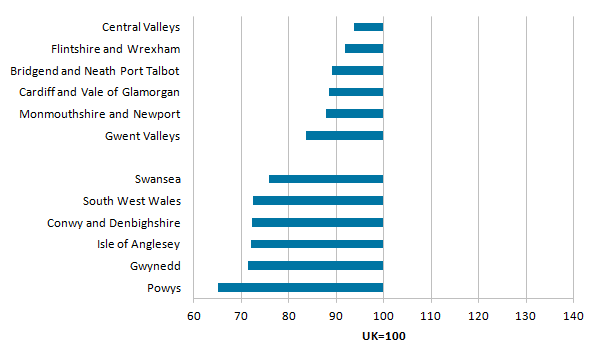
6. Results for local enterprise partnerships and city regions
This section presents results for the English local enterprise partnerships (LEPs) and 14 of the largest UK city regions. In both cases, the productivity data are compiled to be consistent with the data for Nomenclature of Territorial Units for Statistics (NUTS) regions and sub-regions presented in previous sections. The data presented are nominal data measured in current prices1.
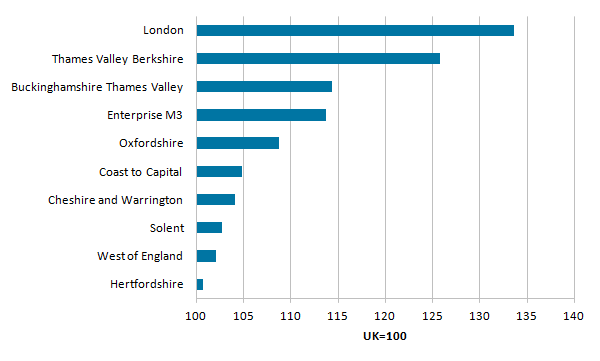
In 2016, London was the LEP with the highest productivity level, at 34% above the UK average. The London LEP was followed by Thames Valley Berkshire, with a slightly lower productivity level of about 26% above the national average. The top six performing LEPs shown in Figure 10 were located within the regions of the Greater South East (East of England, South East, and London). In total, there were 10 LEPs with gross value added (GVA) per hour worked above the UK average (a further six LEPs had productivity above a UK excluding London average).
Figure 10: Gross value added per hour worked – highest ranking English local enterprise partnerships, smoothed, current prices, 2016
Source: Office for National Statistics
Download this image Figure 10: Gross value added per hour worked – highest ranking English local enterprise partnerships, smoothed, current prices, 2016
.png (8.3 kB) .xlsx (10.9 kB)
The LEPs with the lowest GVA per hour worked were a mix of rural and urban areas, as shown in Figure 11. The lowest labour productivity in 2016 was in Cornwall and Isles of Scilly. Other largely rural LEPs with relatively low labour productivity included Heart of the South West, Greater Lincolnshire, and The Marches.
Meanwhile, Black Country and Sheffield City Region were examples of predominantly urban areas with relatively low productivity levels. All the previously mentioned LEPs, along with Stoke-on-Trent and Staffordshire LEP, had labour productivity levels at least 17% below the UK average in 2016 (or at least 10% below a UK excluding London average).
Figure 11: Gross value added per hour worked – lowest ranking English local enterprise partnerships, smoothed, current prices, 2016

Source: Office for National Statistics
Download this image Figure 11: Gross value added per hour worked – lowest ranking English local enterprise partnerships, smoothed, current prices, 2016
.png (9.2 kB) .xlsx (11.0 kB)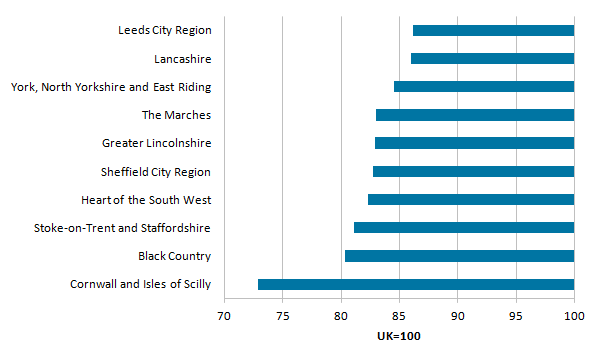
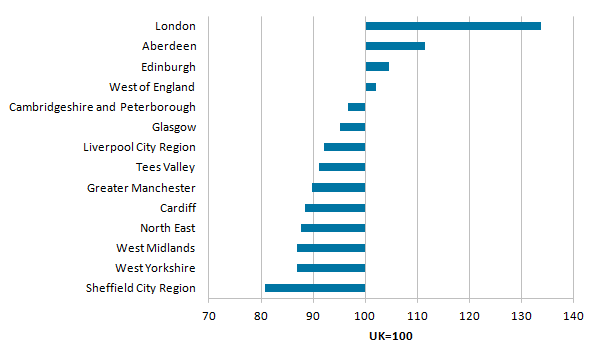
Figure 12 provides labour productivity for 14 of the largest UK city region areas in 2016. City regions are of particular policy interest at the present time. In England, a number of city region areas have been granted increased devolution powers over recent years, while in Scotland and Wales, city deals have been agreed between some city regions and the UK government.
As with the earlier regional data, London had the highest labour productivity. It was followed by the Aberdeen City Region, with a productivity level 11% above the UK average. Edinburgh and West of England (Bristol) City Regions both had productivity levels above the UK average, while Cambridgeshire and Peterborough, and Glasgow both had productivity levels 3% to 5% below the UK average. The city regions in the north and Midlands of England had productivity between 8% and 19% below the UK average; Sheffield City Region had the lowest productivity.
Figure 12: Gross value added per hour worked – largest UK city regions, smoothed, current prices, 2016
Source: Office for National Statistics
Download this image Figure 12: Gross value added per hour worked – largest UK city regions, smoothed, current prices, 2016
.png (10.0 kB) .xlsx (11.0 kB)
Notes for: Results for local enterprise partnerships and city regions
- At present, constant price (“real”) GVA(B) data are only available for NUTS1 or NUTS2 areas. In many cases, LEP or city region geographies do not match the NUTS boundaries and therefore when presenting full coverage of LEPs or city regions, we can only do this using nominal data. However, in cases where a LEP or city region does match a NUTS2 boundary, users may wish to consult the published data on NUTS2 areas for LEP or city region data that have been calculated in real terms.
7. Results showing “real” estimates of labour productivity
This release is the first time we have published real labour productivity data for NUTS1 and NUTS2 regions (as defined by the Nomenclature of Territorial Units for Statistics (NUTS) classification) and countries, rather than just nominal data. The real data allow us to understand whether there has been any increase in volumes of goods and services, with the effects of changes in prices removed. By contrast, when using nominal current price data, as used in the rest of the article, it is not possible to differentiate between the effects of price changes and quantity changes. However, it should be noted that the gross value added (GVA) data that these real data are based on are currently classified as “Experimental Statistics” (see the “Things you need to know” section) and that is also the case for the results in this section.
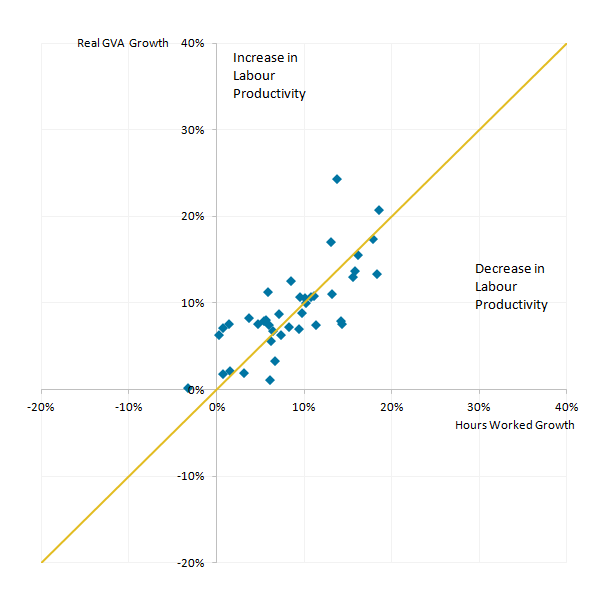
Labour productivity is calculated as economic output (measured by GVA) divided by total hours worked. Figure 13 shows total growth in real economic output (GVA) plotted against changes in total hours worked for each of the 40 NUTS2 areas for the 2011 to 2016 period. Only 20 areas experienced real productivity growth over the 2011 to 2016 period (those above the diagonal line for which growth in GVA exceeded growth in hours worked). For the remaining 20 areas, which include a majority of the English sub-regions, productivity levels were lower in 2016 than in 2011.
Figure 13: Scatter plot of total growth in real gross value added compared with total growth in hours worked for NUTS2 sub-regions of the UK, 2011 to 2016
Source: Office for National Statistics
Download this image Figure 13: Scatter plot of total growth in real gross value added compared with total growth in hours worked for NUTS2 sub-regions of the UK, 2011 to 2016
.png (15.5 kB) .xlsx (15.0 kB)
Also observable from Figure 13 is the fact that for most NUTS2 regions the growth in economic output (GVA) mirrored a similar growth in hours worked, resulting in only small changes in real labour productivity over the 2011 to 2016 period. This is in line with the situation nationally where labour productivity growth has been subdued over this period.
It is worth noting from Figure 13 that even when changes to labour productivity were small, the absolute growth of GVA and hours worked often varied quite substantially between different regions. For example, in Inner London West, GVA and hours worked grew by 21% and 19% respectively between 2011 and 2016, while in East Yorkshire and Northern Lincolnshire, GVA growth was zero while hours worked fell by 3% over the same period. These GVA and hours worked data show that very different economic pathways occurred in the two regions over this period, even though both ultimately resulted in only very small changes in each area’s respective labour productivity levels.
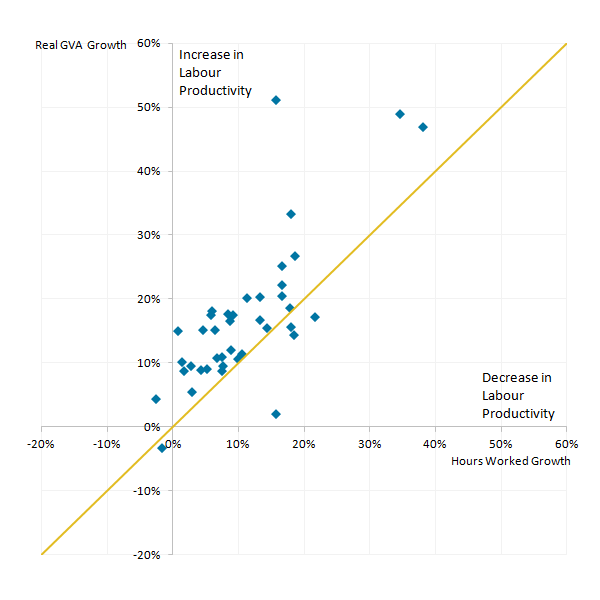
Figure 14 shows the same chart but for the longer period of 2004 to 2016. This is currently the full period for which we have the experimental NUTS2 real labour productivity data available. The chart again shows some wide divergence in economic outcomes with Inner London West, Inner London East and North Eastern Scotland all witnessing strong growth in real GVA over the period accompanied by an increase in real labour productivity levels. By contrast, in East Yorkshire and Northern Lincolnshire, both real GVA and real labour productivity declined slightly over this 12-year period.
Figure 14: Scatter plot of total growth in real gross value added compared with total growth in hours worked for NUTS2 sub-regions of the UK, 2004 to 2016
Source: Office for National Statistics
Download this image Figure 14: Scatter plot of total growth in real gross value added compared with total growth in hours worked for NUTS2 sub-regions of the UK, 2004 to 2016
.png (18.2 kB) .xlsx (16.7 kB)
8. Alternative results excluding rental income
This section briefly assesses the impact on the labour productivity data from excluding imputed rental income from the calculations. The reason for including this section is that it can be argued that not all gross value added (GVA) components are equally relevant when assessing labour productivity, as some elements of GVA are not directly related to the input of labour. In particular, imputed rental incomes, such as imputed rental values capturing the value of housing services accruing to owner-occupiers, could be excluded from the total GVA to obtain a measure of output more closely related to the measurable labour input.
Therefore, we have calculated data that excludes imputed rentals from the GVA used in the productivity calculations. These data discuss the impact of this calculation when comparing the results with the data used in the earlier sections of the article (where all components of GVA are included in the productivity calculations).
Table 1 shows the effect of excluding rental incomes on NUTS1 (as defined by the Nomenclature of Territorial Units for Statistics (NUTS) classification) GVA per hour worked, calculated in nominal terms in current prices. It shows that the productivity advantage of London and the South East is slightly reduced if imputed rentals are excluded. The changes are generally moderate; however, there are some larger changes at smaller geographies and these are illustrated in Figures 15 and 16.
Table 1: Labour productivity (gross value added per hour worked) including and excluding imputed rental incomes, 2016 (UK equals 100), current prices
| Regions | GVA per Hour (including rent) | GVA per hour (excluding rent) | |||||||
|---|---|---|---|---|---|---|---|---|---|
| North East | 88.9 | 90.2 | |||||||
| North West | 92.6 | 93.8 | |||||||
| Yorkshire and The Humber | 84.8 | 86.1 | |||||||
| East Midlands | 85.7 | 86.8 | |||||||
| West Midlands | 87.3 | 88.4 | |||||||
| East of England | 94.7 | 94.5 | |||||||
| London | 133.3 | 132.1 | |||||||
| South East | 106.1 | 103.9 | |||||||
| South West | 90.7 | 89.8 | |||||||
| Wales | 83.1 | 83.6 | |||||||
| Scotland | 99.4 | 100.8 | |||||||
| Northern Ireland | 83.2 | 84.6 | |||||||
| Source: Office for National Statistics | |||||||||
Download this table Table 1: Labour productivity (gross value added per hour worked) including and excluding imputed rental incomes, 2016 (UK equals 100), current prices
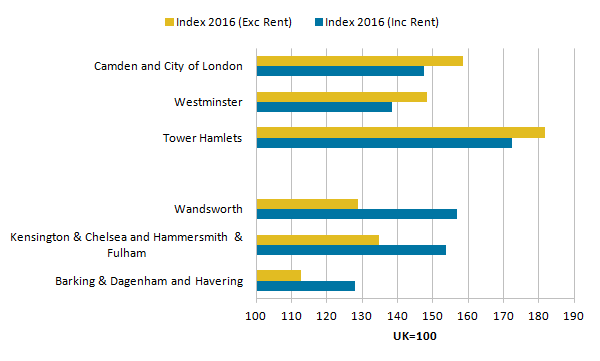
.xls (27.6 kB)The largest NUTS3 changes are in London, where the exclusion of imputed rental incomes increases levels of relative labour productivity in some areas (for example, Tower Hamlets, Westminster, Camden and City of London), while reducing relative labour productivity in other areas (for example, Wandsworth, Kensington and Chelsea and Hammersmith and Fulham, Barking and Dagenham and Havering). These changes make quite a large difference to the relative productivity values.
Figure 4 earlier in the article showed Wandsworth as having the second largest labour productivity in London behind Tower Hamlets when total GVA is used in the calculations. However, Wandsworth drops down the rankings if imputed rental incomes are removed, with Camden and City of London taking its place as having the second-highest productivity behind Tower Hamlets.
Figure 15: Impact of excluding imputed rental incomes on gross value added per hour worked – London sub-regions with largest index change, 2016
Source: Office for National Statistics
Download this image Figure 15: Impact of excluding imputed rental incomes on gross value added per hour worked – London sub-regions with largest index change, 2016
.png (8.5 kB) .xlsx (11.6 kB)
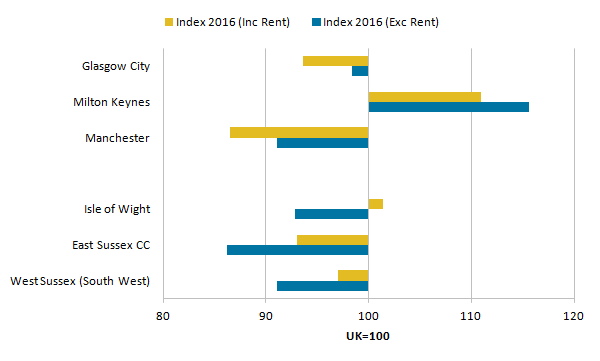
Excluding imputed rental incomes also affects areas outside of London, albeit to a smaller extent. Figure 16 shows that Manchester, Milton Keynes and Glasgow City all have a higher relative labour productivity value if imputed rentals are excluded than is the case with total GVA used in the calculations. By contrast, the Isle of Wight, East Sussex and West Sussex (South West) all have a reduction in their relative labour productivity values if imputed rentals are removed.
Figure 16: Impact of excluding imputed rental incomes on gross value added per hour worked – UK (non-London) sub-regions with largest index change, 2016
Source: Office for National Statistics
Download this image Figure 16: Impact of excluding imputed rental incomes on gross value added per hour worked – UK (non-London) sub-regions with largest index change, 2016
.png (7.2 kB) .xlsx (11.5 kB)
Table 2 shows the impact of removing rental incomes for the latest 2016 data for city regions and combined authorities. Except for London1, every city region or combined authority has a higher productivity index with rental incomes excluded compared with the headline data including rental incomes.
Table 2: Labour productivity (gross value added per hour worked) including and excluding imputed rental incomes for city regions, 2016 (UK equals 100), current prices
| City Regions | GVA per hour (including rent) | GVA per hour (excluding rent) | ||||
|---|---|---|---|---|---|---|
| London | 133.7 | 132.7 | ||||
| Aberdeen | 111.4 | 113.4 | ||||
| Edinburgh | 104.5 | 105.2 | ||||
| West of England | 102.1 | 103.6 | ||||
| Cambridgeshire and Peterborough | 96.7 | 98.4 | ||||
| Glasgow | 95.1 | 97.7 | ||||
| Liverpool City Region | 92.1 | 93.1 | ||||
| Tees Valley | 91.1 | 92.4 | ||||
| Greater Manchester | 89.8 | 91.5 | ||||
| Cardiff | 88.4 | 89.4 | ||||
| North East | 87.6 | 88.9 | ||||
| West Midlands | 86.8 | 89.2 | ||||
| West Yorkshire | 86.8 | 89.1 | ||||
| Sheffield City Region | 80.8 | 82.2 | ||||
| Source: Office for National Statistics | ||||||
Download this table Table 2: Labour productivity (gross value added per hour worked) including and excluding imputed rental incomes for city regions, 2016 (UK equals 100), current prices
.xls (27.6 kB)If you wish to investigate this issue of rental incomes in more detail, data are available in the dataset accompanying this article for productivity calculated excluding rental incomes for NUTS1, NUTS2 and NUTS3 geographies.
Notes for: Alternative results excluding rental income
- Note that the data for London differ slightly between Tables 1 and 2 because NUTS1 data are calculated using unsmoothed data and city regions data are calculated using smoothed data (see the “Methodology” section for more details).
9. Methodology
Estimates of regional productivity are calculated based on the Office for National Statistics (ONS) regional gross value added (GVA) data, which are published each December. In the most recent release of this regional GVA data, a new improved methodology was adopted, known as regional balanced GVA (GVA(B)). This measure “balances” the income and production approaches to measuring the economy into a single estimate at a regional level. It is being introduced to replace the previous method, which calculated regional GVA based on the income method alone.
An advantage of the new method is that, for the first time, it allows ONS regional labour productivity estimates to be calculated in “real” terms through the production of constant price estimates. These real data allow a greater understanding of time-series growth in regional productivity. These experimental estimates have been derived for NUTS1 and NUTS2 areas (as defined by the Nomenclature of Territorial Units for Statistics (NUTS) classification) by deflating the current price estimates for 112 industries using national industry deflators.
It should be noted that the National Statistic for regional labour productivity at NUTS1 level remains that based on the long-standing GVA income approach (GVA(I)) method. These data are available in the tables accompanying the Labour productivity bulletin. A consultation to consider shifting this NUTS1 National Statistic to using the GVA(B) method will be carried out prior to the April 2018 release of the ONS Labour productivity bulletin.
For data on labour productivity for NUTS2 and NUTS3 sub-regions, together with local enterprise partnerships and city regions, we recommend using the new GVA(B) data, which is considered to provide improved GVA estimates. As such, this Regional and sub-regional productivity article has been based on the new GVA(B) data, providing analysis and data across these local geographies together with some experimental analysis of the GVA(B) data for NUTS1 regions.
The sub-regional productivity data (for NUTS2 and NUTS3 geographies and city regions) in this article are compiled to be consistent with the regional productivity GVA(B) data for NUTS1 regions. The sub-regional productivity data using the GVA(B) approach are Experimental Statistics.
Data accompanying this article are based on the NUTS geographical classification that came into force on 1 January 2015. More details on the changes introduced by the new NUTS classification are provided in the “Geographies” part of this section.
Components of productivity data
Productivity estimates presented in this article use gross value added (GVA), productivity jobs and productivity hours data. The methodology requires ensuring that the sub-regional measures of GVA, jobs and hours are all consistent with the regional totals. The methodology is therefore concerned with how best to apportion the regional totals to the sub-regional areas. The approach taken is detailed in this section.
GVA: income, production and balanced approach
This output uses the published regional gross value added (GVA) data from our regional GVA publication. The unsmoothed data are published on a workplace basis for NUTS1, NUTS2 and NUTS3 geographies, as defined by the Nomenclature of Territorial Units for Statistics (NUTS) classification. GVA is preferable to gross domestic product (GDP) at the regional level because it excludes taxes and subsidies on products that are difficult to attribute to local units.
In previous years, estimates of regional and sub-regional GVA growth in nominal terms were available using the GVA income approach (GVA(I)). The GVA(I) is measured at current basic prices only, therefore does not allow for different regional price levels or changes in prices over time (inflation). More recently, an alternative measure of regional and sub-regional GVA using the production approach (GVA(P)) was developed. GVA(P) is calculated as the total output of goods and services less the value of goods and services used in the production process. The production approach to compile GVA is conceptually equivalent to the income approach, but allows deflation of current prices to produce constant price measures, since the production components relate to goods and services that can be broken down into price and volume indices. Therefore, GVA(P) provides the estimates of regional and sub-regional GVA growth in both real and nominal terms.
Consequently, to provide users with a single definitive measure of GVA, a balanced GVA approach (GVA (B)) has been developed by taking the strengths from both GVA(I) and GVA(P) approaches, and using them to produce a new balanced measure of regional GVA. The balanced GVA estimates use a matrix of paired quality metrics for each region, by industry, by year. These quality metrics are compiled by assessing the quality of each component that feeds into either of the two measures and multiplying it by the weight that component represents in the GVA estimate. The balancing process to obtain a single measure of GVA is similar to the balancing process used for measuring the national gross domestic product (GDP) data, compiled using the income, expenditure and production approach. For more information on how the balanced GVA is developed, please refer to the recent release of the regional accounts article, December 2017.
Constant price GVA(B) is derived by deflating the current price estimates for each of the 112 industries using national industry deflators obtained from the UK GDP (output) system. These deflators are consistent with the UK National Accounts Blue Book 2017. The Eurostat Manual on Regional Accounts (2013) recommends that in the absence of regional prices the use of national deflators is acceptable, provided the deflation occurs at minimum level of 38 industries.
Jobs
At the regional level, GVA per filled job is calculated using a "productivity jobs" series as the denominator. This is compiled from four components:
- employee jobs
- self-employed jobs
- government-supported trainees (GST)
- members of Her Majesty’s Forces
For consistency purposes, the regional "productivity jobs" series is benchmarked to the national "productivity jobs" series, on a quarterly basis. To produce annual totals for regional productivity jobs, an average of the four quarters in the year is taken.
For sub-regional geographies, the "total jobs" data series is used to apportion regional productivity jobs to NUTS2 and NUTS3 sub-regions. This total jobs measure is a workplace-based measure of jobs that we produce mainly for use in calculating job densities at regional and sub-regional level. Total jobs data comprise employees (from the Business Register Employment Survey), self-employment jobs (from the Annual Population Survey), government-supported trainees (from Department for Education and Department for Work and Pensions) and HM Forces (from Ministry of Defence).
The total jobs series is used to calculate the proportions of regional jobs within each sub-region for each year. These results are then used to apportion the regional "productivity jobs" data series to the sub-regional level.
Hours
At the national and regional level, GVA per hour worked data are calculated using a "productivity hours" series as the denominator. These data are calculated quarterly, based mostly on the Labour Force Survey (LFS), and an annual total is constructed as the average of the four quarters in the calendar year.
At sub-regional level, only annual productivity data are being produced. Therefore, the Annual Population Survey (APS) is used rather than the LFS as it has a larger sample size1. The process involves calculating total hours for each sub-region as the sum of employee hours, self-employment hours, hours worked in government training schemes and hours worked by HM Forces.
Employee hours are calculated by using the APS to estimate, for each sub-region, the average hours worked per employee job by industry. These industry average hours are then multiplied by the number of employee jobs for each industry in each sub-region. For the period from 2009 onwards, the number of employee jobs by industry is derived from the Business Register and Employment Survey (BRES). Prior to that, employee jobs by industry were derived from the Annual Business Inquiry (ABI)2.
Self-employment hours are calculated from the APS. For government training schemes and HM Forces, the regional totals are allocated to sub-regions based on each sub-region’s share of regional employee plus self-employment hours, as calculated in the previous stage. Adding together the sum of employee hours, self-employment hours, hours worked in government training schemes and hours worked by HM Forces provides a total hours estimate for each sub-region. Once calculated, these NUTS2 and NUTS3 sub-regional data are then constrained regionally to the NUTS1 “productivity hours” data to ensure consistency with regional productivity data.
Smoothing
Time series data presented in this publication cover a period of up to 14 years. However, caution is needed when carrying out a change over time analysis of the sub-regional productivity data using the unsmoothed data. Particularly for NUTS3 data, there is volatility in the data that arise from the smaller survey samples inherent within estimates for smaller geographic areas. It is for this reason that smoothed sub-regional productivity data are presented in this article for the NUTS 3 sub-regions. The smoothed data reduce the volatility by using weighted data from up to five years in producing the estimate for each year.
When using this smoothed data for time-series analysis, examining a particular year-on-year change does not really make sense, because each year’s data are already a weighted average of a number of different years. Therefore, to examine a year-on-year change, for example, from 2015 to 2016, the only suitable method would be to use the unsmoothed data that are available in the accompanying datasets. However, because of the volatility of the data, this year-on-year change may well be due to the volatility arising from the sample errors, as opposed to a "true" change in the data. Furthermore, in the absence of confidence intervals for the sub-regional productivity data, it is very difficult to determine which is the case.
In view of this, time-series analysis of the sub-regional productivity data is better done over a longer period. Trends over a longer period are less likely to be the result of the volatility around any single year estimate and more likely to be showing a change in the economic performance of the sub-region. Such a trend should show up in the smoothed data, as well as the unsmoothed data, so using the smoothed data is appropriate when considering the trend over the full data time series.
The results presented in this article are based on the smoothed sub-regional productivity data series for all geographies except for NUTS1 and NUTS2, which uses the unsmoothed data. It should be noted that when calculating the sub-regional productivity data, unsmoothed data have been used at all times. The smoothing process has only been applied to the final results. Both the smoothed and unsmoothed results are included in the datasets accompanying this article. Please note that NUTS1 data published in the quarterly Labour productivity bulletin are an unsmoothed measure.
Geographies
A number of our regional and sub-regional outputs are produced based on the Nomenclature of Territorial Units for Statistics (NUTS) geographies. These include regional and sub-regional GVA. These GVA data are an input in the calculation of sub-regional productivity. Each NUTS3 sub-region covers the same area as either a single local authority or a combination of two or more adjacent local authorities. The data accompanying this article are published on the NUTS geographical classification that came into force on 1 January 2015:
- NUTS1: Wales, Scotland, Northern Ireland and the nine English regions
- NUTS2: 40 sub-regions – mainly groups of counties and unitary authorities
- NUTS3: 173 local areas – primarily individual counties and unitary authorities
- the term Extra-Regio is applied to an economic activity that cannot be assigned to any specific region within a country
In England, a number of city region areas have been granted increased devolution powers over recent years, while in Scotland and Wales city deals have been agreed between some city regions and the UK government. Therefore, whilst it should be noted that there is no official city regions geography for the UK, the list of areas included (and the boundaries chosen) in this article are as close as possible to those used in the recent devolution and city deal agreements. Where no deal has been made to date, the boundaries reflect those in combined authority proposals, or in discussions occurring locally around greater joint working, or follow a local enterprise partnership (LEP) boundary.
It should be noted that the NUTS3 region boundaries are not an exact match for Cardiff, Glasgow, Edinburgh or West of England City Regions. Therefore, to calculate city region data in this article we have additionally included Neath Port Talbot in Cardiff City Region, Clackmannanshire in Edinburgh City Region, part of Argyll and Bute in Glasgow City Region, and North Somerset in West of England so that we can build the data up from the published NUTS3 level. This is unlikely to impact any of the trends shown in this report but does mean the statistics used slightly overstate the size of these three city regions.
Every local authority in England belongs to at least one LEP. However, some local authorities belong to more than one LEP. In each case, the LEP boundaries used have been an amalgamation of one or more local authority. In other words, for each local authority associated with a LEP, data covering the whole of that local authority are included within the LEP data.
There are two cases however, where the working boundaries of a LEP cut through existing local authority boundaries. These are Enterprise M3 and Solent LEPs where parts of the local authorities of New Forest, Test Valley, Winchester and East Hampshire are in the Enterprise M3 LEP while parts are in the Solent LEP. As in other recent publications, it has been decided that the whole of these affected local authorities should be allocated to the Enterprise M3 LEP, and to not include them in the estimates for the Solent LEP.
From 1 April 2017, the Northamptonshire LEP is merged with the South East Midlands LEP, reducing the number of LEPs from 39 to 38.
Revisions
The biggest change introduced this year is that, for the first time, we use the balanced gross value added (GVA(B)) approach to calculate the productivity estimates for UK regions and sub-regions. Based on the GVA(B) measure, the labour productivity estimates are provided in both “real” and “nominal” terms.
As we make use of the new gross value added (GVA) balanced approach, all data provided in this article are new.
There have been changes made to the UK National Accounts measure of GVA, which has an impact on the regional GVA estimates in the form of different national totals for the various components of income. Of these, there is an improved method for allocating owner-occupied imputed rental (OOIR) for privately-rented dwellings and there is a move to a region-based data source that is consistent with the method used in Blue Book 2017.
In October 2015, housing associations were reclassified from the private sector to the public corporations sector with effect from 22 July 2008. This change was implemented in public sector finances in 2016 and in Blue Book 2017 for the UK National Accounts. For further details on all other revisions, please refer to the recent release of the regional accounts article, December 2017.
Sub-regional productivity jobs and productivity hours data have also been revised in comparison with the article published in January 2017. This follows from a number of factors including the annual reweighting of the Labour Force Survey to match with the latest population data.
Timeliness
The timeliness of the data is determined by the release calendar of the regional GVA data, the total jobs data and the Annual Population Survey from which the hours worked are extracted. Sub-regional GVA data for 2017 will be available in December 2018 and an update to this article will follow shortly afterwards.
Future work plans
Currently, the estimates of balanced gross value added (GVA(B)) in real terms are only provided for NUTS1 and NUTS2 levels of geography. In December 2018, it is planned to provide these data for other geographies. This should enable “real” labour productivity data to be provided for local enterprise partnerships, city regions and NUTS3 areas in the next edition of this bulletin in early 2019.
Notes for: Methodology
- For 2005, it was not possible to use Annual Population Survey (APS) data, therefore Labour Force Survey (LFS) data were used – with the average taken of the four LFS surveys carried out in 2005.
- Business Register and Employment Survey (BRES) data are used for 2009 onwards based on the 2007 UK Standard Industrial Classification (SIC 2007). For data up to 2008, the Annual Business Inquiry (ABI) is used and this is based on the 1992 UK Standard Industrial Classification (SIC 1992).