Cynnwys
- Main points
- Introduction to the capital stocks user guide
- Statistics for publication
- Methodology of capital stocks and consumption of fixed capital estimates
- Perpetual inventory method inputs, gross fixed capital formation estimates
- Other changes in volume
- Deflators
- Asset service lives and depreciation profiles
- Glossary
- Future developments
- Acknowledgements
- Related links
1. Main points
The UK is the first country to introduce full transparency in the production system used to measure capital stocks estimates, giving users autonomy to observe the impact of different assumptions and forecast future estimates of capital.
The Office for National Statistics (ONS) introduces the code used to estimate capital stocks and consumption of fixed capital estimates, using the Perpetual Inventory Method (PIM), making this accessible to all users in Github.
Input sources used to estimate capital stocks and consumption of fixed capital formation are now available to users, including the capital investment, asset service lives and depreciation profiles by asset and industry.
2. Introduction to the capital stocks user guide
We produce capital stocks and consumption of fixed capital statistics that are published under the National Statistics logo. This designation guarantees that those outputs have been produced to high professional standards set out in the Code of Practice for Statistics, and have been produced free from any political interference.
This user guide provides information on the collection, production and quality of our capital stocks and consumption of fixed capital estimates in our Capital stocks and consumption of fixed capital, UK: 2021 bulletin, and The national balance sheet and capital stocks, preliminary estimates, UK: 2022 bulletin.
The capital stocks and consumption of fixed capital estimates are national statistics, published towards the end of the calendar year, after the Blue Book annual publication. The national balance sheet and capital stocks preliminary estimates are experimental statistics, introduced in April 2021, in response to more imminent user requirements during coronavirus (COVID-19), to support budgetary forecasting. These preliminary datasets provide indicative estimates, approximately four months after the reference year. They use capital investment data from our Quarterly sector accounts, UK: October to December 2020 bulletin. These data present the first estimates for the fourth quarter of the year, providing one of the earlier estimates for the reference year.
The National Statistics and experimental statistics publications include the same datasets.
The national statistics data series used in the capital stocks and consumption of fixed capital estimates use supply-use balanced gross fixed capital formation (GFCF) data up to the reference year.
Estimates of fixed capital consumption are also included in The Blue Book (the UK’s official annual national accounts statistics) of the corresponding period. These estimates may differ from those presented in the capital stocks and consumption of fixed capital estimates, published in December. This is because of timetable constraints in the annual Blue Book compilation cycle which are unable to incorporate final supply-use balanced estimates of GFCF in the production of capital stocks estimates in the Blue Book.
There are several annual publications that present estimates of capital stocks and consumption of fixed capital estimates, which are:
the national balance sheet and capital stocks, preliminary estimates, UK: 2022 bulletin (experimental statistics), the version of capital investment data used is consistent with capital stocks and consumption of fixed capital, apart from the latest two years which use data from the quarterly sector accounts; its earliest available publication date is approximately four months after the reference period
the Blue Book (National Statistics), which uses early supply-use balanced data; its earliest available publication date is approximately 10 months after the reference period
the capital stocks and consumption of fixed capital, UK: 2021 bulletin, which uses data consistent with national accounts blue book, includes final supply-use balanced data (subject to adjustments, see Section 5); its earliest available publication date is approximately 11 months after the reference year
3. Statistics for publication
Our suite of capital stocks and consumption of fixed capital statistics include:
over 4,000 series on estimates of gross capital stocks, net capital stocks, consumption of fixed capital broken down by industries, assets and sectors of the economy, presented in current prices and chain-volume measures
over 3,000 time series datasets
over 5,000 series transmitted on the OECD’s database
Capital stocks are a group of products with certain common characteristics that are consistent with the asset boundary definition in the UN’s System of National Accounts 2008. This group of products is known as fixed assets. These are produced assets that are produced as a result of the production process and have a service life in excess of one year. Further information on the asset breakdowns can be found in our Capital stocks and consumption of fixed capital Quality and Methodology Information (QMI). This excludes financial assets.
As these assets contribute to the production function during the accounting period, the fixed capital that is used up needs to be estimated; this is also known as consumption of fixed capital.
We produce estimates of gross capital stock, net capital stock and consumption of fixed capital by asset, industry and sector in current prices, chained-volume measures and previous year’s prices.
Nôl i'r tabl cynnwys4. Methodology of capital stocks and consumption of fixed capital estimates
Capital stocks and consumption of fixed capital (CFC) estimates are produced following international guidance from the OECD’s manual on measuring capital. The estimates use the internationally recommended approach, the perpetual inventory method (PIM).
To produce estimates of capital stocks and consumption of fixed capital we need:
a long time series of investment flows, known as gross fixed capital formation (GFCF) data; the earliest series start in 1828 for dwellings and other buildings and structures
a set of deflators to accompany the investment data
a set of assumptions around the depreciation and retirement profiles of assets, based on the industry they are servicing
a method which is based on the simple concept that stocks consist of cumulated flows of investment, corrected for retirement and efficiency loss; this is the role of PIM
To calculate estimates of capital stocks and consumption of fixed capital we need the following inputs:
- asset lives
- depreciation or retirement function
- discount rate
- gross fixed capital formation time series
Asset lives are combined with the depreciation or retirement function to derive the following profiles:
- age-efficiency profiles
- age-price profiles, derived using discount rates from age-efficiency profiles
- retirement profiles
- cohort combined age-price and retirement profiles
We combine these profiles with gross fixed capital formation to derive the following outputs:
gross stock, which is estimated using retirement profiles
productive stock, which is estimated using age-efficiency profiles
capital services, which are derived from productive stock estimates
net stock, which is estimated using combined retirement and age-price profiles
consumption of fixed capital, which is derived from net stock estimates
Figure 1: The process used to calculate estimates of capital stocks and consumption of fixed capital, following the perpetual inventory method
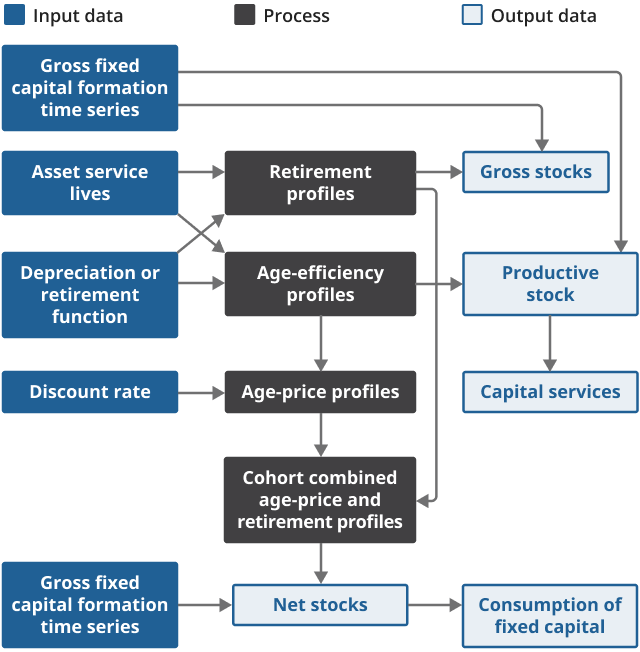
Download this image Figure 1: The process used to calculate estimates of capital stocks and consumption of fixed capital, following the perpetual inventory method
.png (52.0 kB)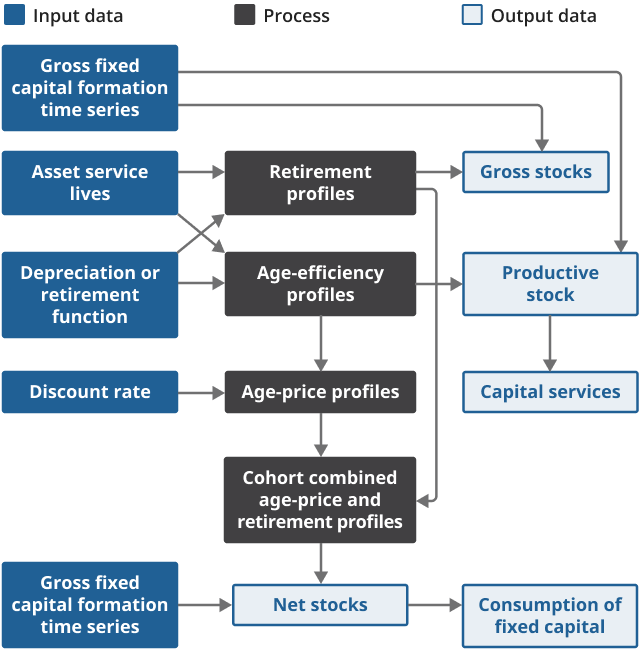
The PIM is used to produce capital stock estimates by taking estimates of GFCF and combining these with age-price profiles and retirement functions.
The capital stocks production system has the flexibility to vary the depreciation method applying a hyperbolic rate to all assets except research and development, which uses a geometric rate. Given the lack of empirical evidence on age-efficiency profiles in the UK, hyperbolic age-efficiency profiles are used. This is in line with other national statistical institutes (US Bureau of Labour Statistics, Australian Bureau of Statistics and Statistics New Zealand). The parameters used for each asset, determining the extent to which the decline in efficiency is weighted towards the end of an asset’s life, are in line with other national statistical institutes. We anticipate reviewing these in the future.
Age-price profiles are derived from the age-efficiency profiles using a real discount rate of approximately 4%. This is broadly consistent with other national statistical institutes that use hyperbolic age-efficiency profiles, and with the HM Treasury guidance regarding discount rates presented in The Green Book.
Two methods were used to produce age-price profiles for a cohort of assets by combining the retirement function and the age-price profile for a single asset.
Most assets involve the calculation of the age-price profile for each asset life from the minimum to the maximum. Each age-price profile is then weighted according to the likelihood that an asset has that life. This is then used to calculate an age-price profile for the cohort.
The second method uses the age-price profile for the longest-lived asset as the age-price profile for the cohort of assets. This method is used for computer hardware, computer software, and cultivated assets.
The PIM estimates 16 produced asset and 64 industry breakdowns using the UK Standard Industry Classification breakdowns (SIC) 2007. Industries 05 to 09 are broken down further into a two-digit SIC level. Table 2 presents the classification of produced assets used in the PIM.
The classification of produced assets used in the PIM are:
AN.111 – dwellings
AN.112 – other buildings and structures
AN.1121 – buildings other than dwellings
AN.1122 – other structures
AN.1123 – land improvements (further broken down into costs of ownership transfer and other land improvements)
AN.113 – machinery and equipment
AN.1131 – transport equipment
AN.1132 (aggregated and allocated to the asset other machinery and equipment for general government) – ICT equipment (broken down between hardware and telecoms)
AN.1133 – other machinery and equipment (broken down between the machinery and equipment itself and a fraction relating to installation costs)
AN.114 - weapons systems (although these assets are calculated separately, they are only published at the combined asset level with machinery and equipment)
AN.115 – cultivated biological resources (consistent with international guidance, estimates of consumption of fixed capital are not estimated for these assets)
AN. 117 – intellectual property products
AN.1171 – research and development
AN.1172 – mineral exploration and evaluation
AN.1173 – computer software and databases (broken down into purchased and own-account software)
AN.1174 – entertainment, literary or artistic originals
5. Perpetual inventory method inputs, gross fixed capital formation estimates
Gross fixed capital formation (GFCF) estimates in current prices are converted into constant prices referenced to the base year. Gross capital stock estimates are calculated by taking estimates of GFCF in constant prices and applying a retirement function.
Net capital stock estimates are produced by accounting for the decline in the value of assets over their lifetime by using an age-price profile. All input data (for example, GFCF, deflators) are compiled on a quarterly basis rather than using annual estimates.
GFCF estimates are broken down by sector, industry, and asset. They are then run through the perpetual inventory method (PIM) to produce current and constant price capital estimates at the same level of detail. Chained volume estimates are subsequently calculated using the current and constant price estimates produced from the PIM.
GFCF estimates used in the production of capital stock estimates, as PIM input series, have the same sectoral estimates as GFCF national accounts series for the public corporations’ sub-sector and the private sector, as a whole. The private sector includes private non-financial corporations, financial corporations, non-profit institutions serving households and the households sectors of the economy.
However, within the private sector, the GFCF PIM input series differ from the national accounts GFCF series for the following sub-sectors of the private sector:
the non-profit institutions serving households (NPISH) sector
the private non-financial corporations sector
the households sector
Private sector GFCF
The sectoral GFCF estimates for the financial corporations sector, and for the dwellings and research and development assets are consistent in national accounts and the PIM inputs.
For the remaining private sector, unadjusted GFCF national accounts estimates are allocated across the sub-sectors using the following fixed proportions:
95% in private non-financial corporations
4% non-profit institutions serving households (NPISH)
1% households, prior to adjustments
These splits are not used as PIM inputs, as this would result in producing estimates of capital stocks and consumption of fixed capital for the NPISH sector in industries where there is no NPISH activity.
The sectoral breakdown of private sector estimates for GFCF PIM inputs are derived using annual business survey (ABS) data calculating capital acquisitions by legal status from 2006 to 2015. With companies and partnerships being mapped to private non-financial corporations, sole traders to households and charities and universities to NPISH (providing the legal status was in an industry in which predominantly NPISH activity took place). Fixed sector splits are created for each industry, by applying the appropriate split using ABS data and sectoral estimates before 1997. Figure 2 shows the differences between the national accounts and PIM input GFCF series for the NPISH sector.
In 2021, PIM input series for GFCF estimates of the NPISH sector, were £170 million higher than the GFCF estimates in the national accounts, in current prices. The largest differences were seen in 2009, where the PIM GFCF input series for this sector were £1.7 billion higher than the national accounts series.
To maintain coherence between the PIM inputs and the national accounts GFCF series for the private sector, at the whole economy, these differences are offset against the PIM inputs in the private non-financial corporations and households sectors.
Figure 2: Capital investment in the non-profit institutions serving households sector used in capital stocks are slightly greater than in national accounts
Capital investment in the non-profit institutions serving households sector, current prices, 1997 to 2021
Source: Office for National Statistics - Capital stocks
Download this chart Figure 2: Capital investment in the non-profit institutions serving households sector used in capital stocks are slightly greater than in national accounts
Image .csv .xlsGeneral government gross fixed capital formation (GFCF)
Industry breakdowns for the general government sector are produced using estimates on a classifications of the functions of government (COFOG) basis and mapping them to the appropriate industry. The asset breakdown of general government GFCF estimates used in the PIM generally align with the national accounts series. Any differentiation between these series is because of the treatment of the transfer of some nuclear power stations, and road de-trunking (the national significance of a road is reduced, and it falls within the responsibilities of local government rather than central government) and the treatment of land, land improvements and transfer costs. Figure 3 shows the differences between the national accounts and PIM inputs GFCF series for the general government sector.
In 2021, PIM input series for GFCF estimates of the general government sector, were £262 million higher than the GFCF estimates in the national accounts, in current prices. The largest differences were seen in 2000, where the PIM GFCF input series for this sector were £2.8 billion higher than the national accounts series.
Figure 3: Capital investment in the general government sector is broadly coherent with the national accounts
Capital investment in the general government sector, current prices, 1997 to 2020
Source: Office for National Statistics - Capital stocks
Download this chart Figure 3: Capital investment in the general government sector is broadly coherent with the national accounts
Image .csv .xlsAsset breakdowns for other buildings and structures
For all sectors in the economy, estimates of GFCF used in the PIM take a combined estimate for other buildings and other structures (AN.112) and separate these into other buildings (AN.1121), other structures (AN.1122), and land improvements (AN.1123). Estimates use data from the Annual Acquisitions and Disposal of Capital Assets Survey (ACAS) from 2014 to 2015.
Nôl i'r tabl cynnwys6. Other changes in volume
Most “other changes in volume” are calculated by adding or subtracting the change in constant prices to gross fixed capital formation (GFCF) estimates.
Where all the capital stock is reclassified to a new sector, for example the privatisation of a public corporation, the capital is moved preserving the asset lives of investment. When a proportion of the capital investment is reclassified, for example one firm in an industry is nationalised, offsetting adjustments are made to move the value of capital to the appropriate sectors.
There are three reasons that other changes in volume are recorded in the capital stocks system: to adjust GFCF estimates, for war losses in World War 2 and reclassifications.
Economic appearances of assets
There are no genuine economic appearances of assets (K1) recorded in relation to capital stocks. However, economic appearances of assets are used to adjust some estimates of GFCF.
The most significant of these relates to the reclassification of British Nuclear Fuels Limited (BNFL) in 2005, from central government to public corporations. This transfer was not included because the historical levels of capital stock are not sufficient to transfer without resulting in significantly negative estimates of capital stock. To mitigate this, an acquisition is created to offset disposals related to the reclassification, while simultaneously applying a disposal to cancel out the acquisition.
Catastrophic losses
The only catastrophic losses recorded are a downward adjustment of £156 million in current prices, applied to other buildings and structures and other machinery, for a single year. These are deflated into constant prices and then processed as part of the perpetual inventory method.
Changes in classification
There are two types of changes in classification, the first is full reclassifications. These occur when the institution that is being reclassified accounts for all the assets in the industry and sector combination, for example the privatisation of British Telecom removed all capital from public corporations in industry 61. In these cases, the assets in that series move between sectors, preserving the initial investment profile and continue to depreciate the assets, within their current life cycle.
The second change is partial reclassifications. These occur when the reclassified institution owns “part” of the assets in the industry or sector series for example, housing associations. Therefore, only “part” of the assets from that industry or sector series, are reclassified between sectors; those belonging to the reclassified institution. In these cases, the initial investment profiles of the reclassified assets are not preserved. They are treated as an acquisition of a “new” asset. They are calculated by creating a disposal for where the assets are being reclassified from, and an acquisition where the assets are being reclassified to.
Nôl i'r tabl cynnwys7. Deflators
For the dwellings and transfer costs assets, implied gross fixed capital formation (GFCF) deflators are used.
All other deflators are calculated by taking product-level deflators and using asset by industry breakdowns of GFCF to weight the importance of various products to produce asset-level deflators.
The benefit of producing deflators that vary by industry and asset is that prices of assets can differ between industries. For example, deflators for transport equipment in the air transport industry differ from deflators for the water transport industry.
Nôl i'r tabl cynnwys8. Asset service lives and depreciation profiles
All asset service lives were reviewed ahead of Blue Book 2019, except for other machinery and equipment for non-service industries. For further information on the asset lives used in the perpetual inventory method (PIM) by type of asset, please see our National Accounts articles: Changes to the capital stock estimation methods for Blue Book 2019.
The retirement distribution of all assets, except research and development, are normally distributed around the mean asset service life. For research and development, a Weibull distribution is used.
Nôl i'r tabl cynnwys9. Glossary
Age-efficiency profile
This describes an asset’s productive capacity over its service life. The index is set to equal one for a new asset and becomes zero when the asset has reached the end of its service life. The decline in productive capacity is a result of wear and tear of the asset.
Age-price profile
This is the price index of a capital good with regard to its age. The age-price profile compares identical capital goods of different age at the same point in time. The age-price profile declines with increasing age.
Asset service life
This is the economically useful life of an asset. It is the amount of time an asset is expected to contribute to the production process.
Consumption of fixed capital (CFC)
CFC is the decline in the current value of the stock of fixed assets owned and used by a producer as a result of:
physical deterioration
normal obsolescence
normal amounts of accidental damage
CFC is treated as a cost of production because it measures the decline in the value of fixed assets that can be attributed to their use in production.
It is valued at current prices, rather than the prices when assets were first put into service (or, for volume measures, at constant prices of a base year). CFC reflects the amount that would have to be invested during the accounting period to hold real wealth constant, all other things remaining constant.
In national accounts the return on capital is shown as net operating surplus.
Depreciation profiles
This is the value loss of an asset because of ageing, expressed as a percentage of the value of a new asset.
Gross capital stocks
Gross capital stocks are the stock of assets which have survived from past investments and have been revalued at the purchasers’ prices of new capital goods. They are called “gross” because these values have not deducted consumption of fixed capital. Therefore “gross” values ignore decay of assets and consider past investments “as new”; as only retirement is considered. Gross capital stocks show the current replacement cost of the asset in today’s prices.
Gross fixed capital formation
This is the value of a producer’s acquisitions, less disposals, of fixed assets during the accounting period, plus certain additions to the value of non-produced assets such as land improvements.
Net capital stocks
Net capital stocks measure the market value of capital. These values are determined by the flows of investment and depreciation. The “net” distinguishes the depreciated capital stock from the undepreciated or “gross” stock.
Nôl i'r tabl cynnwys10. Future developments
The Office for National Statistics (ONS) aims to align the gross fixed capital formation (GFCF) series used in the national accounts and the production of capital stocks and consumption of fixed capital estimates, for all sectors. Another aim is to provide greater clarity on how the concepts captured as fixed assets within the national accounts relate to other assets outside the production boundary, including natural and human capital.
There are three main development programmes which aim to address this work.
The first is the public sector finances development plan, which is detailed in our Looking ahead – developments in public sector finance statistics: 2022 article. This includes a review of the public sector non-financial assets and depreciation. This stream aims to strengthen the non-financial assets estimates by reviewing some of the sources, methods and assumptions which have a particular impact on the public sector.
The review will consider the implementation of reclassification decisions, the transfer of some nuclear power stations to central government, and road de-trunking.
The second main development plan is the non-financial assets transformation project, which is included in the National Accounts Improvement Programme (NAIP).
This project includes a review of the different capital investment estimates across the national accounts. It also includes a development stream that will align the GFCF across the accounts, improving coherency across all sectors in the national accounts.
The third development programme is discussed in our New Beyond GDP measures for the UK: a workplan for measuring inclusive income article. This includes new estimates for projects feeding into innovative measures of “inclusive income”, which align with the concept of “inclusive wealth”.
Nôl i'r tabl cynnwys11. Acknowledgements
We would like to thank Trina Evans and Kelly Thomas for their valuable contributions to this article. We would also like to thank colleagues working in the public sector finances and the non financial assets branches of the Office for National Statistcs for their feedback.
Nôl i'r tabl cynnwys