Cynnwys
- Main points
- Introduction
- Background information
- The relationship between environment and the economy
- UK’s structural change
- Technical progress and improvements in energy efficiency
- International trade of carbon emissions
- Conclusion
- Authors
- References
- Appendix A: Total UK greenhouse gas (GHG) emissions
- Appendix B: Regression analysis
- Appendix C: Turning point calculation
1. Main points
While UK carbon dioxide (CO2) emissions peaked in 1972, once we consider imported emissions – such as when the UK imports products that are manufactured abroad – UK emissions peaked in 2007.
The biggest source of these “imported” emissions is China, followed by the EU.
Emissions produced directly by the UK declined as the result of a combination of environmental policies and a shift of the UK economy from more carbon-intensive manufacturing to less carbon-intensive service-based industries.
When looking at the UK’s carbon dioxide emission intensity, which continues to fall, the energy generation (negative 67%), manufacturing (negative 43%), water supply (negative 38%), and transport (negative 33%) sectors saw the biggest falls between 1990 and 2017.
The change from coal to renewable energy has resulted in UK CO2 emissions continuing to fall.
2. Introduction
The relationship between economic growth and the environment has become increasingly scrutinised in the last 100 years. The unprecedented growth of the world economy has resulted in an increasing concern that its development is a contributing factor to the greenhouse effect1. This topic has drawn upon various theoretical models, one of which is presented by the Environmental Kuznets Curve (EKC). The EKC was first recognised in 1992 as the relationship between concentrations of sulphur dioxide and per head gross domestic product (GDP) in 47 cities distributed over 31 countries (Yandle and others, 2004).
Figure 1: Initial increases in GDP per head result in increased greenhouse gas emissions but, as an economy transitions from industrial production to service-based industries the environmental damage gradually falls
Environmental Kuznet Curve

Source: Environmental Kuznets Curve
Download this image Figure 1: Initial increases in GDP per head result in increased greenhouse gas emissions but, as an economy transitions from industrial production to service-based industries the environmental damage gradually falls
.png (56.0 kB) .xlsx (41.0 kB)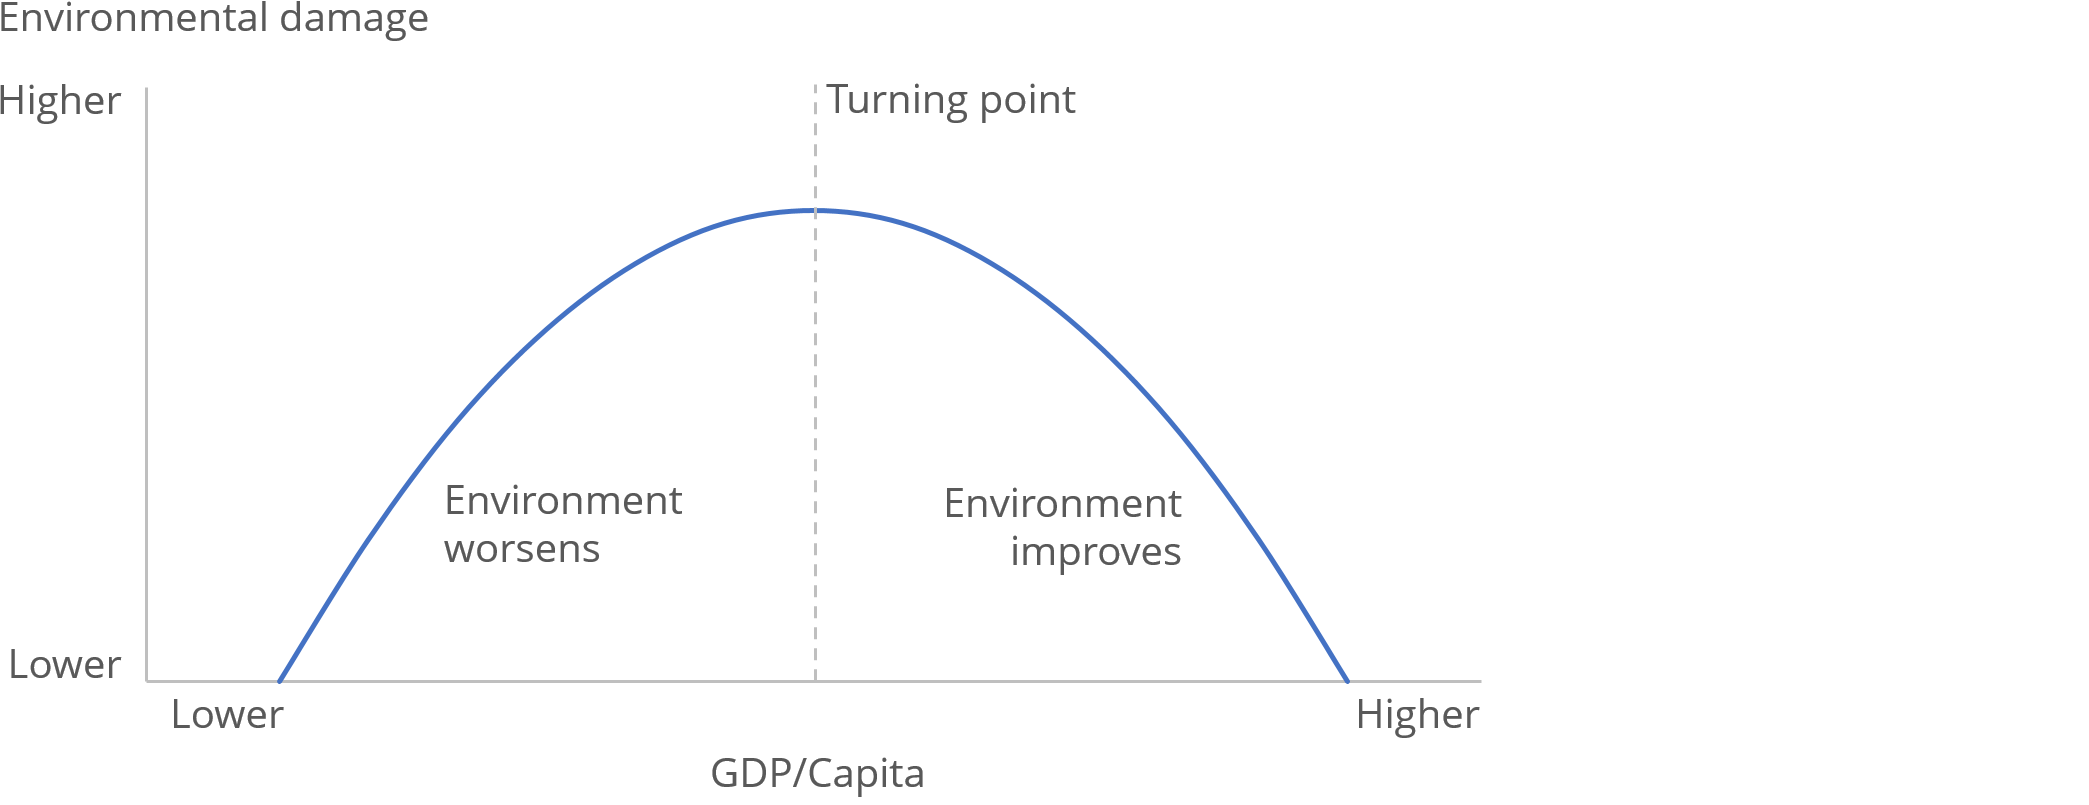
The EKC depicted in Figure 1 highlights the scale effect, which is the initial transition of the economy from agricultural production in rural areas to industrial production in urban areas. As industrial production intensifies, more energy is used, resulting in increased greenhouse gas (GHG) emissions through combustion. However, as the economy develops, there will be a structural change from manufacturing and industrial production to service-based industries. Higher economic development leads to better technology, environmental awareness and enforcement of environmental regulations resulting in the gradual decline of environmental degradation.
To inform the debate surrounding the UK’s decoupling2, we use data from the Office for National Statistics, the Bank of England, the Department for Business, Energy and Industrial Strategy (BEIS), the World Resources Institute (WRI) and Eora to explore the evolution of the EKC concept and its driving factors. Specifically, we focus on carbon dioxide (CO2) effects, as these account for around 84% of all UK GHG emissions from human activities (please refer to Appendix A, for a breakdown of all UK GHG emissions).
The UK has shown evidence of absolute decoupling between 1985 and 2016, as gross domestic product (GDP) per head grew by 70.7%, while CO2 emissions fell by 34.2%. This decoupling relationship is largely a result of the economic structural change, technological advancement and enforcement of environmental regulations such as the Climate Change Act in 2008. Under this Act, the UK is legally required to achieve the 2050 commitment to reduce GHG emissions by at least 80% compared with 1990 levels.
In May 2019, these targets were reassessed by the Committee on Climate Change (CCC). Their Net Zero Technical Report advises the UK to reduce GHG emissions by 100% from 1990 levels by 2050. The CCC also revised Scotland’s targets to meet net-zero by 2045, and for Wales to reduce GHG emissions by 95% by 2050. These recommendations will deliver the commitment the UK made in the 2015 Paris agreement.
The evident economic structural change saw the services sector contribute to around 80% of total GDP in 2017, in comparison with 51% in 1948. As the UK’s economy also witnessed technological development, the substitution of fossil fuels with renewable energy quickened substantially. For example, between 1990 and 2017, energy from renewable sources increased by 1,267%, while fossil fuel energy consumption declined by 22%, further diminishing its effect on pollution levels.
However, one of the criticisms of the EKC theory is that service-focused countries tend to create indirect emission by outsourcing the manufacturing of consumer items to countries with lower labour costs such as China. An increasing proportion of the UK’s economy is devoted to the higher-value services sector, which consumes less energy. This raises emissions through international trade flows, exaggerating any apparent decline in territorial-based emissions. A global approach is needed to analyse the relationship between GDP and emissions. This article will contribute to the existing literature on the EKC theory by analysing the evolution of the EKC concept and the possible causes of an EKC-pattern in the UK.
Notes for: Introduction
Greenhouse effect – heat being trapped in the atmosphere resulting in temperature warming.
Decoupling occurs when the growth rate of an environmental pressure (for example, CO2 emissions) is less than that of its economic driving force (for example, GDP per head) over a given period. Decoupling can be either absolute or relative. Absolute decoupling is said to occur when CO2 emissions is stable or decreasing while the GDP per head growth is growing. While, relative decoupling is when the growth rate of the CO2 emissions is positive, but less than the growth rate of the GDP per head (Ruffing, 2007).
3. Background information
The relationship between gross domestic product (GDP) and the environment has become more important, because the rapid economic growth of developing countries has contributed to environmental degradation. The Environmental Kuznets Curve (EKC) theory suggests that economic growth will eventually reduce the environmental degradation created in the early period of development. Therefore, an economy should focus on economic growth in the short-term and any environmental effects will be counteracted in the long-term.
The observed evidence of the EKC theory is mixed, although most studies find evidence of an inverted-U shape relationship between real GDP per head and measures of environmental degradation such as sulphur dioxide and/or carbon dioxide emissions. De Bruyn and others (1998) argue that even though economic growth leads to an increase in emissions in the early stages of economic development, emissions may fall over time if there are technological and structural changes to the economy. More recent literature by Giovanis (2013), Mohapatra and others (2016), Mikayilov and others (2018), and Luzzati and others (2018) found that relative decoupling was more evident in developed countries. For example, Mikayilov and others (2018) used a panel data of European countries and found countries that showed evidence of decoupling followed stricter carbon mitigation policies. Therefore, it is necessary for the government to implement environmental policies such as carbon taxation, carbon pricing, cap and trade, and so on to ensure economies grow sustainably.
Everett and others (2010) and Luzzati and others (2018) agree with the conclusions of these studies to an extent. The results of Luzzati and others (2018) only showed weak evidence of EKC for the period 1971 to 2001 and found that this evidence does not hold up for the rest of their time frame because of the new wave of globalisation. The globalised nature of the world economy implies that this relationship needs to be analysed at an international level, rather than by individual countries because environmental damage cannot simply be reduced by moving production processes from advanced to developing countries (Everett and others, 2010).
Nôl i'r tabl cynnwys4. The relationship between environment and the economy
The UK Industrial Revolution of the 18th and 19th centuries resulted in the transition of the UK economy from a reliance on agriculture to manufacturing, starting a period of unprecedented economic growth. The carbon-intensive nature of the manufacturing sector meant that growth in the economy was accompanied by previously unseen levels of emissions.
Figure 2: Reduction in coal consumption and carbon dioxide emissions follow introduction of environmental regulations
GDP per head, territorial CO2 Emissions and coal consumption
Embed code
Data download
Note:
- Annual UK territorial CO2 emissions and coal consumption values were obtained from Carbon Brief, 2017; which used data sources via Department for Business, Energy & Industrial Strategy, 2019 and World Resources Institute, 2017. Real GDP per head values are sourced via Bank of England, 2019.
As observed in Figure 2, between 1850 and 1985, the UK's gross domestic product (GDP) per head and carbon dioxide (CO2) emissions exhibited a strong coupling, increasing by 516% and 354% respectively. The only exceptions were 1921, 1926 and 1984 where the miners’ strikes led to a fall in coal production and caused a sharp dip in CO2 levels as observed previously (Church and others, 1990).
Most of this emission originated from the combustion of fossil fuels used to heat homes, such as coal , combined with emissions produced by factories during the Industrial Revolution. UK coal consumption increased from around 29 million tonnes a year in 1850 to 206 million tonnes in 1950.
In 1952, smoke generated from the excess burning of coal combined with fog eventually led to a thick layer of smog in major cities such as London, Glasgow, Leeds and Manchester. The smog blocked out the sun, blackened buildings, increased the seriousness of fog, and damaged people’s health (Brimblecombe, 2006).
According to the Environmental Kuznets Curve (EKC) theory, the decoupling of economic growth from environmental degradation eventually occurs after a certain GDP per head level. This is because higher economic development leads to environmental awareness, enforcement of environmental regulations and better technology, resulting in the gradual decline of environmental degradation. In a UK context, environmental awareness and a political appetite for enforcement of environmental regulations may have been a precedent for the eventual reduction in CO2 emissions.
The London smog prompted creation of the Clean Air Acts of 1956 and 1968, which prohibited discharges of dark smoke and declared that the inhabitants of urban regions and administrators of processing plants must switch over to smokeless fuels. By shifting domestic sources of heat towards cleaner coal, electricity and gas, it reduced the amount of smoke pollution and carbon dioxide from household fires and contributed to the eventual decline of coal (Brimblecombe, 2006). The level of coal consumption is shown in Figure 2 to decline after 1956.
Figure 3: The approximate turning point for decoupling of GDP per head and carbon dioxide emissions seems to have been around 1985
Correlation between real GDP per head and CO2 Emissions (Tonnes), 1850 to 2016

Source: Bank of England, 2019, World Resources Institute, 2017 and Business Energy Industrial Strategy, 2019
Notes:
- Annual UK CO2 emissions were obtained from Carbon Brief, 2017; which used data sources via Business, Energy and Industrial Strategy , 2019 and World Resource Institute, 2017. Real GDP per head values are sourced via Bank of England, 2019.
Download this image Figure 3: The approximate turning point for decoupling of GDP per head and carbon dioxide emissions seems to have been around 1985
.png (113.7 kB) .xlsx (26.6 kB)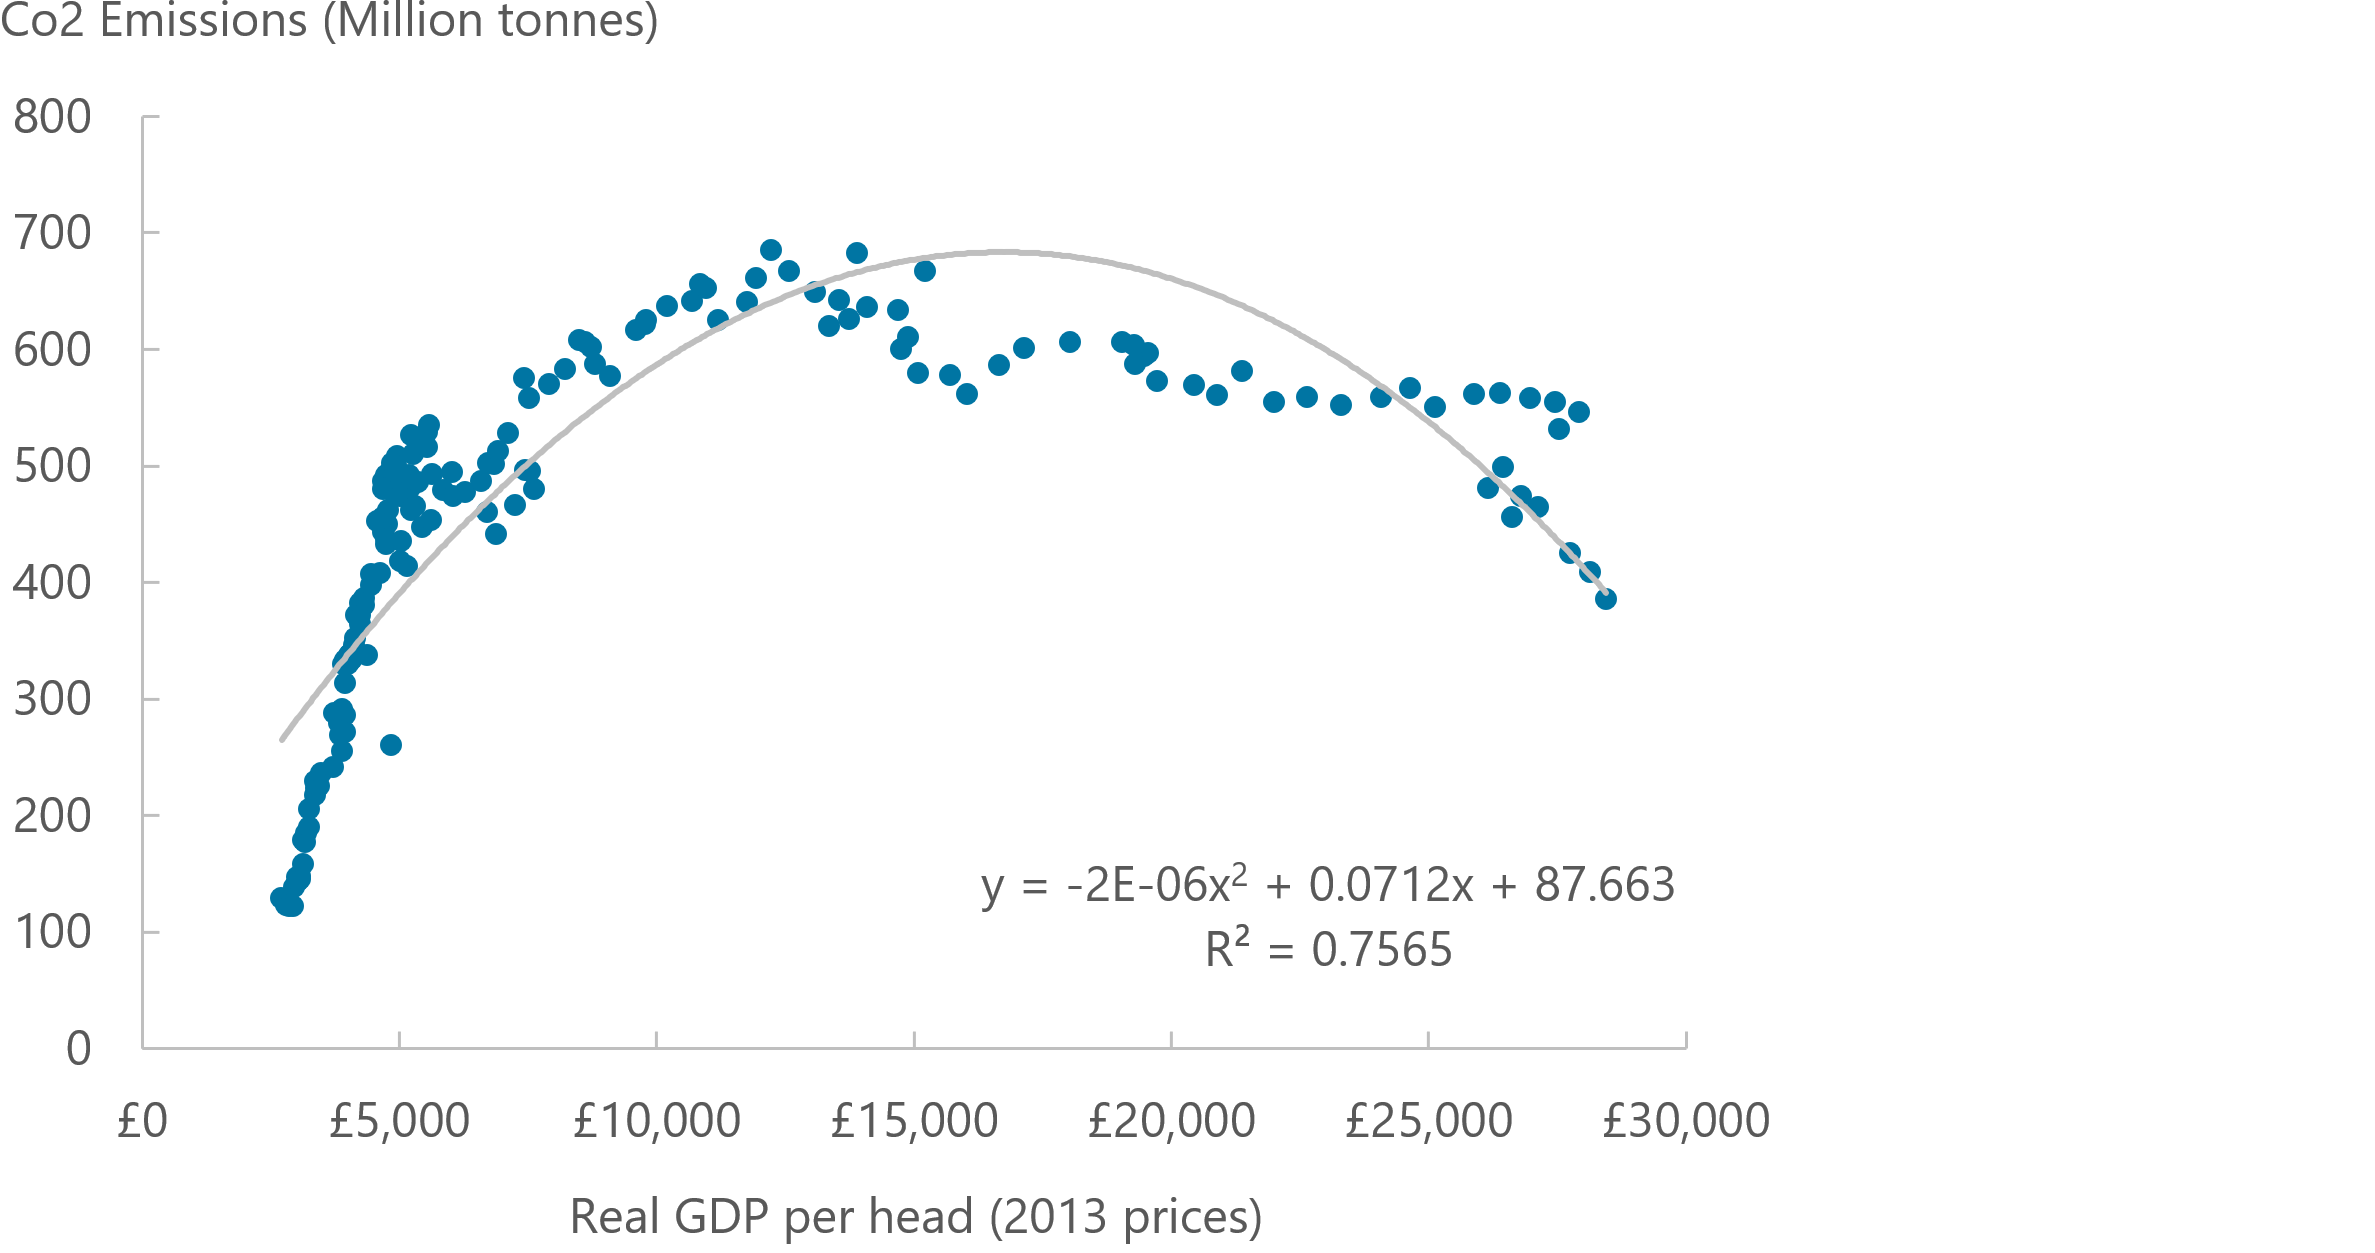
For the UK, the approximate turning point at which the decoupling of GDP per head and carbon dioxide emissions seemed to have happened was in 1985, with a GDP per head of £16,667 and corresponding CO2 emissions of around 586 million tonnes, as shown in Figure 3. For a more in-depth analysis of the turning point calculation, please refer to Appendix C.
Figure 4: Between 1985 and 2016, real GDP per head grew by 70.7% while carbon dioxide emissions declined by 34.2%
Index of Real GDP per head and carbon dioxide emissions, 1985 to 2016, UK
Source: Bank of England, 2019, World Resources Institute, 2017 and Business Energy Industrial Strategy, 2019
Notes:
- Annual UK CO2 emissions were obtained from Carbon Brief, 2017; which used data sources via Business, Energy and Industrial Strategy , 2019 and World Resource Institute, 2017. Real GDP per head values are sourced via Bank of England, 2019.
Download this chart Figure 4: Between 1985 and 2016, real GDP per head grew by 70.7% while carbon dioxide emissions declined by 34.2%
Image .csv .xlsFigure 4 shows absolute decoupling of real GDP per head and carbon dioxide emissions, with 1985 as the base year to reflect changes following the decoupling. Real GDP per head grew by 70.7% between 1985 and 2016 while carbon dioxide emissions declined by 34.2% during the same period.
The Climate Change Act of 2008 (PDF, 440KB) was a further effort by the government to reduce the UK’s impact on the environment. The Act formalised the UK’s approach to tackling climate change and required preparation for climate change risks, as well as the reduction of the net UK carbon account of at least 80% by 2050, compared with 1990 levels.
The rate of decline in carbon dioxide (CO2) emissions quickened from 2008 as shown in Figure 4. The global economic slowdown during this period is likely to have contributed to the initial decline in emissions because of a reduction in global demand, therefore the exact impact of the Act on CO2 emissions is uncertain. However, the continued decline in emissions following the economic recovery is evidence of environmental improvement. In 2016, CO2 emissions were 35% below 1990 levels while GDP per head grew by 45% over the same period.
The Climate Change Act was amended in 2019 following the recommendations of the Committee on Climate Change to introduce the target of at least a 100% reduction of the net UK carbon account by 2050 compared with 1990 levels. The policies described previously highlight the importance of environmental policy for reducing the UK’s environmental impact while maintaining economic growth. However, there could be several other reasons for decoupling of GDP per head from CO2 emissions, such as the structural change in the UK economy and technological advancement.
Nôl i'r tabl cynnwys5. UK’s structural change
The structural transformation of the economy is relevant to the Environmental Kuznets Curve (EKC) concept. The theory suggests that economic development results in a structural change that transfers the economic production system from low-polluting agricultural industries to pollution-intensive manufacturing sectors and shifts again to less carbon-intensive service sectors.
Figure 5: UK economy has shifted from manufacturing to service-based industries
Sectoral breakdown, 1948 to 2016, UK
Source: Bank of England, 2019
Download this chart Figure 5: UK economy has shifted from manufacturing to service-based industries
Image .csv .xlsConsistent with the EKC theory, Figure 5 shows that the UK economy is now devoted towards the services sector. In particular the knowledge-intensive services such as finance, professional services, and information and communication technology (Department for Business, Innovation and Skills, 2012).
For example, between 1986 and 2017, the services sector contributed an average of 74% towards total gross domestic product (GDP). In comparison, the manufacturing sector contributed 14% to UK GDP in the same period. An important factor behind this structural change is the rapid pace of globalisation and technological advancement, which has led to rising productivity of manufactured goods and competition from low-wage economies (Department for Business, Innovation and Skills, 2012).
Furthermore, a growing global middle class, particularly in emerging economies, has expanded the UK’s export market across services sectors, such as creative and professional business services, further increasing the share of the UK’s services industry. The structural change of the UK economy from manufacturing to a service-based economy has significantly contributed to the decline in carbon emissions. This is because the services industries have lower carbon intensity compared with manufacturing.
Nôl i'r tabl cynnwys6. Technical progress and improvements in energy efficiency
According to the Environmental Kuznets Curve (EKC), higher economic development leads to technological advancement, enabling production processes to become cleaner and more resource-efficient. The development of advanced technologies that enable the efficient use of natural resources is vital in reducing environmental degradation caused by the production of goods and services.
Figure 6: The UK has made large energy efficiency gains in manufacturing and transport sectors, which are conventionally the two most energy-intensive sectors
Energy intensity by main sectors, 1990 to 2017, UK
Source: Office for National Statistics, 2019a
Download this chart Figure 6: The UK has made large energy efficiency gains in manufacturing and transport sectors, which are conventionally the two most energy-intensive sectors
Image .csv .xlsEnergy intensity provides a broad indication of how efficiently energy is being used over time. The higher the energy efficiency, the lower the energy intensity by sector.
The UK has already made large energy efficiency gains specifically in the manufacturing and transport sectors, which are conventionally the two most energy-intensive sectors (Office for National Statistics, 2018). The largest fall in energy intensity occurred in the manufacturing sector, by 42% between 1990 and 2017, due mainly to the shift of the UK economy from a manufacturing to a service-based economy.
The decreasing importance of the manufacturing sector has resulted in the transportation sector now demanding most of the energy used in the economy, a share of 80% (Department for Environment, Food and Rural Affairs, 2018). Furthermore, energy intensity in the transport and storage sector declined by 33% over the observed period.
A major contributing factor to this decline is improvement in the efficiency of vehicles. For example, the use of composite materials and carbon fibre1 technology in building vehicles achieves weight savings of 30% compared with traditional cold roll forming grades2, therefore, improving its fuel economy (Furfari, 2016).
Figure 7: Electricity, gas, steam and air conditioning supply is the biggest contributor to total carbon intensity but has experienced a noteworthy decline in its carbon intensity
Carbon emission intensity by the main sectors, 1990 to 2017, UK
Source: Office for National Statistics, 2019b
Download this chart Figure 7: Electricity, gas, steam and air conditioning supply is the biggest contributor to total carbon intensity but has experienced a noteworthy decline in its carbon intensity
Image .csv .xlsCarbon dioxide (CO2) emissions are directly related to the use of energy as CO2 emissions are by-products of energy consumption. Therefore, because of the decrease in energy demand, the intensity of greenhouse gas emissions also diminishes. In recent years, CO2 emissions per unit of economic activity, as measured by the carbon intensity3, has been declining.
Figure 7 shows that the electricity, gas, steam and air conditioning supply industry is the biggest contributor to total carbon intensity, representing an average share of 15% between 1997 and 2017. This is because approximately 68% of electricity production comes from burning fossil fuels, mostly coal and natural gas. However, this sector has witnessed the most noteworthy decline in its carbon intensity, by 67% over the same period.
Figure 8: Between 1990 and 2017, energy consumption from fossil fuels has fallen, while energy from renewable and waste sources increased
Energy consumption by type, 1990 to 2017, UK
Source: Office for National Statistics, 2019c
Download this chart Figure 8: Between 1990 and 2017, energy consumption from fossil fuels has fallen, while energy from renewable and waste sources increased
Image .csv .xlsThese were driven primarily by a switch from the use of coal and heavy-polluting fuels to other, more efficient fuels such as natural gas and, more recently, renewable sources4 (Office for National Statistics, 2019d). This is shown in Figure 8, as energy consumption from fossil fuels fell 22% between 1990 and 2017 to 161.6 million tonnes, while energy from renewable and waste sources increased by 1,267% over the same period, reaching 20.5 million tonnes.
The reduction in the use of fossil fuels as the primary source of energy for electricity generation has contributed to 130 million tonnes fewer CO2 emissions produced between 1990 and 2017 (Business, Energy and Industrial Strategy, 2019).
Despite the transition to more renewable energy consumption for electricity generation and other uses, energy consumption from renewable sources only represented 10% of total energy consumption in 2017. However, this shows an improvement when compared with its 1% contribution in 1990.
Notes for: Technical progress and improvements in energy efficiency
Carbon fibre is a material consisting of fragile filaments of carbon atoms. When bound with plastic polymer resin by heat, pressure or in a vacuum, a composite material is formed that is both strong and lightweight (Rezaei and others, 2008).
Cold roll forming process is an alternative method to shape the advanced high strength steel using a series of rolls under the condition of room temperature (Sheu and others, 2017).
Air emissions form part of the United Nations (UN) 17 Sustainable Development Goals (SDGs), which were introduced in 2015. Their primary purpose is to end poverty, protect the planet and ensure that everyone enjoys peace and prosperity by 2030. The UK has contributed towards Indicator 9.4.1 by reducing its carbon intensity. The primary aim of this goal is for industries to reduce their carbon dioxide (CO2) intensity through technological advancement that enables industrial processes to become cleaner and resource-efficient. More information about SDGs can be found on the ONS and UN websites.
The UK’s largest source of renewable energy consumed is derived from biomass – that is, organic material from plants or animals and not solar or wind energy. More information about the impact of UK’s biomass energy consumption can be found on the ONS website.
7. International trade of carbon emissions
The sudden expansion and globalisation of world economies has resulted in service-focused countries and regions creating indirect emissions through outsourcing of manufacturing products to countries with lower labour costs. Hence, carbon dioxide (CO2) emissions embodied in international trade have become an essential factor in the measurement of global carbon emission responsibility. Different approaches can be taken to measure and account for carbon emissions such as Territorial1, Residency and Consumption basis2.
Figure 9: Decoupling of GDP per head from CO2 emissions seems to have happened at the expense of outsourcing manufacturing
Different measures of CO2 emissions, 1970 to 2015, UK
Source: Eora, 2018, World Resource Institute, 2017 and Department for Business, Energy and Industrial Strategy, 2019b
Notes:
- This graph has been compiled using data for consumption-based emissions from Eora, 2018, and territorial-based emissions from WRI, 2017 and BEIS, 2019
Download this chart Figure 9: Decoupling of GDP per head from CO2 emissions seems to have happened at the expense of outsourcing manufacturing
Image .csv .xlsFigure 9 shows that, on average between 1970 and 1986, consumption-based emissions were only 0.2% higher than territorial-based emissions. This is attributed to the UK importing fewer emissions embodied in manufactured goods, because during that period, the UK had a larger manufacturing sector that met domestic demand for goods.
The UK economy gradually shifted from a carbon-intensive manufacturing-based economy to a less carbon-intensive services economy after-1986. The gap between the consumption-based and territorial-based emissions started to widen. By 2007, the consumption-based CO2 emissions reached their peak and were 37% higher than the territorial CO2 emissions. This implies that the absolute decoupling of gross domestic product (GDP) from territorial CO2 emissions in 1986 was not solely because of policy impacts, but also because of the outsourcing of the production of manufactured goods to developing countries.
Since 2008, both the territorial and consumption-based emissions have declined. This reduction in emissions coincided with the global economic downturn. However, both types of emissions have continued to decline since the economic recovery.
Figure 10: UK is a net importer of carbon dioxide emissions
Net trade of carbon emissions, by top importers and exporters, 1992 to 2015
Source: Eora, 2018
Download this chart Figure 10: UK is a net importer of carbon dioxide emissions
Image .csv .xlsFigure 10 compares the largest net importers and exporters of CO2 emissions. A country can be considered a net exporter of CO2 emissions when its territorial-based emissions are higher than its consumption-based CO2 emissions. The reverse is true for the UK, being a net importer of CO2 emissions as seen in Figure 9.
The United States (US) is the largest net importer of CO2 emissions. In 1992, the US had a net import of 43.5 million tonnes of CO2 emissions, which increased to 717 million tonnes by 2015.
China is the biggest net exporter of CO2 emissions. In 1992, China had a net export of 364 million tonnes of CO2. This increased to 1,480 million tonnes by 2015. This demonstrates that while the US and many other developed countries have reduced their domestic emissions over recent decades, some of this decrease has been counteracted by rising imports from countries, such as China, which have a more carbon-intensive energy mix. This highlights the main criticism of the Environmental Kuznets Curve theory.
Figure 11: UK has one of the highest per head net imports of carbon dioxide emissions
Net trade of carbon emissions, per head, by top importers and exporters, 1992 to 2015
Source: Eora, 2018
Download this chart Figure 11: UK has one of the highest per head net imports of carbon dioxide emissions
Image .csv .xlsComparisons between countries can be difficult because of their respective population and size. These factors have large impacts on resulting carbon transfers. Thus, Figure 11 shows CO2 net exports considering differences in population.
Despite the US having the largest net CO2 emission imports, US net import of CO2 emissions per head are lower than that of the UK. The UK increased its net imports of CO2 emissions per head from 1.7 tonnes in 1992 to 5.1 tonnes per head in 2007. However, the UK comprises around 3.7% of the world’s GDP (World Bank, 2019) and 1.9% of CO2 emissions based on consumption in 2011 (Organisation for Economic Co-operation and Development, 2015). As a result, the UK represents a relatively small proportion of CO2 emissions embodied in global trade.
Taking into consideration population differences, the UK is the largest net importer of carbon dioxide amongst these selected countries and regions. China is replaced by Russia as the most prominent net exporter of CO2 emissions. In 2015, Russia had a net-export of 2.8 tonnes of CO2 per head, while China’s net-export was 1.1 tonnes per head. This is substantially different to the trend seen in Figure 10. Taking population differences in consideration significantly changes the global outlook of carbon emissions embodied in international trade.
Figure 12: Most of UK imports of carbon emissions come from China and Europe
Net import of UK’s carbon emissions, by main countries and regions, 1990 to 2015
Source: Eora, 2018
Download this chart Figure 12: Most of UK imports of carbon emissions come from China and Europe
Image .csv .xlsFigure 12 breaks down international trade of carbon emissions by showing the main countries and regions the UK imports carbon emissions from. The chart shows that the UK has the highest net import of carbon emissions from China, which reached a peak of 103 million tonnes of CO2 emissions in 2007. A briefing by the House of Commons states that the UK’s the UK’s largest import from China was telecoms equipment in 2017. A study published in the Nature Climate Change Journal found that products made in China are associated with higher CO2 emissions than if the same products were made elsewhere. This is because China uses less advanced manufacturing processes and relies primarily on coal for energy (Liu, Z. and others, 2016).
However, Figure 9 shows that consumption-based CO2 reductions have continued despite recovery from the economic downturn after-2008. The UK’s carbon footprint fell by approximately 3.4% between 2014 and 2015. This is because of a fall in emissions associated with imported goods, particularly from China. In addition, there has been a fall in the final demand of CO2 emissions from imported energy, which could have helped drive down consumption-based emissions (Hardt, L. and others, 2018).
The UK’s net import of CO2 emissions from Europe in 2007 was around 56 million tonnes, but this fell to 37 million tonnes in 2009. The sharp fall in imported carbon emissions from Europe from 2007 onwards highlighted in Figure 12 could be attributed to the Kyoto Protocol. Under the protocol, countries pledged to reduce their emissions from 2008 to 2012, thus the European Union also follows the same trend. Environmental awareness, political appetite and policy focus all suggest that in the last 10 years the UK has made a genuine effort to cut carbon emissions.
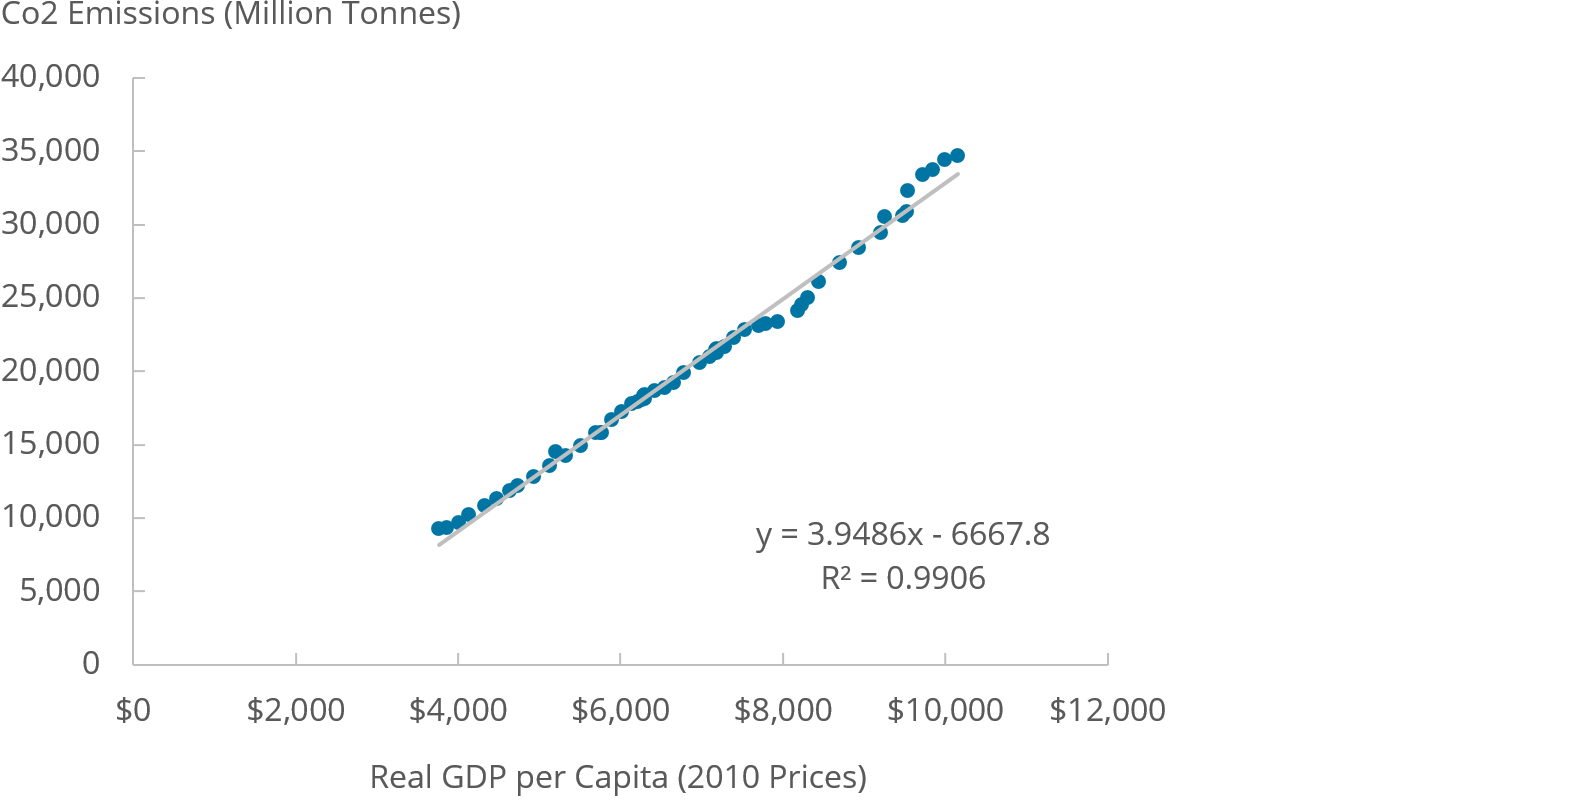
Figure 13: There is still a strong coupling between world carbon dioxide emissions and real GDP per head
Correlation between real GDP per head and CO2 emissions (tonnes) globally, 1960 to 2014
Source: World Bank, 2019 and World Resources Institute, 2017
Download this image Figure 13: There is still a strong coupling between world carbon dioxide emissions and real GDP per head
.png (62.5 kB) .xlsx (19.3 kB)
While the UK economy is a good example of Environmental Kuznets Curve theory and has shown signs of absolute decoupling following 1985, Figure 13 demonstrates that this has not been the case when looking at the same comparison globally. There is still a strong coupling between carbon dioxide emissions and real GDP per head.
An important reason for this is the continued reliance on manufacturing in many countries, which is carbon-intensive. When the UK was heavily reliant on the manufacturing sector following the Industrial Revolution, a similar coupling between GDP per head and CO2 emissions occurred. At a global level, a structural change such as the one witnessed in the UK is unlikely because of the global demand for manufactured goods, therefore any potential global decoupling must be achieved through other factors such as technological change or environmental policies.
It is useful to look at environmental policies from a global perspective as pollution has no production boundary and its negative effect is felt worldwide. While policies such as those highlighted in previous sections are beneficial for reducing domestic emissions, the current absence of a global approach provides an incentive to outsource the production of emissions to countries with less stringent regulations, resulting in the continued rise of global emissions despite domestic improvements.
Notes for: International trade of carbon emissions
Territorial approach only measures emissions that occur within the UK’s borders. On a residency basis, the figures reflect emissions produced by UK residents and industries (UK and abroad) but exclude emissions within the UK, which can be attributed to overseas residents and businesses. Consumption measures emissions of UK residents on goods and services, wherever in the world these emissions arise in the production process and that are directly caused by UK households (Source: Defra).
Consumption-based accounting (CBA) of emissions is a relatively new and emerging field both in policy and academic research. Therefore, the current measurements are rarely regarded as “official statistics” because of the variability in the CBA results across multi-regional input-output table (MRIO) models. These variations relate to issues such as calibration, balancing, and harmonisation, the use of different time periods, different currencies, different country classifications, levels of disaggregation, inflation and raw data errors (Barrett and others, 2013). Nevertheless, the use of error propagation such as the Monte-Carlo simulation techniques can be applied to account for such uncertainties. For example, Moran and Wood (2014), Monte Carlo sensitivity analysis results show that the CBA results across MRIOs models differ by less than 10% for most major economies and this is considered acceptable.
8. Conclusion
This article analyses how the UK’s economy has developed over time and the efforts it has made to reduce its carbon dioxide (CO2) levels. The early stages of economic growth in the UK brought about by the Industrial Revolution led to increases in greenhouse gas emissions. However, following the 1952 London smog, many environmental acts have been adopted as part of a proactive approach to reduce CO2 emissions.
Our analysis shows that the UK has gone through structural changes to become a service-led economy. The structural shift away from manufacturing has significantly contributed to the decline in carbon emissions because of the services industries having a comparatively lower carbon intensity.
Technological progress in the UK has resulted in a decline in CO2 emissions by bringing improvements in energy intensity and carbon emission intensity. The UK economy saw a significant decrease of energy intensity in the manufacturing and transport sectors, which are the most predominant energy-intensive sectors. As the UK’s economy also witnessed technological development, the substitution of fossil fuels for renewable energy has been increasing.
The drivers of the Environmental Kuznets Curve (EKC) pattern have resulted in an absolute decoupling of gross domestic product (GDP) from CO2 emissions. The UK is committed to further decline in CO2 emissions following the Climate Change Act and the 2050 target to achieve net zero emissions. The EKC theory experience in the UK shows that GDP growth can result in lower CO2 emissions, however, this needs to be combined with a political appetite to correct the market failure of over-production of CO2.
The impact of globalisation on CO2 emissions has resulted in service-based economies creating indirect emissions by outsourcing manufacturing products to countries with lower labour costs and less stringent pollution regulations. We find that the UK is a net-importer of CO2 emissions, with most of the imported CO2 emissions coming from China. Therefore, any apparent decline in territorial CO2 emissions is overestimated. However, in recent years the UK has made genuine efforts in cutting down both its territorial and consumption-based emissions despite continued growths in its GDP per head.
While the UK has shown evidence of absolute decoupling of GDP per head and CO2 emissions, the global coupling of GDP per head and CO2 emissions has persisted. Given there is no production boundary for air pollution, the reduction of air emissions while maintaining GDP growth, is a global responsibility.
Nôl i'r tabl cynnwys10. References
Bank of England, 2019. A millennium of macroeconomic data
Barrett, J., Peters, G., Wiedmann, T., Scott, K., Lenzen, M., Roelich, K. and Le Quéré, C., 2013. Consumption-based GHG emission accounting: a UK case study. Climate Policy, volume 13, number 4, pages 451 to 470
Business, Energy and Industrial Strategy, 2019a., Historical coal data: coal production, availability and consumption
Business, Energy and Industrial Strategy, 2019b., Final UK greenhouse gas emissions national statistics: 1990-2017
Business, Innovation and Skills, 2012. Industrial Strategy: UK Sector Analysis. BIS Economics paper number 18
Bruyn, S.D., Van den Bergh, J.C.J.M. and Opschoor, J.B., 1998. Economic growth and emissions: reconsidering the empirical basis of environmental Kuznets curves. Ecological Economics, volume 25 number 2, pages 161 to 175
Carbon Brief, 2017., UK Emissions
Church, R., Outram, Q. and Smith, D.N., 1990. British coal mining strikes 1893–1940: Dimensions, distribution and persistence. British Journal of Industrial Relations, volume 28 number 3, pages 329 to 349
Department for Environment, Food and Rural Affairs, 2018., UK Energy Brief
Eora, 2018., Carbon Footprint of Nations
Everett, T., Ishwaran, M., Ansaloni, G.P. and Rubin, A., 2010. Economic growth and the environment. Defra Evidence and Analysis Series, paper 2
Furfari, S., 2016. Energy efficiency of engines and appliances for transport on land, water, and in air. Ambio, volume 45 number 1, pages 63 to 68
Giovanis, E., 2013. Environmental Kuznets curve: Evidence from the British household panel survey. Economic Modelling, 30, pages 602 to 611
Hardt, L., Owen, A., Brockway, P., Heun, M.K., Barrett, J., Taylor, P.G. and Foxon, T.J., 2018. Untangling the drivers of energy reduction in the UK productive sectors: Efficiency or offshoring? Applied energy, 223, pages 124 to 133
Liu, Z., Davis, S.J., Feng, K., Hubacek, K., Liang, S., Anadon, L.D., Chen, B., Liu, J., Yan, J. and Guan, D., 2016. Targeted opportunities to address the climate–trade dilemma in China. Nature Climate Change, volume 6 number 2, page 201
Luzzati, T., Orsini, M. and Gucciardi, G., 2018. A multiscale reassessment of the Environmental Kuznets Curve for energy and CO2 emissions. Energy policy, 122, pages 612 to 621
Mikayilov, J.I., Hasanov, F.J. and Galeotti, M., 2018. Decoupling of CO2 emissions and GDP: A time-varying cointegration approach. Ecological Indicators, 95, pages 615 to 628
Mohapatra, S., Adamowicz, W., and Boxall, P., 2016. Dynamic technique and scale effects of economic growth on the environment. Energy Economics, volume 57, pages 256 to 264
Moran, D. and Wood, R., 2014. Convergence between the Eora, WIOD, EXIOBASE, and OpenEU's consumption-based carbon accounts. Economic Systems Research, volume 26 number 3, pages 245 to 261
Organisation for Economic Co-operation and Development., 2015. Carbon Dioxide Emissions embodied in International Trade
Office for National Statistics, 2019a., Energy use: by industry reallocated to final consumer and energy intensity
Office for National Statistics, 2019b., Carbon dioxide emissions intensity by industry
Office for National Statistics, 2019c., Energy use: total
Office for National Statistics, 2019d., Greenhouse gas intensity, provisional estimates, UK: 2017.
Office for National Statistics, 2019e., Atmospheric emissions: greenhouse gasses by industry and gas
Rezaei, F., Yunus, R., Ibrahim, N.A. and Mahdi, E.D., 2008. Development of short-carbon-fiber-reinforced polypropylene composite for car bonnet. Polymer-Plastics Technology and Engineering, volume 47, number 4, pages 351 to 357
Ruffing, K., 2007. Indicators to measure decoupling of environmental pressure from economic growth. Sustainability Indicators: A Scientific Assessment, 67, page 211
Sheu, J.J., Yu, C.H. and Wang, J.K., 2017. Die Designs of Cold Roll Forming Process for Car Bumper Using Advanced High Strength Steel. Procedia engineering, 207, pages 1308 to 1313
World Bank., 2019. GDP (constant 2010 US$)
World Resource Institute., 2017., Historical Emissions
Yandle, B., Vijayaraghavan, M. and Bhattarai, M., 2004. Environmental Kuznets Curves: A Review of Findings, Methods, and Policy Implications. A Primer, PERC Research Study 02-01
Nôl i'r tabl cynnwys11. Appendix A: Total UK greenhouse gas (GHG) emissions
Figure 14: Carbon dioxide emissions make up the bulk of greenhouse gas emissions for the UK
Breakdown of greenhouse gas emissions, UK, 1990 to 2017
Source: Office for National Statistics, 2019e
Download this chart Figure 14: Carbon dioxide emissions make up the bulk of greenhouse gas emissions for the UK
Image .csv .xls12. Appendix B: Regression analysis
| (1) | (2) | |
|---|---|---|
| CO2 Emission (Tonnes) | ||
| Real GDP (Per head) | 71,226.41*** | 49,696.78 *** |
| (-3,620.371) | (-1,917.765) | |
| Real GDP (Per head)² | -2.129*** | -1.181*** |
| (-0.118) | (-0.073) | |
| Coal Consumption (Tonnes) | 1.688*** | |
| (-0.059) | ||
| Constant | 87,700,000*** | -74,300,000*** |
| (-20,400,000) | (-6,852,005) | |
| Observations | 167 | 167 |
| R2 | 0.757 | 0.955 |
Download this table Table 1: Regression Analysis
.xls .csv13. Appendix C: Turning point calculation
A standard quadratic function is:
when a≠0, a parabola, such as the EKC, is shown.
The standard EKC regression model is:
where E is CO2 emissions, P is population, GDP is gross domestic product and ε is a random error term.
Thus, the “turning point” (vertex) is calculated using:
Nôl i'r tabl cynnwys