1. Introduction
Over 1.7 million hectares of urban area exist in Great Britain, defined by high population density and built infrastructure. However, urban areas can also encompass a variety of natural landscapes and biodiversity. Recently published urban ecosystem accounts estimate almost one-third of urban area in Great Britain consists of natural land and green space.
Urban green spaces are a type of natural asset that provide society with a range of benefits. Office for National Statistics (ONS), together with the Department for Environment, Food and Rural Affairs (Defra), are developing natural capital accounts for the UK to offer a comprehensive and consistent framework to organise environmental information so that the benefits of nature are better recognised.
The urban ecosystem accounts contain information about the extent of green and blue space in urban areas, information about the condition of these areas and estimates the quantity and value of seven ecosystem services supplied by urban nature.
This article focuses on two of those services only, the use on the hedonic pricing method (HPM) to value the cultural services provided by nature in urban areas, including such as including recreation and aesthetic views. For information about others, please see the urban ecosystem account publication.
What is the hedonic pricing method?
The hedonic pricing method (HPM) assumes that a class of differentiated products can be broken down into several characteristics. A combination of these characteristics and the external factors that affect the product determines its price. The most common example of this is property values, where the market price of a property is determined by a combination of structural characteristics (floor area, number of bedrooms, garden, garage and so on) and the socio-economic and environmental characteristics of the surrounding area (quality of schools, access to retail, transport, levels of water or air pollution, proximity to green space and so on).
HPM can be used to estimate the extent to which characteristics affect price by modelling house prices as a set of explanatory variables, including the structural, socio-economic and environmental characteristics. Assuming proximity to nature has an impact on property price, this methodology can be used to extract the value of environmental amenities implicit in market-based transactions.
Nôl i'r tabl cynnwys2. Model specification
The specific form of the regression we estimate is described along with a more detailed analysis of the structural, neighbourhood, environmental and socio-economic variables that we use.
Previous literature explains the hedonic pricing method does not have a pre-defined functional form. However, Rosen (1974) suggests that there are many reasons to believe that the relationship between property price and the environmental variable is non-linear in nature. Non-linearity is expected as “purchasers cannot treat individual housing attributes as discrete items from which they can pick and mix until the desired combination of characteristics is found” (Kong, 2007). This has led to many previous studies either using semi-logarithmic or double-logarithmic models as the log transformation generates the desired linearity in parameters.
Taking this into account and mitigating high variation in property prices by taking the log of property prices, a semi-logarithmic model is chosen.
The semi-logarithmic model takes the following form:
Where the dependent variable ln (price i,t) is the log of sale price for each property transaction "i" at time “t”. envi is a vector of environmental characteristics, and in our main specification includes area of natural cover, blue spaces and functional green spaces within 200 metres radius of the property1.
The vector hc i,t contains structural characteristic variables, which have been shown in previous studies to have the greatest influence on property price. It includes usual housing attributes such as number of bedrooms, property and garden area (square feet) and property type. It also includes a set of attributes retrieved from the description, such as period of the house (for example, Georgian, Victorian, Edwardian), and features that are expected to influence property prices (for example, garage, presence of original features, whether the property has been renovated recently).
The neighbourhood and geographical variables in vector ni include distance to amenities other than green and blue spaces such as transport infrastructures (for example, bus station, train station), retail area and workplace centroid. The socio-economic characteristics of the local area are captured by including dummies for each local area (middle layer super output area (MSOA)) and for the socio-economic “type” of neighbourhood based on a well-established socio-economic segmentation tool of the UK derived by ACORN. This segments postcodes by analysing significant social factors and population characteristics, such as country of birth, family structure and health, among other things.
Our primary focus is on the estimation of β, a vector of coefficients indicating how areas of green and blue spaces are associated with the log of house prices. The coefficients can be interpreted as semi-elasticities and represent the percentage change in property prices associated with the presence of green space, natural land cover or blue space within a certain radius of the property and its size.
Whilst we include a range of neighbourhood characteristics in addition to local areas fixed effects, there are likely unobserved variables that affect property prices. For instance, the presence of an outstanding school may increase prices of all properties in a neighbourhood. Omitting important determinants that affect all properties in a given neighbourhood would generate spatial autocorrelation, that is, the residuals for properties in the same area would be correlated. The spatial autocorrelation would threaten traditional inference on the parameters β ̂, as the p-value assume independence. In addition, if these unobserved factors affecting price are also correlated with the area of green and blue space, the estimated coefficients β ̂ would be biased. The direction of the bias would depend on the direction of the correlation between unobserved determinants of prices and area of green and blue space.
To mitigate spatial dependence, we include local area (MSOAs) fixed-effects in our models and cluster standard errors at the MSOA level. Therefore, we rely on the variation within MSOAs to estimate the relationship between area of green and blue spaces and property prices.
Several models are estimated where additional explanatory variables are introduced progressively to assess the robustness of our results. For example, the first model we estimate will only include environmental variables. A full list of independent variables included in the regressions are presented in Annex 1.
Notes for: What is the hedonic pricing method?
- We use areas within 200 metres radius because the average distance to green spaces is about 200 metres. We show in Annex 1that similar results are obtained using alternative radii (100 and 500 metres).
3. Data sources
A large amount of data are needed to conduct hedonic regression analysis and for the purposes of the UK natural capital accounts, they also need to be available on a national scale. The following datasets listed in this section were used.
ACORN classification
A dataset that provides a well-established geographic segmentation of the UK. Produced and licensed by CACI Ltd, it segments UK neighbourhoods and postcodes into 6 categories, 18 groups and 62 types by analysing significant behavioural and social factors. For more information, see the ACORN user guide on “The consumer classification”. ACORN is currently an important determinant in the hedonic regression and is also used in the production of the ONS Land and Property Services House Price Index and ONS House Price Index.
Zoopla
A UK-based property website. The dataset was provided by Zoopla Limited to the Urban Big Data Centre (UBDC) and includes information about over 1 million properties sold in Great Britain between 2009 and 2016. Information includes location, number of bedrooms, number of reception rooms, property type, for sale or rent, asking price, sale price and so on. The Zoopla data also provide a description of the property, which we use to extract additional characteristics of the property, for example, whether it has a garage or has been recently renovated. The description is also used to fill in missing information about property type.
Ordnance Survey
We have been fortunate to be able to collaborate with the Ordnance Survey (OS) who have created a wide range of variables influencing residential property prices for the purposes of the hedonic pricing method (HPM). These variables have been derived through the geospatial analysis of multiple OS datasets, both open data and premium data available through the Public-Sector Mapping Agreement (PSMA), as well as other third-party datasets, all government published data, from Office for National Statistics, Land Registry, Natural England and Natural Resources Wales.
Nôl i'r tabl cynnwys4. Summary statistics
The mean, minimum and maximum of the numeric variables are presented in Table 1, along with a number of observations with no missing values and standard deviation. The mean price of a property in Great Britain is approximately £250,000 and the distribution is log-normal. The average distance from a property in an urban area in Great Britain to the nearest functional green space is approximately 258 metres and the average distance to a blue space site is 365 metres.
Different definitions of green space are used throughout this article, the definitions are as follows:
natural land cover – any land cover classified as being natural in type, for example, grassland, heath, scrub, orchards, coniferous trees and so on; it does not include inland water bodies and can range from large woodland areas to small grass verges
functional green space (FGS) – any green space that has a specific function in its use, for example, public parks or gardens, playing fields, golf courses, allotments and so on; these spaces contain natural land cover and can also include some blue space, for example, a park that has a lake within it
blue space – all inland water bodies, for example, rivers, lakes, ponds, canals and so on
The mean area of natural land cover in a 200-metre radius of a UK property is 46,156 metres squared and the equivalent for FGS is 42,969 metres squared. Not all properties are situated within proximity to blue and green space. All properties in the sample are located within 500 metres of natural land cover, but only 55% are located within 200 metres of functional green space and 32% within 200 metres of blue space.
Table 1: Summary statistics of numeric variables
| Distance presented in metres and area presented in metres squared | ||||||
|---|---|---|---|---|---|---|
| Statistic | N | Mean | St. Dev. | Min | Max | |
| Price (£) | 2,634,013 | 249,802 | 643,947 | 1 | 650,001,312 | |
| Distance to nearest functional green space (FGS) | 2,624,460 | 259 | 185 | 0 | 4,163 | |
| Distance to nearest blue space site | 2,609,165 | 365 | 279 | 0 | 3,605 | |
| Area of natural land cover within | 100 metres | 2,634,013 | 15,530 | 26,129 | 0 | 1,023,637 |
| 200 metres | 2,634,013 | 46,156 | 48,564 | 0 | 1,349,563 | |
| 500 metres | 2,634,013 | 212,895 | 148,478 | 2,033 | 2,042,351 | |
| Area of FGS within | 100 metres | 2,634,013 | 18,756 | 146,518 | 0 | 12,382,576 |
| 200 metres | 2,634,013 | 42,969 | 212,132 | 0 | 12,562,617 | |
| 500 metres | 2,634,013 | 139,899 | 369,515 | 0 | 12,909,019 | |
| Area of blue space within | 100 metres | 2,634,013 | 10,501 | 336,722 | 0 | 14,849,290 |
| 200 metres | 2,634,013 | 18,858 | 444,265 | 0 | 15,036,901 | |
| 500 metres | 2,634,013 | 48,820 | 689,707 | 0 | 15,150,068 | |
| Distance to nearest workplace zone centroid | 2,562,431 | 315 | 246 | 0 | 12,792 | |
| Distance to nearest retail cluster | 2,501,504 | 369 | 337 | 0 | 6,978 | |
| Distance to nearest transport infrastructure node | 2,405,243 | 550 | 546 | 5 | 9,720 | |
| Distance to nearest railway station | 2,155,373 | 1,668 | 1,344 | 0 | 14,588 | |
| Size of building | 2,634,013 | 105 | 254 | 1 | 41,543 | |
| Residential garden area of property | 2,633,073 | 273 | 1,201 | 0 | 165,144 | |
| Source: Office for National Statistics | ||||||
Download this table Table 1: Summary statistics of numeric variables
.xls (38.4 kB)Regression results: the effect of green or blue space on property prices within 200 metres radius
Regression results, estimating the effect blue and green space have on property price, are presented in Figure 1 and Table 2. Results are based on blue and green spaces within 200 metres of property, because average distance to functional green space is 258 metres.
The coefficients are interpreted as the elasticity of price with respect to the presence and area of green and blue spaces. The price elasticity indicates by how much property price will change when one of the categorical variables, for example, a small functional green space within 200 metres, is present in comparison to if it was not. For example, small functional green space within 200 metres has a coefficient of 0.01, this would indicate that the presence of small FGS site is associated with a 1% increase in property price, if it were compared to a similar property with no functional green space within 200 metres.
All sizes of functional green and blue space within 200 metres of property have positive and significant coefficients (see Table 2 for detail). The presence of a small functional green space within 200 metres of a property is associated with a rise in property price of 0.5%. The greater the size of the functional green space the greater the effect on property prices, for example, presence of very large functional green space is associated with a rise in property price of 1.4%. Similarly, the presence of a small blue space within 200 metres of a property is associated with a 0.9% increase in price, and a very large blue space with a 3.6% increase in price.
In contrast, proximity to natural land cover, which includes all areas of green space including small areas of vegetation such as roadside vegetation, has a negative effect on property prices. A very large area of natural land cover within 200 metres is associated with 4.3% lower property prices. A reason for this could be properties surrounded by more natural features tend to be further from city centres and there could be some characteristic variables that are currently omitted from the model.
Another explanation could be the property may be near a major road, train track or derelict area that is likely to have surrounding vegetation but these areas are not desirable for recreation or aesthetic views. It suggests the functionality of the green space is an important factor, as those sites that can be used for a specific purpose and have likely been modified are valued more highly for their cultural benefits.
Figure 1: Percentage change in property price for the presence of different natural capital assets within 200 metres of the property, 2009 to 2016
Great Britain

Source: Office for National Statistics
Download this image Figure 1: Percentage change in property price for the presence of different natural capital assets within 200 metres of the property, 2009 to 2016
.png (12.4 kB) .xlsx (16.5 kB)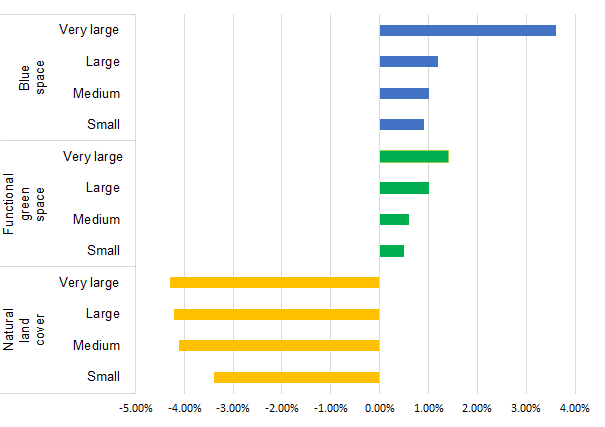
Full regression results are presented in table 2, results using four different model specifications are given, each including additional control variables to the model. Only coefficients and standard errors for the explanatory variables of interest are presented.
Table 2: Regression results
| Great Britain | ||||
|---|---|---|---|---|
| Log(Price) | ||||
| -1 | -2 | -3 | -4 | |
| Small functional green space within 200m | -0.0409*** | 0.0059*** | 0.0066*** | 0.0053*** |
| -0.0024 | -0.0012 | -0.0012 | -0.001 | |
| Medium functional green space within 200m | -0.0440*** | 0.0059*** | 0.0069*** | 0.0060*** |
| -0.0026 | -0.0013 | -0.0013 | -0.0011 | |
| Large functional green space within 200m | -0.0335*** | 0.0116*** | 0.0127*** | 0.0107*** |
| -0.0028 | -0.0014 | -0.0014 | -0.0011 | |
| Very large functional green space within 200m | -0.0102*** | 0.0161*** | 0.0170*** | 0.0145*** |
| -0.0034 | -0.0017 | -0.0017 | -0.0014 | |
| Small blue space within 200m | 0.0269*** | 0.0097*** | 0.0091*** | 0.0093*** |
| -0.0029 | -0.0015 | -0.0015 | -0.0012 | |
| Medium blue space within 200m | 0.0262*** | 0.0104*** | 0.0099*** | 0.0102*** |
| -0.003 | -0.0016 | -0.0016 | -0.0013 | |
| Large blue space within 200m | 0.0113*** | 0.0107*** | 0.0106*** | 0.0126*** |
| -0.0034 | -0.0017 | -0.0017 | -0.0014 | |
| Very large blue space within 200m | -0.0069 | 0.0269*** | 0.0269*** | 0.0358*** |
| -0.0045 | -0.0025 | -0.0025 | -0.0023 | |
| Small area of natural land cover within 200m | -0.1127*** | -0.0373*** | -0.0365*** | -0.0335*** |
| -0.0176 | -0.0139 | -0.0137 | -0.0093 | |
| Medium area of natural land cover within 200m | -0.1171*** | -0.0464*** | -0.0471*** | -0.0411*** |
| -0.0177 | -0.0139 | -0.0138 | -0.0094 | |
| Large area of natural land cover within 200m | -0.1157*** | -0.0489*** | -0.0498*** | -0.0418*** |
| -0.0178 | -0.0139 | -0.0138 | -0.0094 | |
| Very large area of natural land cover within 200m | -0.1077*** | -0.0494*** | -0.0506*** | -0.0439*** |
| -0.0179 | -0.014 | -0.0138 | -0.0094 | |
| MSOA | Yes | Yes | Yes | Yes |
| Acorn | No | Yes | Yes | Yes |
| Distance to other amenities | No | No | Yes | Yes |
| Property characteristics | No | No | No | Yes |
| Observations | 2,628,660 | 2,628,660 | 2,628,660 | 2,626,103 |
| Adjusted R-squared | 0.3666 | 0.7199 | 0.723 | 0.8047 |
| Source: Office for National Statistics | ||||
| Notes: | ||||
| 1. *p less than 0.1 | ||||
| 2. **p less than 0.05 | ||||
| 3. ***p less than 0.01 | ||||
Download this table Table 2: Regression results
.xls (40.4 kB)In model 2 the ACORN dataset is included, which segments Great Britain into neighbourhood types at individual street level, based on demographic and social information such as income and crime rates.Including this dataset increases the R2 from 0.366 to 0.719, indicating it has strong explanatory power. Interestingly, controlling for the socio-economic characteristics of the street changes the sign of the coefficients for all different area categories of FGS within 200 metres. The coefficient changes from negative to positive with the coefficient increasing with the area itself.
In model 3 distance to local non-environmental amenities are included, such as distance to nearest retail cluster and train station. Model 4 then includes property characteristics, such as number of bedrooms, size of building and area of residential garden. This is the preferred specification as it includes the widest set of covariates.
Valuation of monetary stock
To value the ecosystem services urban nature provides, the dataset is split into a training and a test dataset, we randomly allocate 20% of our data to the training dataset and 80% to the test dataset.
The training dataset is used to estimate the model and the test dataset to assess the predictive power of the model using the root mean square error (RMSE) as a metric of predictive performance. We compute the RMSE of three different model specifications. The first specification includes all the variables used in our preferred specification (see the Model specification section) except information on green and blue spaces. The second model adds areas of blue and green spaces within a 200-metre radius. The third model further includes areas of blue and green spaces within 100, 200 and 500 metres of the properties. We find that the third model has the lowest RMSE.
Using this model, the predicted average property price in our test data is £246,010. The predicted average property price in the absence of green and blue spaces is £241,197, which is £4,813 lower than the predicted average price using the real data. We conclude that in the absence of green and blue spaces, property prices in Great Britain would be £4,813 lower and this reflects the value of services provided by green and blue spaces.
Assuming the value implicit in property price is the same in Northern Ireland as in Great Britain and the sample used is representative of the property stock, which may not be the case1, by multiplying £4,813 by the number of residential properties (27.2 million), we obtain an estimate of £130.9 billion for the stock value of blue and green spaces.
Notes for: Summary statistics
- For example, small starter homes sell much more frequently than other types of property and therefore will be over-represented in the data.
5. Interpretation and application to natural capital accounting
Estimates of the association between green and blue spaces and property prices may not reflect a causal relationship. The model has controlled for a wide range of property and socio-economic characteristics, however, there is always a possibility that an important variable has been omitted. That said, high R-squared values indicate that the model explains over 80% of the variance in property prices, suggesting that many factors relevant for determining property prices have been included.
Vegetation and green and blue space in urban areas can be thought of as natural assets supplying several ecosystem services that the economy and society benefit from. For example, food, clean air or opportunity for recreation.
Values obtained through the hedonic pricing method (HPM) estimate a bundle of ecosystem services and it is not possible currently to disentangle why nature near property is important to the buyer and therefore difficult to determine which ecosystem services are captured through the HPM. It could be suggested that the buyers of properties must be aware of the services provided by natural capital for those services to be reflected in property prices. We work on the assumption that much of the value captured is that from cultural services, such as recreation and attractive views, rather than regulating services such as carbon sequestration and temperature regulation, which people are less likely to be aware of.
The results support this as functional green space, such as a park or golf course, has a positive effect on property prices, whereas natural land cover, which includes grassland, heath and scrub, has a negative effect. This suggests that it is the functionality and accessibility of the green space that is valued by property buyers, rather than aesthetics or regulating services.
Table 3 summarises the types of services that could be captured and the potential overlap with other ecosystem services already included in the accounts.
Table 3: Services potentially captured by the Hedonic Pricing Method and likelihood to overlap existing estimates
| Ecosystem service | Likelihood overlap with existing accounting estimates |
|---|---|
| Physical health benefits | Dependent upon how health benefits and the associated service are defined and measured. Needs additional investigation. |
| Recreation | The hedonic pricing method (HPM) can potentially capture the additional value of local recreational trips not incurring cash expenses, which are not currently included in monetary accounts. There would need to be consistency between the average distance of local walked trips and the radius used in HPM. |
| Urban cooling | No overlap. The methodology for temperature regulation involves averaging across urban areas and focuses on savings in output and energy costs. |
| Carbon sequestration | No overlap. |
| Provisioning services, such as food and material production | No overlap. House prices will be sensitive to the size of a domestic garden but not necessarily specific uses of it such as garden produce. Gardens are excluded from the hedonic results. |
| Air quality regulation | Potential for overlap, although air filtration accounting estimates are not modelled at the same localised scale as HPM. Whilst air pollution levels do affect property prices, we are interested in the role of air filtration by vegetation, which is more marginal. Needs additional investigation. |
| Noise regulation | Potential for overlap, needs additional investigation. Whilst noise pollution clearly affects property prices, we are interested in the role of vegetation in reducing noise, which is more marginal. |
| Source: Office for National Statistics | |
Download this table Table 3: Services potentially captured by the Hedonic Pricing Method and likelihood to overlap existing estimates
.xls (36.4 kB)6. Next steps
The hedonic pricing method has provided experimental estimates of the value of green and blue spaces. Further work is needed to expand these results to UK estimates (currently Great Britain only) and assess how the stock value can be transformed into annual flow values. Methodologically, the use of data from the Valuation Office Agency and the Land Registry in future iterations may improve the robustness of estimates.
More work is also needs to be done to measure the extent of linear natural capital features such as hedgerows and street trees, which are major components of the urban fabric but are not currently included.
Nôl i'r tabl cynnwys7. Annex 1: Variables for hedonic regression
Table 4: Variables for the hedonic regression model
| Characteristic Vector | Component Variables | Sources |
|---|---|---|
| Structural characteristics | Number of bedrooms | Zoopla |
| Property area (square feet) | Ordnance Survey | |
| Property type: house, bungalow, flat | ||
| Property attributes based on description for example. garage | ||
| Neighbourhood characteristics | Distance to train station | Ordnance Survey |
| Office for National Statistics | ||
| Distance to local labour market | ||
| Distance to nearest transport infrastructure | ||
| Distance to nearest retail cluster | ||
| Travel to work area | ||
| Middle layer super output area | ||
| Socio-economic characteristics | ACORN | CACI |
| Environmental amenities | Distance to green space | |
| Distance to blue space | ||
| Area of Natural Features in radius of property (100 metres, 200 metres, 500 metres) | Ordnance Survey | |
| Area of functional green space in radius of property (100m,200m,500m) | ||
| Area of blue space in radius of property (11 metres, 200 metres, 500 metres) | ||
| Function of green space | ||
| Area of residential garden | ||
| Source: Office for National Statistics | ||
Download this table Table 4: Variables for the hedonic regression model
.xls (37.4 kB)Manylion cyswllt ar gyfer y Casgliad
Hamish.Anderson@ons.gov.uk, Vahe.Nafilyan@ons.gov.uk
Ffôn: +44 (0)1633 455046